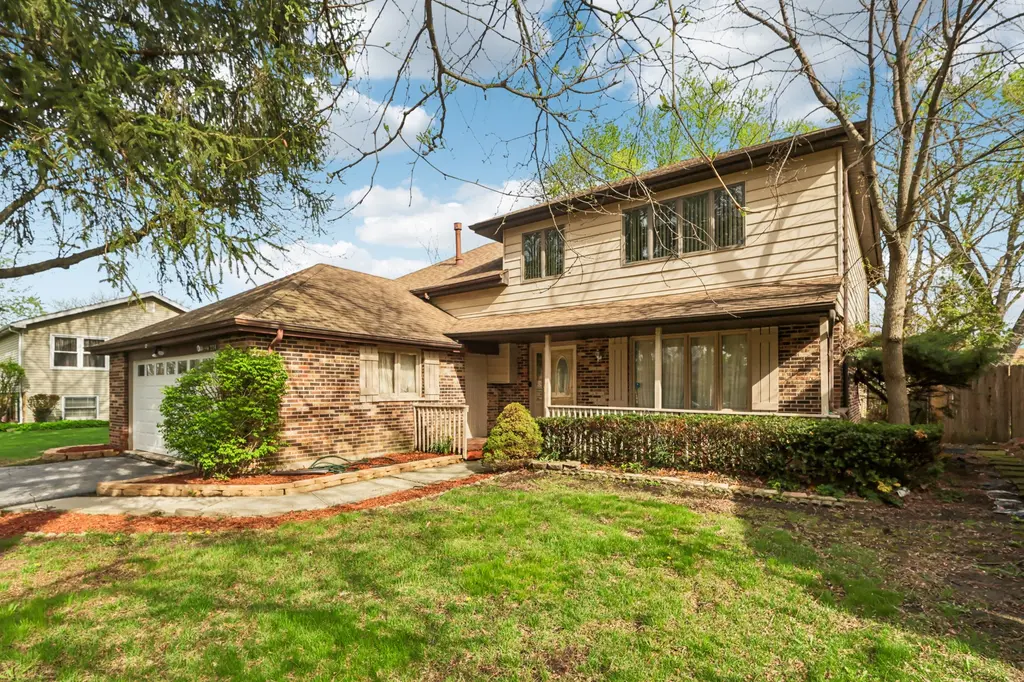
1114 185th Pl · Homewood, IL
Flood risk 1/10 · Minimal
- FEMA flood zone
- X (unshaded)
- Chance of flooding over 30 yrs
- 0.0%
- Est. flood insurance / yr
- $473 – $860
Fire risk 1/10 · Minimal
- Est. fire insurance / yr
- $804 – $1,492
Heat risk 3/10 · Minor
- Hot days now (above 101°F)
- 7 days/yr
- Hot days in 30 yrs
- 15 days/yr
Wind risk 2/10 · Minimal
- Chance of severe wind over 30 yrs
- —
Air-quality risk 4/10 · Minor
- Unhealthy air days now
- 4 days/yr
- Unhealthy air days in 30 yrs
- 5 days/yr
Risk factors via First Street. Map © Google.
Why this score? — see what drove the F grade
The composite is a weighted blend of 9 inputs, each scored 0–100. Each bar is that input's sub-score; the figure is the points it added to the 100-point composite (weight × sub-score).
- Cash flow +8.2/30.0
- ARV discount +7.8/15.0
- 1% rule +4.4/10.0
- Livability +4.0/5.0
- Rent growth +2.5/5.0
- Condition / age +2.5/5.0
- Schools +2.4/10.0
- DSCR +2.2/10.0
- Appreciation +0.0/10.0
$315,000
🖨 Deal sheet 📄 Offer letter ✓ Due diligence
Listing remarks
Spacious 5-bedroom, 3-bath split-level home with an attached 2-car garage is ready for you to make it your own. The main level features a bright living room that flows seamlessly into an L-shaped dining room. The updated white kitchen boasts newer stainless steel appliances, ample counter space, and room for a breakfast table, and opens to a cozy family room with a classic brick fireplace. Upstairs, you'll find four generously sized bedrooms, including an incredible primary suite that occupies its own private level. This retreat features vaulted ceilings, space for a seating area, and a private balcony. The en suite bath includes a Jacuzzi tub, dual vanity, walk-in shower, and skylights. An
Key facts
- 2 garage spots
- Built 1979
- Listed 59 days
Property features AI
Finance
- HOA & community: No master association fee required; Community features include park access, curbs, sidewalks and street lights
Exterior
- Parking: Attached garage (garage owned) with garage door opener; Asphalt driveway; Two total parking spaces (2 garage spaces)
- Utilities: Public water; Public sewer; Electric with circuit breakers
- Home design: Detached single-family home; Split level with subordinate levels; Fee simple ownership
- Construction: Vinyl siding and brick exterior; Built approximately 41–50 years ago
- Exterior features: Deck; Balcony; Fenced yard; Street paved with curbs, sidewalks and street lights; Close to park and commuter transit access
Interior
- Kitchen: Country-style, updated kitchen; Range; Range hood; Dishwasher; Refrigerator; Stainless steel appliances
- Bedrooms: Four bedrooms on upper/main levels with a fifth bedroom in the basement (possible 5th bedroom); Master bedroom on third level
- Flooring: Laminate flooring in many main living areas; Wood laminate in several rooms including family room and master bedroom; Parquet flooring in some second-floor bedrooms; Carpet in at least one bedroom; Ceramic tile in the kitchen
- Bathrooms: Three full bathrooms; Bathrooms include whirlpool, separate shower, double sink and soaking tub; Basement bathroom(s) present
- Heating & cooling: Natural gas heating; Forced air; Multiple heating systems (2+); Central air conditioning
- Interior features: Dining area combined with other living space; French doors; Skylight(s); Drapes; Window screens; Ceiling fan(s); Sump pump; Finished full basement; Unfinished attic; 11 total rooms; One wood-burning fireplace in the family room
- Laundry & utility: Main-level laundry; Washer and dryer included; Gas dryer hookup; In-unit laundry
Neighborhood map
What this means for you Summary
Snapshot
- This is a 3-bed/1.5-bath single-family listed at $315k.
Deal economics
- At list price, monthly cash flow is $-293 ($-4k/yr) — negative.
- To cash-flow at today's rent, offer at most $263k (16.4% below list).
- To meet the 1% rule (rent ≥ 1% of price), the offer needs to be $296k (5.9% below list).
- Recommended offer: $263k (16.4% below list) — sets the bar for cash-flow.
Location & tenants
- Location reads 81/100 on livability (#81 in IL, #1,314 nationally) — a professional / high-income tenant draw. Strengths: commute A+, employment A+, cost of living A+; Watch: amenities F.
- Homewood Flossmoor Chsd 233 (suburban): math 21% / reading 27% proficiency, ranked #272 of 620 in IL (top 44%) — low school quality limits family demand, transient renter base, plan for 1-2y turnover.
- Zoned schools: Homewood-Flossmoor High School (math 21% / reading 27%, grade F, #304 of 693 statewide, top 44%, 2,798 students, 0% FRL).
- Market conditions: 101 active listings in the ZIP; 6 comparable units currently listed for rent nearby; rentals at typical pace (median 22d on market — plan ~3-4 weeks tenant-placement turnaround); 6,272 units permitted in Cook County in 2024 (4,658 in 5+ unit buildings).
Forward outlook
- Local home prices are declining (-3.0%/yr); year-one equity from $2k of loan paydown is wiped out by about $9k of value loss. Plan a longer hold.
Negotiation context
- It's been on market 59 days — a 3% lower offer ($306k) is reasonable based on typical stale-listing flexibility.
- 3 sale attempts since 7y ago with the ask held roughly flat each time — persistent listings suggest the price (not the market) is what's stuck; bring a comps-based counter.
- Current owner paid $200k; list at $315k implies a 57% gain — meaningful room to come down on a strong offer.
Risks & watch-outs
- Watch-outs: property tax is 3.2% of price.
Questions for the listing agent
- What do current leases actually rent for vs. the listed asking? Can we see a recent rent roll and the last 12 months of T-12 income?
- It's been on market 59 days. Have you received any prior offers? Is the seller open to a 16% concession, seller financing, or rate buy-down credit?
- Built in 1979 — when were the roof, HVAC, electrical panel, plumbing, and water heater last replaced?
- Property tax is high relative to price — has the assessment been appealed recently, and will the sale trigger a re-assessment?
- Is there a deadline driving the sale (1031 exchange, divorce, estate, relocation)? That informs how much negotiation room exists.
- Schools are D-rated, which usually means shorter tenancies and higher turnover. Who's the typical renter profile here, and what's been the actual vacancy rate?
- The area grade is low — what's the realistic commute time and amenity access for the typical tenant pool here? Any planned neighborhood developments (good or bad) we should know about?
- What's the average days-on-market for RENTAL listings here right now (not sales)? A rising rental-DOM trend means longer vacancies and softer asking-rent achievability than the comps imply.
- What's the recent tenant-quality profile in this submarket — average credit score on applications, eviction rate, late-payment / NSF rate, and stable-employment percentage? A property-management company in the area should have these aggregated.
- How much new for-sale + rental construction is in the pipeline within 1–3 miles? Heavy new supply typically softens prices + rents 12–24 months out; constrained supply supports both.
Investment metrics
- 1% rule
- 0.94% ✗
- Cap rate
- 5.18%
- Cash-on-cash
- -3.98%
- DSCR
- 0.82
- GRM
- 8.9
CMA / ARV
- ARV (on-the-fly)
- $317,202
- Comps found
- 12
Show comp detail 12 sales within ~0.75 mi
| Address | Dist | Beds/Ba | Sqft | Sold | Price | $/sf | Match |
|---|---|---|---|---|---|---|---|
| 1037 185th Pl | 0.09mi | 3/2.0 | 1,800 (-1%) | 1mo | $400,000 | $222 | 91 |
| 1326 Hillview Rd | 0.32mi | 4/2.5 (+1) | 1,751 (-4%) | 4mo | $309,000 | $176 | 66 |
| 18441 Marshfield Ave | 0.65mi | 3/1.5 | 1,855 (+2%) | 0mo | $345,000 | $186 | 66 |
| 1631 187th St | 0.69mi | 3/1.5 | 1,878 (+3%) | 0mo | $260,000 | $138 | 63 |
| 18234 Riegel Rd | 0.69mi | 3/2.0 | 1,786 (-2%) | 1mo | $150,000 | $84 | 62 |
| 939 Coach Rd | 0.35mi | 4/3.0 (+1) | 1,712 (-6%) | 1mo | $279,000 | $163 | 61 |
| 1308 W 191st St | 0.74mi | 3/2.0 | 1,820 (-0%) | 3mo | $251,000 | $138 | 61 |
| 18834 Loomis Ave | 0.55mi | 4/2.5 (+1) | 1,785 (-2%) | 2mo | $313,500 | $176 | 61 |
| 223 W Rainbow Dr | 0.70mi | 3/2.0 | 1,803 (-1%) | 4mo | $280,000 | $155 | 60 |
| 18000 Armitage Ct | 0.72mi | 4/2.5 (+1) | 1,839 (+1%) | 3mo | $340,000 | $185 | 54 |
| 831 W Arquilla Dr | 0.70mi | 3/2.0 | 1,612 (-12%) | 1mo | $279,900 | $174 | 45 |
| 224 N Pleasant Dr | 0.73mi | 4/2.5 (+1) | 1,650 (-10%) | 1mo | $135,000 | $82 | 40 |
Match score weights: distance 35% · size 25% · config 20% · recency 20%. Top-matched comps best support the ARV.
Projected returns pro-forma
-3.0% appreciation · 3.0% rent growth · sell at horizon
- IRR
- -22.9%
- Equity multiple
- 0.21×
- Total profit
- $-69,361
- Equity at exit
- $46,968
- IRR
- -16.9%
- Equity multiple
- 0.06×
- Total profit
- $-83,082
- Equity at exit
- $27,235
Cash invested: $88,200 (down + closing). Projections, not guarantees.
Landlord ↔ Tenant lean methodology
- Overall (STATE)
- 43 Moderately Tenant-Leaning
- State Illinois
- 43 Moderately Tenant-Leaning · D+7
- County
- — inherits STATE
- City
- — inherits STATE
ZIP-level market 60430
- Home prices YoY
- -32.1%
- Active inventory
- 101
- Price-to-rent
- 8.9×
Monthly cashflow live
- Estimated rent
- $2,963 high interval (Pro) →
- Mortgage (P&I)
- −$1,652
- Tax from tax record
- −$850 /mo · $10,202/yr
- Insurance
- −$131
- HOA
- −$0
- Vacancy / Maint / Mgmt
- −$622
- Net cashflow
- $-293
Break-even live
UW: 25.0% down · 7.5% · 30yr · 1.5% tax · 5.0% vac · 8.0% maint · 8.0% mgmt
Financing live
Cash to close
- Down payment
- $78,750
- Closing costs
- $9,450
- Reserves months
- —
- Total cash needed
- —
Loan-product check · same deal, 3 products live
Conventional
25% down · 7.5% · 30yr
- Down + closing
- —
- Monthly P&I
- —
- Monthly cashflow
- —
- DSCR
- —
- Eligible?
- —
Personal DTI + credit; lowest rate.
DSCR
20% down · 8.5% · 30yr
- Down + closing
- —
- Monthly P&I
- —
- Monthly cashflow
- —
- DSCR
- —
- Eligible?
- —
No personal income docs; deal must DSCR.
Hard money
10% down · 12.0% · 12mo
- Down + closing
- —
- Monthly P&I
- —
- Monthly cashflow
- —
- DSCR
- —
- Eligible?
- —
Short-term bridge; refi at stabilization.
Rent comps 6 comps
| Address | Beds | Baths | Sqft | Rent | $/sqft | DOM | Units | Dist |
|---|---|---|---|---|---|---|---|---|
| 1332 Jamie Ln Homewood, IL | 4.0 | 2.5 | 1576 | $3,171 | $2.01 | 24d | 1 | 0.48mi |
| 18117 Loomis Ave Homewood, IL | 4.0 | 2.0 | 1500 | $2,800 | $1.87 | 4d | 1 | 0.62mi |
| 1601 183rd St Unit 1237861P Homewood, IL | 3.0 | 1.5 | 1528 | $8,665 | $5.67 | 22d | 1 | 0.67mi |
| 705 W Fitzhenry Ct Glenwood, IL | 3.0 | 2.0 | 1600 | $2,950 | $1.84 | 20d | 1 | 0.86mi |
| 705 W Fitzhenry Ct Glenwood, IL | 3.0 | 2.0 | 1700 | $2,950 | $1.74 | 24d | 1 | 0.86mi |
| 1802 Evergreen Rd Homewood, IL | 4.0 | 2.0 | 1716 | $2,836 | $1.65 | 6d | 1 | 0.91mi |
Listing history 24 events
-
2026-06-18days on market $315,000 Active 59 DOM
-
2026-06-17days on market $315,000 Active 58 DOM
-
2026-06-16days on market $315,000 Active 57 DOM
-
2026-06-15days on market $315,000 Active 56 DOM
-
2026-06-13days on market $315,000 Active 54 DOM
-
2026-06-09days on market $315,000 Active 50 DOM
-
2026-06-08days on market $315,000 Active 49 DOM
-
2026-06-07days on market $315,000 Active 48 DOM
-
2026-06-04days on market $315,000 Active 45 DOM
-
2026-06-03days on market $315,000 Active 44 DOM
-
2026-06-02days on market $315,000 Active 43 DOM
-
2026-06-01days on market $315,000 Active 42 DOM
-
2026-05-31days on market $315,000 Active 41 DOM
-
2026-05-05price $315,000
-
2026-04-20$325,000 Active
-
2026-04-17historical
-
2023-10-20status Pending
-
2023-10-19historical
-
2023-10-13Active
-
2020-07-15historical
-
2019-11-21historical
-
2019-10-08price
-
2019-07-15New
-
1999-06-15soldstatus $200,000
ⓘ Source: listings_history table (triggers on properties + properties_extension) + one-shot
backfill from property_details.listing_events for pre-trigger history.
Tax reassessment forecast IL · Partial reset (capped growth)
- Current annual tax
- $10,202 · $850/mo
- Projected year-2 tax
- $10,202 · $850/mo
- Expected delta
- $0/yr ($0/mo · 0.0%)
ⓘ Screening estimate from a state-policy table — verify with the county assessor before closing.
Climate risk First Street
- Flood 1/10 Low FEMA zone X (unshaded) · 0% chance over 30 yrs
- Wildfire 1/10 Low
- Heat 3/10 Moderate 7 d/yr ≥101°F today · 15 d/yr by 30 yrs out
- Wind 2/10 Low
- Air quality 4/10 Moderate 4 unhealthy d/yr today · 5 by 30 yrs out
Nearby sold comps map
Loading sold comps map…
Walkable amenities ~0.75 mi
Loading nearby amenities…
Taxation est. · year 1
- Rental income
- $35,553
- − Mortgage interest
- −$17,645
- − Property taxes
- −$10,202
- − Insurance
- −$1,575
- − Repairs & maintenance
- −$2,844
- − Management
- −$2,844
- − Depreciation
- −$9,164
- Taxable loss
- −$8,721
- Est. tax savings @ 24.0%
- +$2,093
- After-tax cash flow
- $-1,420/yr
For passive investors: Depreciation is non-cash, so a rental often shows a tax loss while cash-flowing — sheltering income. Rental losses are passive: they offset passive income freely, and up to $25,000/yr can offset ordinary (W-2) income if you actively participate and your MAGI is under $100k (phasing out to $0 by $150k); unused losses carry forward. On sale, claimed depreciation is recaptured at up to 25%, and gains may owe capital-gains tax (a 1031 exchange can defer both). Figures are a year-1 estimate at your 24.0% rate — not tax advice; consult a CPA.
Schools (NCES district)
- District
- Homewood Flossmoor Chsd 233
- NCES district ID
- 1719560
- Math proficiency
- 21% ▼ -15.00%
- Reading proficiency
- 27% ▼ -13.00%
- Median HH income
- $83,564
- Composite
- 24.42/100
- National rank
- #7681
- State rank
- #272 of 620 in IL
Livability — Homewood
- Score
- 81/100
- State rank
- #81
- US rank
- #1314
Category grades
Schools grade is shown separately in the Schools card above.
Census & demographics
- Census place
- Homewood, IL
- City population
- 19,993
- Population (ZIP)
- 19,993
Population outlook (Cook County) Hauer SSP2
- Today (2025)
- 5,347,519 people
- By 2030
- 5,357,703 · +0.2%
- By 2040
- 5,324,924 · -0.4%
- By 2050
- 5,230,762 · -2.2%
- By 2075
- 4,785,735 · -10.5%
- By 2100
- 4,188,836 · -21.7%
Race, ethnicity, and origin ACS 2023
- Neighborhood character
- Diverse neighborhood (Simpson 0.62)
- Race & ethnicity
- Black 44% White 42% Hispanic / Latino 9% Two or more races 6% Asian 1%
- Hispanic origin (detail)
- Mexican 7%
- Common ancestry
- Romanian 5% Iranian 2% Italian 2%
- Foreign-born
- 6% · Canada, Dominican Republic
- Languages at home
- 91% English-only · Spanish 5% Russian/Polish/Slavic 1% German/W. Germanic 1%
Political lean MEDSL · Cook
- 2024 margin
- Solid D (+42.0) · D 70.4% · R 28.4% · Other 1.2%
- 2008→2024 swing
- -11.4pp toward R · 2008: 53.4pp · 2024: 42.0pp
- All cycles
- 2024: D+42.0 2020: D+50.3 2016: D+53.0 2012: D+49.4 2008: D+53.4
Not yet ingested
- Civics
- —
Market trends
- HPI YoY
- ▼ -105.00%
- Current HPI
- 222.2923
- Rent YoY
- —
- Metro
- —
- State GDP YoY
- ▲ 1.59%
- F500 in state
- 60
Industry mix (Fortune 500 HQ in IL)
| Industry | F500 HQs | Revenue |
|---|---|---|
| Insurance | 4 | $201B |
|
||
| Consumer Goods | 4 | $87B |
|
||
| Industrial Machinery | 3 | $64B |
|
||
| Healthcare | 2 | $55B |
|
||
| Retail / Pharmacy | 1 | $148B |
|
||
| Agriculture / Food | 1 | $86B |
|
||
Price history
+57.5% since first listed11 events — show timeline
- 2026-05-05 Price Changed $315,000 MRED as Distributed by MLS Grid
- 2026-04-20 Listed $325,000 MRED as Distributed by MLS Grid
- 2026-04-17 Listing Removed — MRED as Distributed by MLS Grid
- 2023-10-20 Pending — MRED as Distributed by MLS Grid
- 2023-10-19 Listing Removed — MRED as Distributed by MLS Grid
- 2023-10-13 Listed — MRED as Distributed by MLS Grid
- 2020-07-15 Listing Removed — MRED as Distributed by MLS Grid
- 2019-11-21 Listing Removed — MRED as Distributed by MLS Grid
- 2019-10-08 Price Changed — MRED as Distributed by MLS Grid
- 2019-07-15 Listed — MRED as Distributed by MLS Grid
- 1999-06-15 Sold (Public Records) $200,000 Public Records
Property tax history
+4.6%/yrLatest (2023): $10,202 · +48.8% YoY. Source: county tax records.
Cash-flow waterfall
monthlySold comps — $/sqft
last 12 mo · ≤1 miLoading sold comps…