920 E Hoffman St · Three Rivers, MI
Flood risk 1/10 · Minimal
- FEMA flood zone
- X (unshaded)
- Chance of flooding over 30 yrs
- 0.0%
- Est. flood insurance / yr
- $473 – $860
Fire risk 1/10 · Minimal
- Est. fire insurance / yr
- $784 – $1,456
Heat risk 2/10 · Minimal
- Hot days now (above 100°F)
- 7 days/yr
- Hot days in 30 yrs
- 16 days/yr
Wind risk 2/10 · Minimal
- Chance of severe wind over 30 yrs
- —
Air-quality risk 2/10 · Minimal
- Unhealthy air days now
- 1 days/yr
- Unhealthy air days in 30 yrs
- 2 days/yr
Risk factors via First Street. Map © Google.
Why this score? — see what drove the B- grade
The composite is a weighted blend of 9 inputs, each scored 0–100. Each bar is that input's sub-score; the figure is the points it added to the 100-point composite (weight × sub-score).
- Cash flow +25.2/30.0
- ARV discount +15.0/15.0
- DSCR +8.3/10.0
- 1% rule +6.0/10.0
- Schools +3.5/10.0
- Livability +3.5/5.0
- Rent growth +2.5/5.0
- Condition / age +2.5/5.0
- Appreciation +0.0/10.0
$99,000
🖨 Deal sheet 📄 Offer letter ✓ Due diligence
Listing remarks MLS
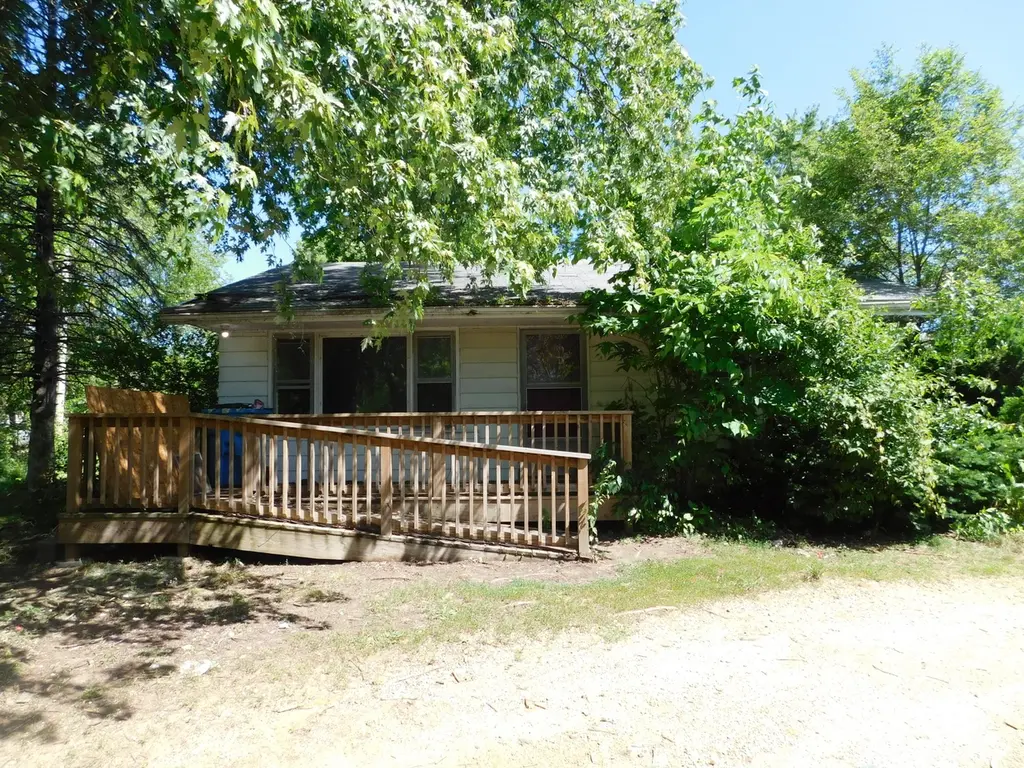
Home features two bedroom, attached garage, and a full basement. Outside you'll find a large shaded lot on the outskirts of town. Come see this home today and let your imagination run wild.
Key facts
- Attached garage
- Full basement
- Large shaded lot
Tags
Property features AI
Exterior
- Parking: Detached 1-car garage
- Utilities: Public water
- Home design: Ranch single-family residence; One story
- Construction: Vinyl siding; Built in 1919
- Exterior features: 1.13-acre lot; Public water
Interior
- Bathrooms: 1 full bathroom
- Heating & cooling: Forced air heating
- Interior features: Ramped entrance; 5 total rooms; Full basement
Neighborhood map
What this means for you Summary
Snapshot
- This is a 2-bed/1.0-bath single-family listed at $99k.
Deal economics
- At list price, monthly cash flow is $221 ($3k/yr) — positive.
- The deal already cash-flows at list — no discount required.
- Meets the 1% rule at list price ($1k rent vs $99k).
- Cap rate 9.0% vs local median 5.2% in Three Rivers — top-decile yield for the area; either an underpriced asset or a hidden risk that comps aren't pricing in. Stress-test before assuming the spread holds.
Location & tenants
- Location reads 70/100 on livability (#306 in MI) — a middle-class / working-renter tenant base. Strengths: cost of living A+, housing A+, health & safety A+; Watch: schools D+, crime D, amenities F.
- Three Rivers Community Schools (town): math 37% / reading 45% proficiency, ranked #200 of 540 in MI (top 37%) — families likely to look elsewhere, expect single-tenant / working-renter base with shorter leases.
- Market conditions: 178 active listings in the ZIP; 125 units permitted in St. Joseph County in 2024 (0 in 5+ unit buildings).
Forward outlook
- Local home prices are declining (-3.0%/yr); year-one equity from $684 of loan paydown is wiped out by about $3k of value loss. Plan a longer hold.
- St. Joseph County population projected at -16% by 2050 — secular population decline; favor cash flow + early exit over multi-decade hold.
Negotiation context
- Only 7 days on market — expect competitive offers; lowballing is unlikely to land.
- 3 sale attempts with the ask held roughly flat each time — persistent listings suggest the price (not the market) is what's stuck; bring a comps-based counter.
Questions for the listing agent
- Is there a deadline driving the sale (1031 exchange, divorce, estate, relocation)? That informs how much negotiation room exists.
- Schools are D-rated, which usually means shorter tenancies and higher turnover. Who's the typical renter profile here, and what's been the actual vacancy rate?
- Crime grade is D in this area — have there been break-ins, vandalism, or insurance claims at this property in the last 3 years? What carrier currently insures it and at what premium?
- What's the average days-on-market for RENTAL listings here right now (not sales)? A rising rental-DOM trend means longer vacancies and softer asking-rent achievability than the comps imply.
- What's the recent tenant-quality profile in this submarket — average credit score on applications, eviction rate, late-payment / NSF rate, and stable-employment percentage? A property-management company in the area should have these aggregated.
- How much new for-sale + rental construction is in the pipeline within 1–3 miles? Heavy new supply typically softens prices + rents 12–24 months out; constrained supply supports both.
Investment metrics
- 1% rule
- 1.10% ✓
- Cap rate
- 8.97%
- Cash-on-cash
- 9.56%
- DSCR
- 1.43
- GRM
- 7.6
CMA / ARV
- ARV (on-the-fly)
- $150,592
- Comps found
- 3
Show comp detail 3 sales within ~0.75 mi
| Address | Dist | Beds/Ba | Sqft | Sold | Price | $/sf | Match |
|---|---|---|---|---|---|---|---|
| 1224 Shiawassee River Rd | 0.31mi | 2/— | 883 (+6%) | 20mo | $32,500 | $37 | 59 |
| 415 Eleventh Ave | 0.46mi | 3/1.0 (+1) | 936 (+12%) | 24mo | $182,000 | $194 | 33 |
| 607 E Hoffman St | 0.69mi | 2/1.0 | 720 (-14%) | 16mo | $130,000 | $181 | 32 |
Match score weights: distance 35% · size 25% · config 20% · recency 20%. Top-matched comps best support the ARV.
Projected returns pro-forma
-3.0% appreciation · 3.0% rent growth · sell at horizon
- IRR
- -1.9%
- Equity multiple
- 0.93×
- Total profit
- $-1,987
- Equity at exit
- $14,761
- IRR
- 7.8%
- Equity multiple
- 1.59×
- Total profit
- $16,340
- Equity at exit
- $8,560
Cash invested: $27,720 (down + closing). Projections, not guarantees.
Landlord ↔ Tenant lean methodology
- Overall (STATE)
- 62 Landlord-Friendly
- State Michigan
- 62 Landlord-Friendly · EVEN
- County
- — inherits STATE
- City
- — inherits STATE
ZIP-level market 49093
- Active inventory
- 178
- Price-to-rent
- 7.6×
Monthly cashflow live
- Estimated rent
- $1,092 medium interval (Pro) →
- Mortgage (P&I)
- −$519
- Tax from tax record
- −$81 /mo · $973/yr
- Insurance
- −$41
- HOA
- −$0
- Vacancy / Maint / Mgmt
- −$229
- Net cashflow
- $221
Break-even live
UW: 25.0% down · 7.5% · 30yr · 1.5% tax · 5.0% vac · 8.0% maint · 8.0% mgmt
Financing live
Cash to close
- Down payment
- $24,750
- Closing costs
- $2,970
- Reserves months
- —
- Total cash needed
- —
Loan-product check · same deal, 3 products live
Conventional
25% down · 7.5% · 30yr
- Down + closing
- —
- Monthly P&I
- —
- Monthly cashflow
- —
- DSCR
- —
- Eligible?
- —
Personal DTI + credit; lowest rate.
DSCR
20% down · 8.5% · 30yr
- Down + closing
- —
- Monthly P&I
- —
- Monthly cashflow
- —
- DSCR
- —
- Eligible?
- —
No personal income docs; deal must DSCR.
Hard money
10% down · 12.0% · 12mo
- Down + closing
- —
- Monthly P&I
- —
- Monthly cashflow
- —
- DSCR
- —
- Eligible?
- —
Short-term bridge; refi at stabilization.
Listing history 7 events
-
2026-06-13status $99,000 Pending 7 DOM
-
2026-06-10days on market $99,000 Active 7 DOM
-
2026-06-09days on market $99,000 Active 6 DOM
-
2026-06-08days on market $99,000 Active 5 DOM
-
2026-06-07days on market $99,000 Active 4 DOM
-
2026-06-03remarks 189-char remark
Show marketing remark (189 chars)
Home features two bedroom, attached garage, and a full basement. Outside you'll find a large shaded lot on the outskirts of town. Come see this home today and let your imagination run wild.
-
2026-06-03$99,000 Active 1 DOM
Show marketing remark (189 chars)
Home features two bedroom, attached garage, and a full basement. Outside you'll find a large shaded lot on the outskirts of town. Come see this home today and let your imagination run wild.
ⓘ Source: listings_history table (triggers on properties + properties_extension) + one-shot
backfill from property_details.listing_events for pre-trigger history.
Tax reassessment forecast MI · Partial reset (capped growth)
- Current annual tax
- $973 · $81/mo
- Projected year-2 tax
- $1,249 · $104/mo
- Expected delta
- +$276/yr (+$23/mo · 28.3%)
ⓘ Screening estimate from a state-policy table — verify with the county assessor before closing.
Climate risk First Street
- Flood 1/10 Low FEMA zone X (unshaded) · 0% chance over 30 yrs
- Wildfire 1/10 Low
- Heat 2/10 Low 7 d/yr ≥100°F today · 16 d/yr by 30 yrs out
- Wind 2/10 Low
- Air quality 2/10 Low 1 unhealthy d/yr today · 2 by 30 yrs out
Nearby sold comps map
Loading sold comps map…
Walkable amenities ~0.75 mi
Loading nearby amenities…
Taxation est. · year 1
- Rental income
- $13,099
- − Mortgage interest
- −$5,546
- − Property taxes
- −$973
- − Insurance
- −$495
- − Repairs & maintenance
- −$1,048
- − Management
- −$1,048
- − Depreciation
- −$2,880
- Taxable income
- $1,109
- Est. tax owed @ 24.0%
- −$266
- After-tax cash flow
- $2,384/yr
For passive investors: Depreciation is non-cash, so a rental often shows a tax loss while cash-flowing — sheltering income. Rental losses are passive: they offset passive income freely, and up to $25,000/yr can offset ordinary (W-2) income if you actively participate and your MAGI is under $100k (phasing out to $0 by $150k); unused losses carry forward. On sale, claimed depreciation is recaptured at up to 25%, and gains may owe capital-gains tax (a 1031 exchange can defer both). Figures are a year-1 estimate at your 24.0% rate — not tax advice; consult a CPA.
Schools (NCES district)
- District
- Three Rivers Community Schools
- NCES district ID
- 2633840
- Math proficiency
- 37% ▲ 1.00%
- Reading proficiency
- 45% ▼ -3.00%
- Median HH income
- $46,576
- Composite
- 34.97/100
- National rank
- #5058
- State rank
- #200 of 540 in MI
Livability — Three Rivers
- Score
- 70/100
- State rank
- #306
- US rank
- #7604
Category grades
Schools grade is shown separately in the Schools card above.
Census & demographics
- Census place
- Three Rivers, MI
- Population (ZIP)
- 18,439
Population outlook (St. Joseph County) Hauer SSP2
- Today (2025)
- 58,726 people
- By 2030
- 57,030 · -2.9%
- By 2040
- 53,266 · -9.3%
- By 2050
- 49,343 · -16.0%
- By 2075
- 40,441 · -31.1%
- By 2100
- 31,981 · -45.5%
Race, ethnicity, and origin ACS 2023
- Neighborhood character
- Predominantly White (84%)
- Race & ethnicity
- White 84% Two or more races 8% Hispanic / Latino 5% Black 5%
- Hispanic origin (detail)
- Mexican 4%
- Common ancestry
- Italian 11% Iranian 5% Romanian 3%
- Foreign-born
- 2% · Canada
- Languages at home
- 95% English-only · Spanish 3% Other Indo-European 1%
Political lean MEDSL · St. Joseph
- 2024 margin
- Solid R (+34.0) · D 32.2% · R 66.2% · Other 1.5%
- 2008→2024 swing
- -31.8pp toward R · 2008: -2.2pp · 2024: -34.0pp
- All cycles
- 2024: R+34.0 2020: R+31.7 2016: R+31.0 2012: R+12.3 2008: R+2.2
Not yet ingested
- Civics
- —
Market trends
- HPI YoY
- ▼ -159.07%
- Current HPI
- 226.5079
- Rent YoY
- —
- Metro
- —
- State GDP YoY
- ▲ 1.37%
- F500 in state
- 28
Industry mix (Fortune 500 HQ in MI)
| Industry | F500 HQs | Revenue |
|---|---|---|
| Automotive Parts | 3 | $48B |
|
||
| Automotive | 2 | $372B |
|
||
| Chemicals | 1 | $45B |
|
||
| Automotive Retail | 1 | $29B |
|
||
| Healthcare / Medical Devices | 1 | $23B |
|
||
| Automotive Technology | 1 | $20B |
|
||
Price history
+0.0% since first listed3 events — show timeline
- 2026-06-03 Listed $99,000 REALCOMP
- 2026-06-03 Listed $99,000 MiRealSource-MiMLS
- 2026-06-03 Listed $99,000 SW Michigan MLS
Property tax history
+2.2%/yrLatest (2025): $973 · -32.2% YoY. Source: county tax records.
Cash-flow waterfall
monthlySold comps — $/sqft
last 12 mo · ≤1 miLoading sold comps…