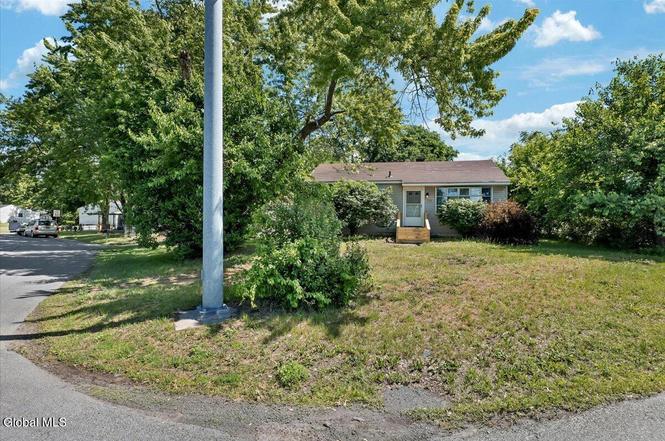
713 Watervliet Shaker Rd · Latham, NY
Flood risk 4/10 · Minor
- FEMA flood zone
- X (unshaded)
- Chance of flooding over 30 yrs
- 0.22%
- Est. flood insurance / yr
- $507 – $1,088
Fire risk 1/10 · Minimal
- Est. fire insurance / yr
- $691 – $1,283
Heat risk 4/10 · Minor
- Hot days now (above 97°F)
- 7 days/yr
- Hot days in 30 yrs
- 16 days/yr
Wind risk 3/10 · Minor
- Chance of severe wind over 30 yrs
- 6.0%
Air-quality risk 1/10 · Minimal
- Unhealthy air days now
- 0 days/yr
- Unhealthy air days in 30 yrs
- 0 days/yr
Risk factors via First Street. Map © Google.
Why this score? — see what drove the D grade
The composite is a weighted blend of 9 inputs, each scored 0–100. Each bar is that input's sub-score; the figure is the points it added to the 100-point composite (weight × sub-score).
- Cash flow +14.4/30.0
- ARV discount +7.0/15.0
- Schools +6.4/10.0
- DSCR +4.4/10.0
- 1% rule +3.7/10.0
- Rent growth +2.5/5.0
- Livability +2.5/5.0
- Condition / age +2.5/5.0
- Appreciation +0.0/10.0
$285,000
🖨 Deal sheet 📄 Offer letter ✓ Due diligence
Listing remarks MLS
Price reduced again! You can't get a house in the North Colonie School District for this price! Easy access to I-87. Fresh paint, new appliances, new garage door, new plumbing. Large flat lot. Bank owned, sold as-is, needs very little sprucing up. School taxes without STAR. Very Good Condition
Key facts
- Generously sized lot
- One-level living
- Functional layout
Tags
Property features AI
Exterior
- Parking: Detached garage; 1 garage space; 3 total parking spaces
- Utilities: 150 Amp electric service; Public water; Public sewer
- Home design: Single family residence; Fixer condition
- Construction: Vinyl siding
- Exterior features: Asphalt roof; Back yard fencing; Level, cleared lot
Interior
- Kitchen: Range; Dishwasher; Refrigerator
- Bedrooms: Three bedrooms on the first level
- Flooring: Hardwood; Ceramic tile
- Bathrooms: One full bathroom on the first level
- Heating & cooling: Forced air heating (natural gas); Central air conditioning
- Interior features: Paddle fan; 6 total rooms
- Laundry & utility: Washer and dryer included; Laundry on the main level
Neighborhood map
What this means for you Summary
Snapshot
- This is a 3-bed/1.0-bath single-family listed at $285k.
Deal economics
- At list price, monthly cash flow is $57 ($678/yr) — positive.
- The deal already cash-flows at list — no discount required.
- To meet the 1% rule (rent ≥ 1% of price), the offer needs to be $248k (13.0% below list).
- Recommended offer: $248k (13.0% below list) — sets the bar for 1% rule.
- Cap rate 6.5% vs local median 2.4% in Latham — top-decile yield for the area; either an underpriced asset or a hidden risk that comps aren't pricing in. Stress-test before assuming the spread holds.
Location & tenants
- Location reads: area grade D — affects rentability + tenant quality, not the cash-flow math above.
- North Colonie CSD (suburban): math 70% / reading 76% proficiency, ranked #102 of 590 in NY (top 17%) — strong family-tenant draw, lease renewals of 3-5y typical; only 13% free/reduced lunch — higher-income household profile.
- Zoned schools: Shaker High School (math 98% / reading 93%, grade A+, #76 of 1,100 statewide, top 7%, 2,018 students, 25% FRL).
- Zoned-school proficiency averages 96% at this address vs 73% district-wide (+22 pts) — the actual schools serving this property are materially stronger than the North Colonie CSD average implies; a family-tenant draw the district grade alone would hide.
- Market conditions: 103 active listings in the ZIP; 6 comparable units currently listed for rent nearby; rentals at typical pace (median 14d on market — plan ~3-4 weeks tenant-placement turnaround); solid renter incomes; 675 units permitted in Albany County in 2024 (451 in 5+ unit buildings).
Forward outlook
- Local home prices are declining (-3.0%/yr); year-one equity from $2k of loan paydown is wiped out by about $9k of value loss. Plan a longer hold.
- Albany County population projected at +9% by 2050 — modest demand growth; plan on rents tracking national, not racing it.
Negotiation context
- Only 1 days on market — expect competitive offers; lowballing is unlikely to land.
- 5 sale attempts since 22y ago with the ask held roughly flat each time — persistent listings suggest the price (not the market) is what's stuck; bring a comps-based counter.
- Current owner paid $117k; list at $285k implies a 144% gain — meaningful room to come down on a strong offer.
Questions for the listing agent
- Built in 1960 — when were the roof, HVAC, electrical panel, plumbing, and water heater last replaced?
- Is there a deadline driving the sale (1031 exchange, divorce, estate, relocation)? That informs how much negotiation room exists.
- The area grade is low — what's the realistic commute time and amenity access for the typical tenant pool here? Any planned neighborhood developments (good or bad) we should know about?
- What's the average days-on-market for RENTAL listings here right now (not sales)? A rising rental-DOM trend means longer vacancies and softer asking-rent achievability than the comps imply.
- What's the recent tenant-quality profile in this submarket — average credit score on applications, eviction rate, late-payment / NSF rate, and stable-employment percentage? A property-management company in the area should have these aggregated.
- How much new for-sale + rental construction is in the pipeline within 1–3 miles? Heavy new supply typically softens prices + rents 12–24 months out; constrained supply supports both.
Investment metrics
- 1% rule
- 0.87% ✗
- Cap rate
- 6.53%
- Cash-on-cash
- 0.85%
- DSCR
- 1.04
- GRM
- 9.6
CMA / ARV
- ARV (on-the-fly)
- $282,150
- Comps found
- 5
Show comp detail 5 sales within ~0.75 mi
| Address | Dist | Beds/Ba | Sqft | Sold | Price | $/sf | Match |
|---|---|---|---|---|---|---|---|
| 10 Mildred Ln | 0.10mi | 3/1.0 | 925 (-3%) | 4mo | $275,000 | $297 | 88 |
| 744 Watervliet Shaker Rd | 0.26mi | 2/1.0 (-1) | 954 (+0%) | 12mo | $258,000 | $270 | 72 |
| 22 Holly Ln | 0.28mi | 2/1.0 (-1) | 936 (-2%) | 12mo | $326,300 | $349 | 69 |
| 19 Holly Ln | 0.28mi | 3/2.0 | 988 (+4%) | 10mo | $295,000 | $299 | 68 |
| 28 Sherwood Dr | 0.23mi | 3/1.0 | 825 (-13%) | 8mo | $205,000 | $248 | 61 |
Match score weights: distance 35% · size 25% · config 20% · recency 20%. Top-matched comps best support the ARV.
Projected returns pro-forma
-3.0% appreciation · 3.0% rent growth · sell at horizon
- IRR
- -14.9%
- Equity multiple
- 0.47×
- Total profit
- $-42,585
- Equity at exit
- $42,494
- IRR
- -6.3%
- Equity multiple
- 0.59×
- Total profit
- $-32,460
- Equity at exit
- $24,642
Cash invested: $79,800 (down + closing). Projections, not guarantees.
Landlord ↔ Tenant lean methodology
- Overall (STATE)
- 15 Strongly Tenant-Friendly
- State New York
- 15 Strongly Tenant-Friendly · D+10
- County
- — inherits STATE
- City
- — inherits STATE
ZIP-level market 12110
- Home prices YoY
- -34.1%
- Active inventory
- 103
- Price-to-rent
- 9.6×
Monthly cashflow live
- Estimated rent
- $2,480 high interval (Pro) →
- Mortgage (P&I)
- −$1,495
- Tax from tax record
- −$290 /mo · $3,474/yr
- Insurance
- −$119
- HOA
- −$0
- Vacancy / Maint / Mgmt
- −$521
- Net cashflow
- $57
Break-even live
UW: 25.0% down · 7.5% · 30yr · 1.5% tax · 5.0% vac · 8.0% maint · 8.0% mgmt
Financing live
Cash to close
- Down payment
- $71,250
- Closing costs
- $8,550
- Reserves months
- —
- Total cash needed
- —
Loan-product check · same deal, 3 products live
Conventional
25% down · 7.5% · 30yr
- Down + closing
- —
- Monthly P&I
- —
- Monthly cashflow
- —
- DSCR
- —
- Eligible?
- —
Personal DTI + credit; lowest rate.
DSCR
20% down · 8.5% · 30yr
- Down + closing
- —
- Monthly P&I
- —
- Monthly cashflow
- —
- DSCR
- —
- Eligible?
- —
No personal income docs; deal must DSCR.
Hard money
10% down · 12.0% · 12mo
- Down + closing
- —
- Monthly P&I
- —
- Monthly cashflow
- —
- DSCR
- —
- Eligible?
- —
Short-term bridge; refi at stabilization.
Rent comps 6 comps
| Address | Beds | Baths | Sqft | Rent | $/sqft | DOM | Units | Dist |
|---|---|---|---|---|---|---|---|---|
| 1 Broom Shop Ln Latham, NY | 1.0–2.0 | 1.0–2.0 | 1124 | $2,347 | $2.09 | 19d | 9 | 0.24mi |
| 1 A Saybrook Dr Unit A Latham, NY | 3.0 | 1.5 | 1050 | $2,150 | $2.05 | 14d | 1 | 0.42mi |
| 173 Doorstone Dr Latham, NY | 1.0–3.0 | 1.0–2.0 | 978 | $2,946 | $3.01 | 14d | 8 | 0.85mi |
| 4000 Florence Dr Newtonville, NY | 2.0 | 1.0–2.0 | 1010 | $2,576 | $2.55 | 14d | 8 | 0.90mi |
| 8 Denise Dr Latham, NY | 1.0–2.0 | 1.0 | 827 | $1,690 | $2.04 | 14d | 1 | 0.96mi |
| 9 Spring Ave Latham, NY | 2.0 | 1.0 | 923 | $2,350 | $2.55 | 43d | 1 | 1.48mi |
Listing history 2 events
-
2026-06-18remarks 699-char remark
-
2026-06-18$285,000 Active 1 DOM
ⓘ Source: listings_history table (triggers on properties + properties_extension) + one-shot
backfill from property_details.listing_events for pre-trigger history.
Tax reassessment forecast NY · Partial reset (capped growth)
- Current annual tax
- $3,474 · $290/mo
- Projected year-2 tax
- $4,145 · $345/mo
- Expected delta
- +$671/yr (+$56/mo · 19.3%)
ⓘ Screening estimate from a state-policy table — verify with the county assessor before closing.
Climate risk First Street
- Flood 4/10 Moderate FEMA zone X (unshaded) · 22% chance over 30 yrs
- Wildfire 1/10 Low
- Heat 4/10 Moderate 7 d/yr ≥97°F today · 16 d/yr by 30 yrs out
- Wind 3/10 Moderate 6% chance of damaging wind over 30 yrs
- Air quality 1/10 Low 0 unhealthy d/yr today · 0 by 30 yrs out
Nearby sold comps map
Loading sold comps map…
Walkable amenities ~0.75 mi
Loading nearby amenities…
Taxation est. · year 1
- Rental income
- $29,763
- − Mortgage interest
- −$15,964
- − Property taxes
- −$3,474
- − Insurance
- −$1,425
- − Repairs & maintenance
- −$2,381
- − Management
- −$2,381
- − Depreciation
- −$8,291
- Taxable loss
- −$4,154
- Est. tax savings @ 24.0%
- +$997
- After-tax cash flow
- $1,675/yr
For passive investors: Depreciation is non-cash, so a rental often shows a tax loss while cash-flowing — sheltering income. Rental losses are passive: they offset passive income freely, and up to $25,000/yr can offset ordinary (W-2) income if you actively participate and your MAGI is under $100k (phasing out to $0 by $150k); unused losses carry forward. On sale, claimed depreciation is recaptured at up to 25%, and gains may owe capital-gains tax (a 1031 exchange can defer both). Figures are a year-1 estimate at your 24.0% rate — not tax advice; consult a CPA.
Schools (NCES district)
- District
- North Colonie CSD
- NCES district ID
- 3621000
- Math proficiency
- 70% ▼ -5.00%
- Reading proficiency
- 76% ▲ 8.00%
- Median HH income
- $74,762
- Composite
- 64.2/100
- National rank
- #565
- State rank
- #102 of 590 in NY
Livability — Latham
No livability data for this city. (Only ~50 U.S. cities are tracked.)
Census & demographics
- County
- Albany County · 196,626 people
- City population
- 20,081
- Metro
- Albany-Schenectady-Troy, NY
- Population (ZIP)
- 20,081
- Household income
- $105,024
- Rent vs Own
- Severe rent burden
- 517.0
Population outlook (Albany County) Hauer SSP2
- Today (2025)
- 320,794 people
- By 2030
- 327,401 · +2.1%
- By 2040
- 338,218 · +5.4%
- By 2050
- 348,467 · +8.6%
- By 2075
- 381,693 · +19.0%
- By 2100
- 393,809 · +22.8%
Race, ethnicity, and origin ACS 2023
- Neighborhood character
- Predominantly White (75%)
- Race & ethnicity
- White 75% Asian 11% Two or more races 6% Black 5% Hispanic / Latino 3%
- Common ancestry
- Romanian 5% Lithuanian 4% Iranian 2%
- Foreign-born
- 12% · Canada, China, Vietnam
- Languages at home
- 84% English-only · Other Indo-European 5% Chinese 2% Other Asian/Pacific 2%
Political lean MEDSL · Albany
- 2024 margin
- Strong D (+25.8) · D 62.9% · R 37.1%
- 2008→2024 swing
- -3.6pp toward R · 2008: 29.4pp · 2024: 25.8pp
- All cycles
- 2024: D+25.8 2020: D+31.4 2016: D+24.3 2012: D+31.0 2008: D+29.4
Not yet ingested
- Civics
- —
Market trends
- HPI YoY
- ▼ -160.69%
- Current HPI
- 310.884
- Rent YoY
- —
- Metro
- Albany-Schenectady-Troy, NY
- State GDP YoY
- ▲ 2.60%
- F500 in state
- 92
Industry mix (Fortune 500 HQ in NY)
| Industry | F500 HQs | Revenue |
|---|---|---|
| Financial Services | 10 | $950B |
|
||
| Consumer Goods | 9 | $162B |
|
||
| Insurance | 4 | $225B |
|
||
| Telecommunications | 2 | $144B |
|
||
| Pharmaceuticals | 2 | $112B |
|
||
| Media / Entertainment | 2 | $69B |
|
||
Price history
+159.3% since first listed20 events — show timeline
- 2026-06-18 Listed $285,000 Global MLS
- 2017-05-31 Sold (MLS) $117,000 Global MLS
- 2017-04-01 Pending — Global MLS
- 2017-03-03 Price Changed $129,900 Global MLS
- 2017-01-26 Price Changed $134,900 Global MLS
- 2016-12-22 Price Changed $141,500 Global MLS
- 2016-11-15 Price Changed $149,900 Global MLS
- 2016-10-05 Price Changed $154,900 Global MLS
- 2016-09-01 Listed $164,900 Global MLS
- 2008-04-08 Sold (Public Records) $175,000 Public Records
- 2008-02-29 Sold (MLS) $164,500 Global MLS
- 2007-11-08 Listing Removed — Global MLS
- 2007-10-01 Listed $169,900 Global MLS
- 2006-02-01 Sold (MLS) $157,000 Global MLS
- 2005-12-14 Listing Removed — Global MLS
- 2005-11-29 Listed $154,900 Global MLS
- 2005-06-17 Sold (Public Records) $106,000 Public Records
- 2005-04-15 Sold (MLS) $93,500 Global MLS
- 2005-03-07 Listing Removed — Global MLS
- 2004-09-10 Listed $109,900 Global MLS
Property tax history
+1.4%/yrLatest (2025): $3,474 · -4.5% YoY. Source: county tax records.
Cash-flow waterfall
monthlySold comps — $/sqft
last 12 mo · ≤1 miLoading sold comps…