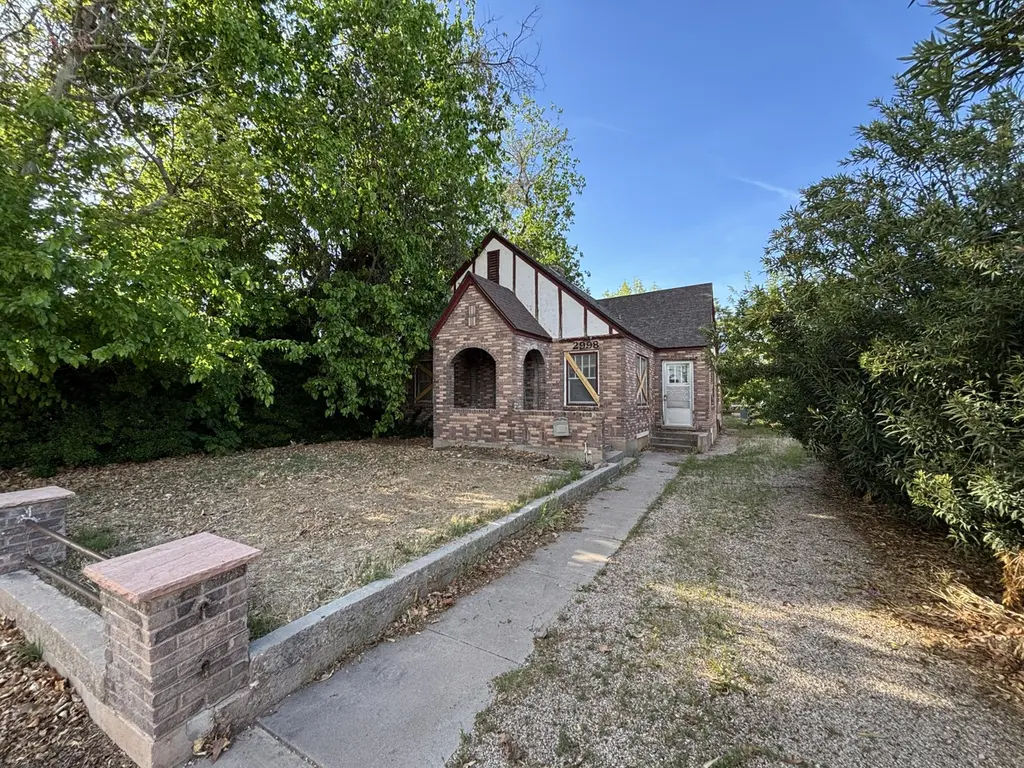
2998 Santa Clara Dr · Santa Clara, UT
Flood risk 1/10 · Minimal
- FEMA flood zone
- X (unshaded)
- Chance of flooding over 30 yrs
- 0.0%
- Est. flood insurance / yr
- $473 – $860
Fire risk 7/10 · Major
- Est. fire insurance / yr
- $453 – $841
Heat risk 7/10 · Major
- Hot days now (above 103°F)
- 7 days/yr
- Hot days in 30 yrs
- 17 days/yr
Wind risk 1/10 · Minimal
- Chance of severe wind over 30 yrs
- —
Air-quality risk 2/10 · Minimal
- Unhealthy air days now
- 1 days/yr
- Unhealthy air days in 30 yrs
- 1 days/yr
Risk factors via First Street. Map © Google.
Why this score? — see what drove the D+ grade
The composite is a weighted blend of 9 inputs, each scored 0–100. Each bar is that input's sub-score; the figure is the points it added to the 100-point composite (weight × sub-score).
- Cash flow +19.0/30.0
- ARV discount +7.5/15.0
- DSCR +6.0/10.0
- 1% rule +4.4/10.0
- Schools +3.7/10.0
- Livability +3.3/5.0
- Rent growth +2.5/5.0
- Condition / age +2.5/5.0
- Appreciation +0.0/10.0
$280,000
🖨 Deal sheet (PDF) 📄 Offer letter ✓ Due diligence
Listing remarks
Great property for a renovation loan! Make repairs after closing—no need to meet minimum property standards upfront. Finance renovations based on the future appraised value. Seller financing available! Historic Santa Clara home. 4 bed, 2bath, needs work. Home is sold as is. Must have an appointment! NO SELLER DISCLOSURES PROVIDED. ALL INFORMATION DEEMED RELIABLE, BUYER & BUYERS AGENT TO VERIFY ALL INFORMATION. SELLER FINANCING AVAILABLE.
Key facts
- 4,356 sq ft lot
- Built 1935
- Listed 8 days
Property features AI
Exterior
- Parking: No designated parking
- Utilities: Electricity connected
- Home design: Single-family residence; 1 story
- Construction: Wood siding and brick exterior; Asphalt roof; Built with standard foundation
- Exterior features: Paved road access
Interior
- Heating & cooling: Has heating (see remarks); No central cooling
- Interior features: 6 total rooms; Basement
Neighborhood map
What this means for you Summary
Snapshot
- This is a 4-bed/2.0-bath single-family listed at $280k.
Deal economics
- At list price, monthly cash flow is $294 ($4k/yr) — positive.
- The deal already cash-flows at list — no discount required.
- To meet the 1% rule (rent ≥ 1% of price), the offer needs to be $262k (6.3% below list).
- Recommended offer: $262k (6.3% below list) — sets the bar for 1% rule.
Location & tenants
- Location reads 66/100 on livability (#137 in UT) — a middle-class / working-renter tenant base. Strengths: crime A+, employment A+, housing A+; Watch: amenities F, commute F, cost of living D-.
- Washington District (urban): math 42% / reading 45% proficiency, ranked #37 of 80 in UT (top 46%) — families likely to look elsewhere, expect single-tenant / working-renter base with shorter leases.
- Zoned schools: Santa Clara School (math 39% / reading 34%, grade F, #371 of 585 statewide, top 64%, 483 students, 29% FRL); Lava Ridge Intermediate (math 43% / reading 40%, grade F, #61 of 138 statewide, top 47%, 815 students, 42% FRL); Snow Canyon High (math 32% / reading 48%, grade F, #62 of 171 statewide, top 36%, 1,266 students, 30% FRL) — zoned schools at 34% FRL track the district average.
- Market conditions: 138 active listings in the ZIP; 5 comparable units currently listed for rent nearby; rentals at typical pace (median 16d on market — plan ~3-4 weeks tenant-placement turnaround); solid renter incomes; 3,140 units permitted in Washington County in 2024 (650 in 5+ unit buildings).
- This rent runs 33% of the median local income ($96k/yr) — at the standard rent-burdened threshold; future hikes will face affordability resistance.
Forward outlook
- Local home prices are declining (-3.0%/yr); year-one equity from $2k of loan paydown is wiped out by about $8k of value loss. Plan a longer hold.
- Washington County population projected at +44% by 2050 — long-run rental-demand tailwind backs the buy-and-hold thesis.
Negotiation context
- Only 8 days on market — expect competitive offers; lowballing is unlikely to land.
Risks & watch-outs
- Watch-outs: built in 1935 — expect roof / HVAC / electrical / plumbing capex.
- Climate carrying-cost: major wildfire risk; extreme-heat days projected 7→17/yr by 2055 (HVAC capex compounding) — expect insurance premiums to compound above CPI over the hold.
Questions for the listing agent
- Built in 1935 — when were the roof, HVAC, electrical panel, plumbing, and water heater last replaced?
- Is there a deadline driving the sale (1031 exchange, divorce, estate, relocation)? That informs how much negotiation room exists.
- The area grade is low — what's the realistic commute time and amenity access for the typical tenant pool here? Any planned neighborhood developments (good or bad) we should know about?
- What's the average days-on-market for RENTAL listings here right now (not sales)? A rising rental-DOM trend means longer vacancies and softer asking-rent achievability than the comps imply.
- What's the recent tenant-quality profile in this submarket — average credit score on applications, eviction rate, late-payment / NSF rate, and stable-employment percentage? A property-management company in the area should have these aggregated.
- How much new for-sale + rental construction is in the pipeline within 1–3 miles? Heavy new supply typically softens prices + rents 12–24 months out; constrained supply supports both.
Investment metrics
- 1% rule
- 0.94% ✗
- Cap rate
- 7.55%
- Cash-on-cash
- 4.50%
- DSCR
- 1.20
- GRM
- 8.9
CMA / ARV
No comps found within radius.
Projected returns pro-forma
-3.0% appreciation · 3.0% rent growth · sell at horizon
- IRR
- -9.3%
- Equity multiple
- 0.66×
- Total profit
- $-26,712
- Equity at exit
- $41,749
- IRR
- 0.1%
- Equity multiple
- 1.01×
- Total profit
- $611
- Equity at exit
- $24,209
Cash invested: $78,400 (down + closing). Projections, not guarantees.
Landlord ↔ Tenant lean methodology
- Overall (STATE)
- 86 Strongly Landlord-Friendly
- State Utah
- 86 Strongly Landlord-Friendly · R+15
- County
- — inherits STATE
- City
- — inherits STATE
ZIP-level market 84765
- Active inventory
- 138
- Price-to-rent
- 8.9×
Monthly cashflow live
- Estimated rent
- $2,624 medium interval (Pro) →
- Mortgage (P&I)
- −$1,468
- Tax from tax record
- −$194 /mo · $2,329/yr
- Insurance
- −$117
- HOA
- −$0
- Vacancy / Maint / Mgmt
- −$551
- Net cashflow
- $294
Break-even live
Sensitivity live
| Price | -10% $452 | -5% $373 | +0% $294 | +5% $215 | +10% $135 |
|---|---|---|---|---|---|
| Rent | -10% $87 | -5% $190 | +0% $294 | +5% $398 | +10% $501 |
| Rate | -1.0pp $435 | -0.5pp $365 | base $294 | +0.5pp $221 | +1.0pp $147 |
UW: 25.0% down · 7.5% · 30yr · 1.5% tax · 5.0% vac · 8.0% maint · 8.0% mgmt
Financing live
Cash to close
- Down payment
- $70,000
- Closing costs
- $8,400
- Reserves months
- —
- Total cash needed
- —
Loan-product check · same deal, 3 products live
Conventional
25% down · 7.5% · 30yr
- Down + closing
- —
- Monthly P&I
- —
- Monthly cashflow
- —
- DSCR
- —
- Eligible?
- —
Personal DTI + credit; lowest rate.
DSCR
20% down · 8.5% · 30yr
- Down + closing
- —
- Monthly P&I
- —
- Monthly cashflow
- —
- DSCR
- —
- Eligible?
- —
No personal income docs; deal must DSCR.
Hard money
10% down · 12.0% · 12mo
- Down + closing
- —
- Monthly P&I
- —
- Monthly cashflow
- —
- DSCR
- —
- Eligible?
- —
Short-term bridge; refi at stabilization.
Rent comps 5 comps
| Address | Beds | Baths | Sqft | Rent | $/sqft | DOM | Units | Dist |
|---|---|---|---|---|---|---|---|---|
| 3264 Canyon View Dr Santa Clara, UT | 4.0 | 2.0 | 2433 | $650 | $0.27 | 23d | 1 | 0.62mi |
| 960 Heritage Dr #52 Santa Clara, UT | 3.0 | 2.5 | 1858 | $2,200 | $1.18 | 15d | 1 | 1.09mi |
| 2540 Lava Ln Santa Clara, UT | 2.0–3.0 | 2.5 | 1523 | $2,550 | $1.67 | 15d | 20 | 1.32mi |
| 991 N 2100 W Saint George, UT | 4.0 | 2.0 | 2755 | $2,800 | $1.02 | 15d | 1 | 1.47mi |
| 2520 Blackhawk Dr #30 Santa Clara, UT | 3.0 | 2.5 | 1726 | $1,800 | $1.04 | 15d | 1 | 1.48mi |
Listing history 6 events
-
2026-05-12status Pending
-
2026-05-04$280,000 Active
-
2025-08-11soldstatus
-
2025-06-14price $290,000
-
2025-05-21price $319,000
-
2024-05-30soldstatus
ⓘ Source: listings_history table (triggers on properties + properties_extension) + one-shot
backfill from property_details.listing_events for pre-trigger history.
Tax reassessment forecast UT · Resets to sale price
- Current annual tax
- $2,329 · $194/mo
- Projected year-2 tax
- $2,329 · $194/mo
- Expected delta
- $0/yr ($0/mo · 0.0%)
ⓘ Screening estimate from a state-policy table — verify with the county assessor before closing.
Climate risk First Street
- Flood 1/10 Low FEMA zone X (unshaded) · 0% chance over 30 yrs
- Wildfire 7/10 Severe
- Heat 7/10 Severe 7 d/yr ≥103°F today · 17 d/yr by 30 yrs out
- Wind 1/10 Low
- Air quality 2/10 Low 1 unhealthy d/yr today · 1 by 30 yrs out
Nearby sold comps map
Loading sold comps map…
Walkable amenities ~0.75 mi
Loading nearby amenities…
Taxation est. · year 1
- Rental income
- $31,488
- − Mortgage interest
- −$15,684
- − Property taxes
- −$2,329
- − Insurance
- −$1,400
- − Repairs & maintenance
- −$2,519
- − Management
- −$2,519
- − Depreciation
- −$8,145
- Taxable loss
- −$1,109
- Est. tax savings @ 24.0%
- +$266
- After-tax cash flow
- $3,792/yr
For passive investors: Depreciation is non-cash, so a rental often shows a tax loss while cash-flowing — sheltering income. Rental losses are passive: they offset passive income freely, and up to $25,000/yr can offset ordinary (W-2) income if you actively participate and your MAGI is under $100k (phasing out to $0 by $150k); unused losses carry forward. On sale, claimed depreciation is recaptured at up to 25%, and gains may owe capital-gains tax (a 1031 exchange can defer both). Figures are a year-1 estimate at your 24.0% rate — not tax advice; consult a CPA.
Schools (NCES district)
- District
- Washington District
- NCES district ID
- 4901140
- Math proficiency
- 42% ▼ -3.00%
- Reading proficiency
- 45% ▼ -3.00%
- Median HH income
- $50,861
- Composite
- 37.47/100
- National rank
- #4408
- State rank
- #37 of 80 in UT
Livability — Santa Clara
- Score
- 66/100
- State rank
- #137
- US rank
- #11349
Category grades
Schools grade is shown separately in the Schools card above.
Census & demographics
- Census place
- Santa Clara, UT
- County
- Washington County · 179,216 people
- City population
- 8,152
- Metro
- St. George, UT
- Population (ZIP)
- 8,152
- Household income
- $96,475
- Rent vs Own
- Severe rent burden
- 236.0
Population outlook (Washington County) Hauer SSP2
- Today (2025)
- 193,324 people
- By 2030
- 211,699 · +9.5%
- By 2040
- 246,449 · +27.5%
- By 2050
- 278,447 · +44.0%
- By 2075
- 342,734 · +77.3%
- By 2100
- 382,815 · +98.0%
Race, ethnicity, and origin ACS 2023
- Neighborhood character
- Predominantly White (83%)
- Race & ethnicity
- White 83% Hispanic / Latino 10% Two or more races 5% Asian 3%
- Hispanic origin (detail)
- Mexican 6% Puerto Rican 3%
- Common ancestry
- Italian 3% Portuguese 2% Slovak 2%
- Foreign-born
- 5% · Canada, China
- Languages at home
- 91% English-only · Spanish 7%
Political lean MEDSL · Washington
- 2024 margin
- Solid R (+52.3) · D 23.0% · R 75.2% · Other 1.8%
- 2008→2024 swing
- +1.2pp toward D · 2008: -53.5pp · 2024: -52.3pp
- All cycles
- 2024: R+52.3 2020: R+51.7 2016: R+52.1 2012: R+67.0 2008: R+53.5
Not yet ingested
- Civics
- —
Market trends
- HPI YoY
- ▼ -150.34%
- Current HPI
- 243.6115
- Rent YoY
- —
- Metro
- St. George, UT
- State GDP YoY
- ▲ 3.54%
- F500 in state
- 2
Industry mix (Fortune 500 HQ in UT)
| Industry | F500 HQs | Revenue |
|---|---|---|
| Financial Services | 1 | $3B |
|
||
Price history
-12.2% since first listed6 events — show timeline
- 2026-05-12 Pending — WCBOR
- 2026-05-04 Listed $280,000 WCBOR
- 2025-08-11 Sold (Public Records) — Public Records
- 2025-06-14 Price Changed $290,000 WCBOR
- 2025-05-21 Price Changed $319,000 WCBOR
- 2024-05-30 Sold (Public Records) — Public Records
Property tax history
+10.7%/yrLatest (2025): $2,329 · +73.1% YoY. Source: county tax records.
Cash-flow waterfall
monthlySold comps — $/sqft
last 12 mo · ≤1 miLoading sold comps…