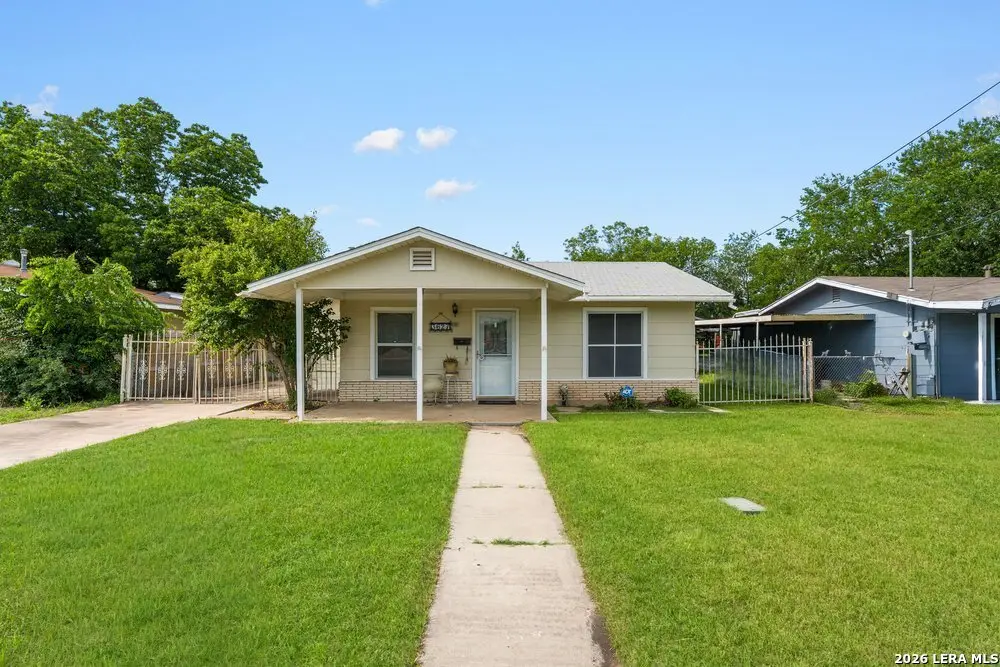
3627 W Poplar St · San Antonio, TX
Flood risk 1/10 · Minimal
- FEMA flood zone
- X (unshaded)
- Chance of flooding over 30 yrs
- 0.0%
- Est. flood insurance / yr
- $507 – $1,088
Fire risk 1/10 · Minimal
- Est. fire insurance / yr
- $1,222 – $2,270
Heat risk 8/10 · Major
- Hot days now (above 108°F)
- 7 days/yr
- Hot days in 30 yrs
- 22 days/yr
Wind risk 6/10 · Moderate
- Chance of severe wind over 30 yrs
- 77.0%
Air-quality risk 2/10 · Minimal
- Unhealthy air days now
- 1 days/yr
- Unhealthy air days in 30 yrs
- 2 days/yr
Risk factors via First Street. Map © Google.
Why this score? — see what drove the C+ grade
The composite is a weighted blend of 9 inputs, each scored 0–100. Each bar is that input's sub-score; the figure is the points it added to the 100-point composite (weight × sub-score).
- Cash flow +22.5/30.0
- ARV discount +15.0/15.0
- DSCR +7.2/10.0
- 1% rule +6.7/10.0
- Livability +4.0/5.0
- Rent growth +3.7/5.0
- Condition / age +2.5/5.0
- Schools +1.3/10.0
- Appreciation +0.0/10.0
$115,000
🖨 Deal sheet (PDF) 📄 Offer letter ✓ Due diligence
Listing remarks
Opportunity is knocking! This charming 1-story home offers 3 bedrooms, 2 full bathrooms, and a 2-car garage with so much potential for its next owner. One of the standout features is the detached 2-car garage, making it one of the few homes in the neighborhood with this unique setup. Situated on a spacious lot, this home is priced right and ready for someone to add their personal touches and make it shine. Whether you're a first-time homebuyer, an investor, or looking for a property with room to grow, this home is full of possibilities. With a great yard, detached 2-car garage, 3 bedrooms, 2 bathrooms, investment potential, and starter home opportunity, this property offers plenty of value.
Key facts
- Spacious lot
- Investment potential
- 6,926 sq ft lot
Tags
Property features AI
Finance
- Other: Possession at closing/funding; For sale
- HOA & community: Located in the PROSPECT HILL community
Exterior
- Parking: 2-car garage
- Utilities: Water system
- Home design: Pre-owned property; Approximate age: 72 years
- Construction: Slab foundation; Composition roof
- Exterior features: Asbestos shingle exterior; Lot in PROSPECT HILL subdivision
Interior
- Kitchen: Kitchen (9 x 10)
- Bedrooms: Master bedroom on lower level (10 x 16); Bedroom 2 (9 x 12); Bedroom 3 (13 x 12)
- Flooring: Ceramic tile flooring
- Bathrooms: Two full bathrooms; Master bathroom with shower only (6 x 8)
- Heating & cooling: Central heating (natural gas); Central air conditioning
- Interior features: Living area; Laundry room; Washer connection; Dryer connection
- Laundry & utility: Washer connection; Dryer connection
Neighborhood map
What this means for you Summary
Snapshot
- This is a 2-bed/1.0-bath single-family listed at $115k.
Deal economics
- At list price, monthly cash flow is $194 ($2k/yr) — positive.
- The deal already cash-flows at list — no discount required.
- Meets the 1% rule at list price ($1k rent vs $115k).
- Cap rate 8.3% vs local median 3.8% in San Antonio — top-decile yield for the area; either an underpriced asset or a hidden risk that comps aren't pricing in. Stress-test before assuming the spread holds.
Location & tenants
- Location reads 80/100 on livability (#31 in TX, #1,616 nationally) — a professional / high-income tenant draw. Strengths: amenities A+, commute A+, cost of living A+; Watch: crime F.
- Edgewood ISD (urban): math 12% / reading 21% proficiency, ranked #812 of 826 in TX (top 98%) — low school quality limits family demand, transient renter base, plan for 1-2y turnover.
- Zoned schools: Roosevelt El (math 8% / reading 17%, grade F, #4,180 of 4,322 statewide, top 97%, 305 students, 95% FRL); Memorial H S (math 22% / reading 29%, grade F, #1,246 of 1,632 statewide, top 77%, 872 students, 92% FRL) — zoned schools average 93% FRL vs 24% district-wide (69 pts higher); higher-poverty schools than district average — tighter screening recommended.
- Market conditions: Rents rising fast (+4.9%/yr); 93 active listings in the ZIP; 37 comparable units currently listed for rent nearby; rentals at typical pace (median 25d on market — plan ~3-4 weeks tenant-placement turnaround); 8,308 units permitted in Bexar County in 2024 (2,506 in 5+ unit buildings).
- This rent runs 31% of the median local income ($53k/yr) — at the standard rent-burdened threshold; future hikes will face affordability resistance.
Forward outlook
- Local home prices are declining (-3.0%/yr); year-one equity from $795 of loan paydown is wiped out by about $3k of value loss. Plan a longer hold.
- Bexar County population projected at +50% by 2050 — long-run rental-demand tailwind backs the buy-and-hold thesis.
- At projected returns (-3.0% appreciation + 4.9% rent growth), your $32k cash investment doubles in ~10 years — after that, you're playing with house money.
Negotiation context
- Only 11 days on market — expect competitive offers; lowballing is unlikely to land.
- 4 sale attempts with the ask held roughly flat each time — persistent listings suggest the price (not the market) is what's stuck; bring a comps-based counter.
Risks & watch-outs
- Watch-outs: built in 1954 — expect roof / HVAC / electrical / plumbing capex.
- Climate carrying-cost: major wind risk, 77% chance of damaging wind over 30y; extreme-heat days projected 7→22/yr by 2055 (HVAC capex compounding) — expect insurance premiums to compound above CPI over the hold.
Questions for the listing agent
- Built in 1954 — when were the roof, HVAC, electrical panel, plumbing, and water heater last replaced?
- Is there a deadline driving the sale (1031 exchange, divorce, estate, relocation)? That informs how much negotiation room exists.
- Crime grade is F in this area — have there been break-ins, vandalism, or insurance claims at this property in the last 3 years? What carrier currently insures it and at what premium?
- What's the average days-on-market for RENTAL listings here right now (not sales)? A rising rental-DOM trend means longer vacancies and softer asking-rent achievability than the comps imply.
- What's the recent tenant-quality profile in this submarket — average credit score on applications, eviction rate, late-payment / NSF rate, and stable-employment percentage? A property-management company in the area should have these aggregated.
- How much new for-sale + rental construction is in the pipeline within 1–3 miles? Heavy new supply typically softens prices + rents 12–24 months out; constrained supply supports both.
Investment metrics
- 1% rule
- 1.17% ✓
- Cap rate
- 8.31%
- Cash-on-cash
- 7.22%
- DSCR
- 1.32
- GRM
- 7.1
CMA / ARV
- ARV (on-the-fly)
- $160,176
- Comps found
- 12
Show comp detail 12 sales within ~0.75 mi
| Address | Dist | Beds/Ba | Sqft | Sold | Price | $/sf | Match |
|---|---|---|---|---|---|---|---|
| 2111 Rivas | 0.39mi | 3/2.0 (+1) | 1,080 (-4%) | 1mo | $99,900 | $93 | 65 |
| 2335 Waverly Ave | 0.45mi | 3/1.0 (+1) | 1,092 (-3%) | 8mo | $180,000 | $165 | 62 |
| 345 Westminster | 0.65mi | 2/1.0 | 1,164 (+3%) | 9mo | $204,000 | $175 | 57 |
| 1938 Texas | 0.58mi | 2/1.0 | 1,058 (-6%) | 9mo | $105,000 | $99 | 55 |
| 107 Blueridge | 0.59mi | 3/2.0 (+1) | 1,143 (+1%) | 9mo | $200,000 | $175 | 54 |
| 215 Bradford | 0.66mi | 3/1.0 (+1) | 1,094 (-3%) | 10mo | $150,000 | $137 | 51 |
| 2212 Waverly Ave | 0.35mi | 3/2.0 (+1) | 1,079 (-4%) | 21mo | $180,000 | $167 | 50 |
| 143 Bradford | 0.58mi | 3/1.0 (+1) | 1,250 (+11%) | 6mo | $174,999 | $140 | 45 |
| 131 Neff | 0.70mi | 3/1.0 (+1) | 1,029 (-9%) | 6mo | $139,700 | $136 | 43 |
| 1806 Delgado St | 0.73mi | 3/1.0 (+1) | 1,224 (+8%) | 9mo | $115,000 | $94 | 40 |
| 2111 Cincinnati | 0.65mi | 3/1.5 (+1) | 1,289 (+14%) | 8mo | $225,000 | $175 | 32 |
| 202 Bradford | 0.62mi | 3/2.0 (+1) | 1,235 (+10%) | 18mo | $175,000 | $142 | 31 |
Match score weights: distance 35% · size 25% · config 20% · recency 20%. Top-matched comps best support the ARV.
Projected returns pro-forma
-3.0% appreciation · 4.92% rent growth · sell at horizon
- IRR
- -2.9%
- Equity multiple
- 0.89×
- Total profit
- $-3,576
- Equity at exit
- $17,147
- IRR
- 9.0%
- Equity multiple
- 1.76×
- Total profit
- $24,392
- Equity at exit
- $9,943
Cash invested: $32,200 (down + closing). Projections, not guarantees.
Landlord ↔ Tenant lean methodology
- Overall (STATE)
- 87 Strongly Landlord-Friendly
- State Texas
- 87 Strongly Landlord-Friendly · R+5
- County
- — inherits STATE
- City
- — inherits STATE
ZIP-level market 78228
- Home prices YoY
- -22.1%
- Rents YoY
- 4.9%
- Active inventory
- 93
- Price-to-rent
- 7.1×
Monthly cashflow live
- Estimated rent
- $1,351 high interval (Pro) →
- Mortgage (P&I)
- −$603
- Tax from tax record
- −$222 /mo · $2,668/yr
- Insurance
- −$48
- HOA
- −$0
- Vacancy / Maint / Mgmt
- −$284
- Net cashflow
- $194
Break-even live
Sensitivity live
| Price | -10% $259 | -5% $226 | +0% $194 | +5% $161 | +10% $129 |
|---|---|---|---|---|---|
| Rent | -10% $87 | -5% $140 | +0% $194 | +5% $247 | +10% $300 |
| Rate | -1.0pp $252 | -0.5pp $223 | base $194 | +0.5pp $164 | +1.0pp $134 |
UW: 25.0% down · 7.5% · 30yr · 1.5% tax · 5.0% vac · 8.0% maint · 8.0% mgmt
Financing live
Cash to close
- Down payment
- $28,750
- Closing costs
- $3,450
- Reserves months
- —
- Total cash needed
- —
Loan-product check · same deal, 3 products live
Conventional
25% down · 7.5% · 30yr
- Down + closing
- —
- Monthly P&I
- —
- Monthly cashflow
- —
- DSCR
- —
- Eligible?
- —
Personal DTI + credit; lowest rate.
DSCR
20% down · 8.5% · 30yr
- Down + closing
- —
- Monthly P&I
- —
- Monthly cashflow
- —
- DSCR
- —
- Eligible?
- —
No personal income docs; deal must DSCR.
Hard money
10% down · 12.0% · 12mo
- Down + closing
- —
- Monthly P&I
- —
- Monthly cashflow
- —
- DSCR
- —
- Eligible?
- —
Short-term bridge; refi at stabilization.
Rent comps 37 comps
| Address | Beds | Baths | Sqft | Rent | $/sqft | DOM | Units | Dist |
|---|---|---|---|---|---|---|---|---|
| 122 Collins Ct San Antonio, TX | 2.0 | 1.0 | 927 | $1,150 | $1.24 | 23d | 1 | 0.44mi |
| 2503 Arbor Pl San Antonio, TX | 2.0 | 1.0 | 750 | $800 | $1.07 | 45d | 1 | 0.45mi |
| 2148 Texas Ave San Antonio, TX | 3.0 | 1.0 | 1131 | $1,375 | $1.22 | 25d | 1 | 0.47mi |
| 2313 Texas Ave San Antonio, TX | 3.0 | 1.0 | 1309 | $1,400 | $1.07 | 45d | 1 | 0.56mi |
| 2331 Cincinnati Ave Unit 2345 04 San Antonio, TX | 1.0 | 1.0 | 750 | $900 | $1.20 | 4d | 1 | 0.64mi |
| 2331 Cincinnati Ave Unit 2345 03 San Antonio, TX | 3.0 | 1.0 | 950 | $1,300 | $1.37 | 4d | 1 | 0.66mi |
| 2331 Cincinnati Ave San Antonio, TX | 1.0–3.0 | 1.0 | 850 | $1,100 | $1.29 | 13d | 3 | 0.66mi |
| 2426 Cincinnati Ave San Antonio, TX | 2.0 | 1.0 | 700 | $975 | $1.39 | 25d | 1 | 0.67mi |
| 707 Tulane Dr San Antonio, TX | 2.0 | 1.5 | 1500 | $1,550 | $1.03 | 45d | 1 | 0.68mi |
| 3156 W French Pl San Antonio, TX | 2.0 | 2.0 | 1100 | $1,150 | $1.05 | 45d | 1 | 0.74mi |
| 1706 Texas Ave San Antonio, TX | 2.0 | 2.0 | 1204 | $1,500 | $1.25 | 45d | 1 | 0.75mi |
| 1706 Texas Ave San Antonio, TX | 2.0 | 2.0 | 1204 | $1,500 | $1.25 | 25d | 1 | 0.75mi |
| 2718 W Craig Pl San Antonio, TX | 2.0 | 1.0 | 1004 | $1,350 | $1.34 | 13d | 1 | 0.87mi |
| 2718 W Craig Pl San Antonio, TX | 2.0 | 1.0 | 1004 | $1,350 | $1.34 | 12d | 1 | 0.87mi |
| 2553 Cincinnati Ave San Antonio, TX | 1.0 | 1.0 | 800 | $780 | $0.97 | 25d | 1 | 0.88mi |
| 2825 W Woodlawn Ave Unit 2825-WW San Antonio, TX | 2.0 | 1.0 | 700 | $1,195 | $1.71 | 4d | 1 | 0.93mi |
| 224 Marquette Dr San Antonio, TX | 2.0 | 1.0 | 984 | $1,350 | $1.37 | 25d | 1 | 0.93mi |
| 2530 W Woodlawn Ave San Antonio, TX | 3.0 | 2.0 | 1416 | $2,195 | $1.55 | 45d | 1 | 0.94mi |
| 2607 W Craig Pl San Antonio, TX | 3.0 | 1.0 | 1312 | $1,475 | $1.12 | 25d | 1 | 0.97mi |
| 3918 W Martin St San Antonio, TX | 3.0 | 1.0 | 1200 | $1,300 | $1.08 | 25d | 1 | 0.98mi |
| 2443 W Huisache Ave Unit 1 San Antonio, TX | 2.0 | 1.0 | 1200 | $1,100 | $0.92 | 45d | 1 | 1.11mi |
| 306 Overhill Dr San Antonio, TX | 2.0 | 1.0 | 1009 | $1,200 | $1.19 | 5d | 1 | 1.14mi |
| 1231 Rivas St Unit 102 San Antonio, TX | 3.0 | 2.0 | 1120 | $1,299 | $1.16 | 45d | 1 | 1.19mi |
| 1230 Rivas St San Antonio, TX | 3.0 | 2.5 | 1287 | $1,999 | $1.55 | 25d | 1 | 1.20mi |
| 3301 W Woodlawn Ave San Antonio, TX | 1.0–2.0 | 1.0 | 825 | $881 | $1.07 | 25d | 3 | 1.20mi |
| 206 Roberts St Unit 201 San Antonio, TX | 3.0 | 2.0 | 1100 | $1,350 | $1.23 | 25d | 1 | 1.27mi |
| 2050 W Mistletoe Ave San Antonio, TX | 3.0 | 2.0 | 1442 | $4,500 | $3.12 | 25d | 1 | 1.33mi |
| 1545 Ruiz St San Antonio, TX | 2.0 | 2.0 | 1020 | $935 | $0.92 | 45d | 1 | 1.34mi |
| 2020 W Woodlawn Ave San Antonio, TX | 2.0 | 1.5 | 1200 | $1,298 | $1.08 | 45d | 1 | 1.34mi |
| 250 Senisa Dr Unit 1 San Antonio, TX | 2.0 | 1.0 | 1160 | $999 | $0.86 | 45d | 1 | 1.37mi |
| 2007 W Mistletoe Ave San Antonio, TX | 2.0 | 1.0 | 1224 | $1,650 | $1.35 | 45d | 1 | 1.41mi |
| 234 Gould St Unit 102 San Antonio, TX | 2.0 | 1.5 | 948 | $1,195 | $1.26 | 5d | 1 | 1.43mi |
| 1407 Leal St Unit 3 San Antonio, TX | 1.0 | 1.0 | 1312 | $800 | $0.61 | 45d | 1 | 1.45mi |
| 1171 Bandera Rd San Antonio, TX | 1.0–2.0 | 1.0 | 750 | $1,375 | $1.83 | 25d | 5 | 1.48mi |
| 1214 Donaldson Ave San Antonio, TX | 2.0 | 1.0 | 1286 | $1,800 | $1.40 | 25d | 1 | 1.49mi |
| 230 Micklejohn St San Antonio, TX | 3.0 | 2.0 | 1368 | $1,595 | $1.17 | 25d | 1 | 1.50mi |
| 230 Micklejohn St San Antonio, TX | 3.0 | 2.0 | 1368 | $1,695 | $1.24 | 45d | 1 | 1.50mi |
Listing history 8 events
-
2026-06-12statusdays on market $115,000 Pending 11 DOM
-
2026-06-09days on market $115,000 New 8 DOM
-
2026-06-08days on market $115,000 New 7 DOM
-
2026-06-08days on market $115,000 New 6 DOM
-
2026-06-07days on market $115,000 New 5 DOM
-
2026-06-03days on market $115,000 New 2 DOM
-
2026-06-02remarks 699-char remark
-
2026-06-02$115,000 New 1 DOM
ⓘ Source: listings_history table (triggers on properties + properties_extension) + one-shot
backfill from property_details.listing_events for pre-trigger history.
Tax reassessment forecast TX · Resets to sale price
- Current annual tax
- $2,668 · $222/mo
- Projected year-2 tax
- $2,668 · $222/mo
- Expected delta
- $0/yr ($0/mo · 0.0%)
ⓘ Screening estimate from a state-policy table — verify with the county assessor before closing.
Climate risk First Street
- Flood 1/10 Low FEMA zone X (unshaded) · 0% chance over 30 yrs
- Wildfire 1/10 Low
- Heat 8/10 Severe 7 d/yr ≥108°F today · 22 d/yr by 30 yrs out
- Wind 6/10 Major 77% chance of damaging wind over 30 yrs
- Air quality 2/10 Low 1 unhealthy d/yr today · 2 by 30 yrs out
Nearby sold comps map
Loading sold comps map…
Walkable amenities ~0.75 mi
Loading nearby amenities…
Taxation est. · year 1
- Rental income
- $16,206
- − Mortgage interest
- −$6,442
- − Property taxes
- −$2,668
- − Insurance
- −$575
- − Repairs & maintenance
- −$1,297
- − Management
- −$1,297
- − Depreciation
- −$3,345
- Taxable income
- $583
- Est. tax owed @ 24.0%
- −$140
- After-tax cash flow
- $2,183/yr
For passive investors: Depreciation is non-cash, so a rental often shows a tax loss while cash-flowing — sheltering income. Rental losses are passive: they offset passive income freely, and up to $25,000/yr can offset ordinary (W-2) income if you actively participate and your MAGI is under $100k (phasing out to $0 by $150k); unused losses carry forward. On sale, claimed depreciation is recaptured at up to 25%, and gains may owe capital-gains tax (a 1031 exchange can defer both). Figures are a year-1 estimate at your 24.0% rate — not tax advice; consult a CPA.
Schools (NCES district)
- District
- Edgewood ISD
- NCES district ID
- 4818150
- Math proficiency
- 12% ▼ -18.00%
- Reading proficiency
- 21% ▼ -5.00%
- Median HH income
- $27,419
- Composite
- 12.82/100
- National rank
- #9597
- State rank
- #812 of 826 in TX
Livability — San Antonio
- Score
- 80/100
- State rank
- #31
- US rank
- #1616
Category grades
Schools grade is shown separately in the Schools card above.
Census & demographics
- Census place
- San Antonio, TX
- County
- Bexar County · 1,990,555 people
- City population
- 1,806,925
- Metro
- San Antonio-New Braunfels, TX
- Population (ZIP)
- 56,165
- Household income
- $52,976
- Rent vs Own
- Severe rent burden
- 2709.0
Population outlook (Bexar County) Hauer SSP2
- Today (2025)
- 2,336,851 people
- By 2030
- 2,560,728 · +9.6%
- By 2040
- 3,020,569 · +29.3%
- By 2050
- 3,493,522 · +49.5%
- By 2075
- 4,668,459 · +99.8%
- By 2100
- 5,533,242 · +136.8%
Race, ethnicity, and origin ACS 2023
- Neighborhood character
- Predominantly Hispanic (88%)
- Race & ethnicity
- Hispanic / Latino 88% Two or more races 43% White 8% Black 2%
- Hispanic origin (detail)
- Mexican 80%
- Common ancestry
- Italian 1% Lithuanian 1%
- Foreign-born
- 15% · Canada
- Languages at home
- 46% English-only · Spanish 53% Other Indo-European 1%
Political lean MEDSL · Bexar
- 2024 margin
- Lean D (+9.8) · D 54.3% · R 44.6% · Other 1.1%
- 2008→2024 swing
- +4.2pp toward D · 2008: 5.6pp · 2024: 9.8pp
- All cycles
- 2024: D+9.8 2020: D+18.2 2016: D+13.5 2012: D+4.6 2008: D+5.6
Not yet ingested
- Civics
- —
Market trends
- HPI YoY
- ▼ -74.04%
- Current HPI
- 261.1558
- Rent YoY
- ▲ 4.92%
- Metro
- San Antonio-New Braunfels, TX
- State GDP YoY
- ▲ 3.95%
- F500 in state
- 110
Industry mix (Fortune 500 HQ in TX)
| Industry | F500 HQs | Revenue |
|---|---|---|
| Energy | 16 | $1,198B |
|
||
| Technology | 5 | $198B |
|
||
| Engineering / Construction | 4 | $72B |
|
||
| Energy Services | 3 | $60B |
|
||
| Utilities | 3 | $41B |
|
||
| Healthcare | 2 | $330B |
|
||
Price history
-30.3% since first listed11 events — show timeline
- 2026-06-01 Listed $115,000 LERA
- 2026-04-27 Listing Removed — LERA
- 2026-04-01 Price Changed $125,000 LERA
- 2026-03-20 Relisted — LERA
- 2026-03-06 Contingent — LERA
- 2026-01-06 Relisted — LERA
- 2026-01-02 Contingent — LERA
- 2025-12-30 Price Changed $135,000 LERA
- 2025-11-25 Price Changed $145,000 LERA
- 2025-11-11 Price Changed $155,000 LERA
- 2025-10-28 Listed $165,000 LERA
Property tax history
+5.4%/yrLatest (2025): $2,668 · +10.0% YoY. Source: county tax records.
Cash-flow waterfall
monthlySold comps — $/sqft
last 12 mo · ≤1 miLoading sold comps…