4213 Cap Chat St · Augusta-Richmond County consolidated government (balance), GA
Flood risk 1/10 · Minimal
- FEMA flood zone
- X (unshaded)
- Chance of flooding over 30 yrs
- 0.0%
- Est. flood insurance / yr
- $507 – $1,088
Fire risk 4/10 · Minor
- Est. fire insurance / yr
- $963 – $1,789
Heat risk 7/10 · Major
- Hot days now (above 107°F)
- 7 days/yr
- Hot days in 30 yrs
- 18 days/yr
Wind risk 6/10 · Moderate
- Chance of severe wind over 30 yrs
- 69.0%
Air-quality risk 3/10 · Minor
- Unhealthy air days now
- 3 days/yr
- Unhealthy air days in 30 yrs
- 3 days/yr
Risk factors via First Street. Map © Google.
Why this score? — see what drove the C grade
The composite is a weighted blend of 9 inputs, each scored 0–100. Each bar is that input's sub-score; the figure is the points it added to the 100-point composite (weight × sub-score).
- Cash flow +21.0/30.0
- ARV discount +15.0/15.0
- DSCR +6.7/10.0
- 1% rule +4.8/10.0
- Livability +2.5/5.0
- Condition / age +2.5/5.0
- Rent growth +2.3/5.0
- Schools +1.3/10.0
- Appreciation +0.0/10.0
$175,000
🖨 Deal sheet (PDF) 📄 Offer letter ✓ Due diligence
Listing remarks
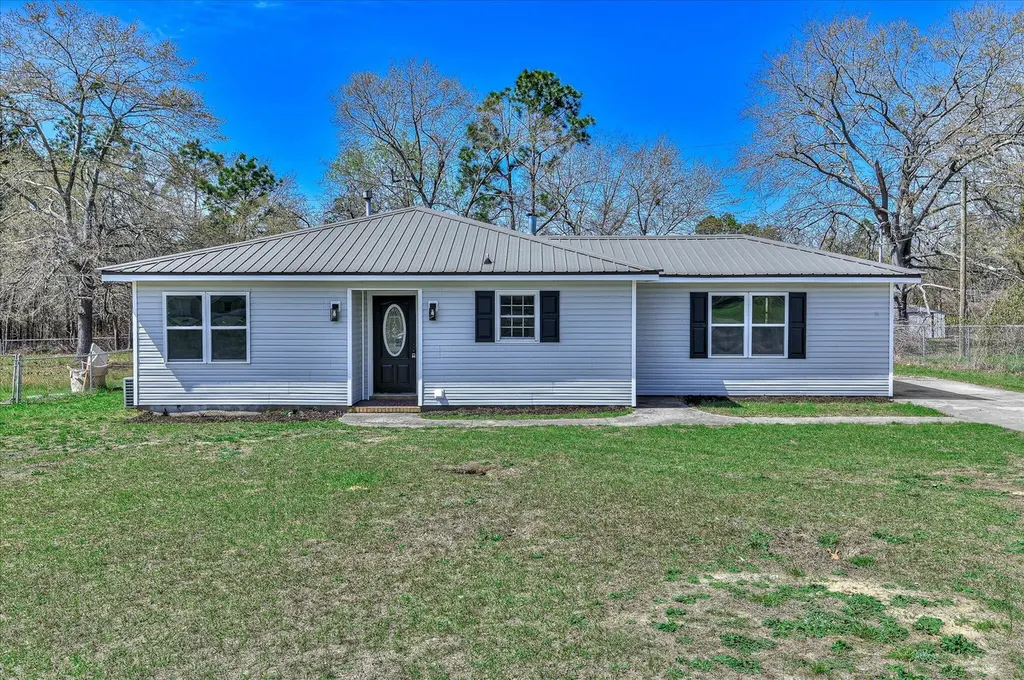
This beautifully updated 3-bedroom, 2-bathroom ranch-style home in Hephzibah, GA, offers a perfect blend of classic Southern charm and modern efficiency. Situated in a peaceful neighborhood with no HOA, this move-in-ready residence has been thoughtfully renovated from the inside out to provide a low-maintenance lifestyle.
Key facts
- Move-in-ready
- Ranch-style home
- No hoa
Tags
Property features AI
Exterior
- Parking: Concrete parking
- Utilities: Public water; Public sewer
- Home design: Single-family residence; One story
- Construction: Vinyl siding; Metal roof; Slab foundation; Built as residential single-family
- Exterior features: Patio or porch — see remarks; Lot dimensions approximately 199 x 85 feet; Lot size about 0.37 acres
Interior
- Kitchen: Range; Dishwasher
- Bedrooms: Total of 5 rooms (includes bedrooms and living spaces)
- Flooring: Carpet; Ceramic tile
- Bathrooms: 2 full bathrooms
- Heating & cooling: Central air; Ceiling fan(s); Natural gas heating; Fireplace(s)
- Interior features: Range; Dishwasher; Carpet flooring; Ceramic tile flooring; No basement
- Laundry & utility: Washer hookup
Neighborhood map
What this means for you Summary
Snapshot
- This is a 3-bed/2.0-bath single-family listed at $175k.
Deal economics
- At list price, monthly cash flow is $248 ($3k/yr) — positive.
- The deal already cash-flows at list — no discount required.
- To meet the 1% rule (rent ≥ 1% of price), the offer needs to be $171k (2.3% below list).
- Recommended offer: $170k (3.0% below list) — sets the bar for market timing.
- Cap rate 8.0% vs local median 5.3% in Augusta-Richmond County consolidated government (balance) — top-decile yield for the area; either an underpriced asset or a hidden risk that comps aren't pricing in. Stress-test before assuming the spread holds.
Location & tenants
- Location reads: area grade C — affects rentability + tenant quality, not the cash-flow math above.
- Richmond County (urban): math 12% / reading 20% proficiency, ranked #154 of 174 in GA (top 88%) — low school quality limits family demand, transient renter base, plan for 1-2y turnover; 72% free/reduced lunch — lower-income household profile, screen leases tightly.
- Zoned schools: Diamond Lakes Elementary School (math 12% / reading 12%, grade F, #1,041 of 1,228 statewide, top 87%, 466 students, 98% FRL); Pine Hill Middle School (math 5% / reading 19%, grade F, #417 of 470 statewide, top 90%, 582 students, 98% FRL); Cross Creek High School (math 2% / reading 12%, grade F, #385 of 424 statewide, top 92%, 1,133 students, 98% FRL) — zoned schools average 98% FRL vs 72% district-wide (26 pts higher); higher-poverty schools than district average — tighter screening recommended.
- Market conditions: Rents soft (-0.7%/yr); 370 active listings in the ZIP; 6 comparable units currently listed for rent nearby; rentals at typical pace (median 25d on market — plan ~3-4 weeks tenant-placement turnaround); 561 units permitted in Richmond County in 2024 (0 in 5+ unit buildings).
Forward outlook
- Local home prices are declining (-3.0%/yr); year-one equity from $1k of loan paydown is wiped out by about $5k of value loss. Plan a longer hold.
- Richmond County population projected to shrink 5% by 2050 — rents likely to lag national; underwrite the cash flow, not the appreciation.
Negotiation context
- It's been on market 41 days — a 3% lower offer ($170k) is reasonable based on typical stale-listing flexibility.
- 2 sale attempts; this cycle's ask has dropped $25k (12%) from the opening price — seller is motivated, your offer sets the floor, not the list.
- Current owner paid $70k; list at $175k implies a 150% gain — meaningful room to come down on a strong offer.
Risks & watch-outs
- Climate carrying-cost: major wind risk, 69% chance of damaging wind over 30y; extreme-heat days projected 7→18/yr by 2055 (HVAC capex compounding) — expect insurance premiums to compound above CPI over the hold.
Questions for the listing agent
- It's been on market 41 days. Have you received any prior offers? Is the seller open to a 3% concession, seller financing, or rate buy-down credit?
- Is there a deadline driving the sale (1031 exchange, divorce, estate, relocation)? That informs how much negotiation room exists.
- What's the average days-on-market for RENTAL listings here right now (not sales)? A rising rental-DOM trend means longer vacancies and softer asking-rent achievability than the comps imply.
- What's the recent tenant-quality profile in this submarket — average credit score on applications, eviction rate, late-payment / NSF rate, and stable-employment percentage? A property-management company in the area should have these aggregated.
- How much new for-sale + rental construction is in the pipeline within 1–3 miles? Heavy new supply typically softens prices + rents 12–24 months out; constrained supply supports both.
Investment metrics
- 1% rule
- 0.98% ✗
- Cap rate
- 7.99%
- Cash-on-cash
- 6.07%
- DSCR
- 1.27
- GRM
- 8.5
CMA / ARV
- ARV (median comp)
- $231,231
- List price
- $175,000
- Delta
- -24.32%
- Verdict
- UNDERPRICED
- Comps
- 20 within 1.0 mi
Show comp detail 12 sales within ~0.75 mi
| Address | Dist | Beds/Ba | Sqft | Sold | Price | $/sf | Match |
|---|---|---|---|---|---|---|---|
| 2814 Wyndham Dr | 0.24mi | 3/2.0 | 1,260 (+1%) | 2mo | $225,000 | $179 | 86 |
| 2430 Boykin Rd | 0.19mi | 3/2.0 | 1,269 (+2%) | 8mo | $210,000 | $165 | 81 |
| 4212 Cap Chat St | 0.04mi | 4/2.0 (+1) | 1,383 (+11%) | 8mo | $120,000 | $87 | 68 |
| 2302 Hiwatha Dr | 0.66mi | 3/2.0 | 1,245 (+0%) | 10mo | $160,000 | $129 | 60 |
| 2412 Turkey Trail Dr | 0.59mi | 3/1.0 | 1,200 (-4%) | 4mo | $59,000 | $49 | 59 |
| 2317 Hiwatha Dr | 0.54mi | 3/2.0 | 1,138 (-8%) | 3mo | $161,950 | $142 | 58 |
| 4124 Country Ln | 0.52mi | 3/2.0 | 1,377 (+11%) | 2mo | $187,500 | $136 | 56 |
| 2316 Oketo Dr | 0.56mi | 3/2.0 | 1,350 (+8%) | 5mo | $205,000 | $152 | 55 |
| 2382 Travis Pines Dr | 0.69mi | 3/2.0 | 1,202 (-3%) | 8mo | $145,000 | $121 | 55 |
| 2365 Travis Rd | 0.66mi | 3/2.0 | 1,170 (-6%) | 9mo | $144,000 | $123 | 52 |
| 3721 Kingsgate Dr | 0.68mi | 3/2.0 | 1,377 (+11%) | 2mo | $93,000 | $68 | 49 |
| 2403 Travis Rd | 0.63mi | 3/2.0 | 1,397 (+12%) | 2mo | $199,500 | $143 | 49 |
Match score weights: distance 35% · size 25% · config 20% · recency 20%. Top-matched comps best support the ARV.
Projected returns pro-forma
-3.0% appreciation · 0.0% rent growth · sell at horizon
- IRR
- -10.1%
- Equity multiple
- 0.64×
- Total profit
- $-17,631
- Equity at exit
- $26,093
- IRR
- -5.2%
- Equity multiple
- 0.70×
- Total profit
- $-14,560
- Equity at exit
- $15,131
Cash invested: $49,000 (down + closing). Projections, not guarantees.
Landlord ↔ Tenant lean methodology
- Overall (STATE)
- 90 Strongly Landlord-Friendly
- State Georgia
- 90 Strongly Landlord-Friendly · R+3
- County
- — inherits STATE
- City
- — inherits STATE
ZIP-level market 30815
- Home prices YoY
- -24.2%
- Rents YoY
- -0.7%
- Active inventory
- 370
- Price-to-rent
- 8.5×
Monthly cashflow live
- Estimated rent
- $1,709 high interval (Pro) →
- Mortgage (P&I)
- −$918
- Tax from tax record
- −$112 /mo · $1,345/yr
- Insurance
- −$73
- HOA
- −$0
- Vacancy / Maint / Mgmt
- −$359
- Net cashflow
- $248
Break-even live
Sensitivity live
| Price | -10% $347 | -5% $297 | +0% $248 | +5% $198 | +10% $149 |
|---|---|---|---|---|---|
| Rent | -10% $113 | -5% $180 | +0% $248 | +5% $315 | +10% $383 |
| Rate | -1.0pp $336 | -0.5pp $292 | base $248 | +0.5pp $202 | +1.0pp $156 |
UW: 25.0% down · 7.5% · 30yr · 1.5% tax · 5.0% vac · 8.0% maint · 8.0% mgmt
Financing live
Cash to close
- Down payment
- $43,750
- Closing costs
- $5,250
- Reserves months
- —
- Total cash needed
- —
Loan-product check · same deal, 3 products live
Conventional
25% down · 7.5% · 30yr
- Down + closing
- —
- Monthly P&I
- —
- Monthly cashflow
- —
- DSCR
- —
- Eligible?
- —
Personal DTI + credit; lowest rate.
DSCR
20% down · 8.5% · 30yr
- Down + closing
- —
- Monthly P&I
- —
- Monthly cashflow
- —
- DSCR
- —
- Eligible?
- —
No personal income docs; deal must DSCR.
Hard money
10% down · 12.0% · 12mo
- Down + closing
- —
- Monthly P&I
- —
- Monthly cashflow
- —
- DSCR
- —
- Eligible?
- —
Short-term bridge; refi at stabilization.
Rent comps 6 comps
| Address | Beds | Baths | Sqft | Rent | $/sqft | DOM | Units | Dist |
|---|---|---|---|---|---|---|---|---|
| 4235 Cap Chat St Hephzibah, GA | 3.0 | 2.0 | 1300 | $1,651 | $1.27 | 45d | 1 | 0.16mi |
| 2629 Anthony Dejuan Pkwy Hephzibah, GA | 3.0 | 2.0 | 1392 | $1,650 | $1.19 | 45d | 1 | 0.75mi |
| 2302 Woodsman Dr Augusta, GA | 3.0 | 2.0 | 1436 | $1,475 | $1.03 | 25d | 1 | 0.87mi |
| 3462 Firestone Dr Hephzibah, GA | 3.0 | 2.5 | 1435 | $1,800 | $1.25 | 25d | 1 | 0.98mi |
| 3823 Fairington Dr Hephzibah, GA | 3.0 | 2.0 | 1380 | $1,450 | $1.05 | 15d | 1 | 1.12mi |
| 2573 Tobacco Rd Hephzibah, GA | 2.0 | 1.0 | 850 | $925 | $1.09 | 15d | 2 | 1.12mi |
Listing history 23 events
-
2026-06-21days on market $175,000 Active 41 DOM
-
2026-06-18days on market $175,000 Active 38 DOM
-
2026-06-17days on market $175,000 Active 37 DOM
-
2026-06-16days on market $175,000 Active 36 DOM
-
2026-06-15days on market $175,000 Active 35 DOM
-
2026-06-14days on market $175,000 Active 33 DOM
-
2026-06-10days on market $175,000 Active 30 DOM
-
2026-06-09days on market $175,000 Active 29 DOM
-
2026-06-08days on market $175,000 Active 28 DOM
-
2026-06-07days on market $175,000 Active 27 DOM
-
2026-06-03days on market $175,000 Active 23 DOM
-
2026-06-02days on market $175,000 Active 22 DOM
-
2026-06-01days on market $175,000 Active 21 DOM
-
2026-05-31days on market $175,000 Active 20 DOM
-
2026-05-30days on market $175,000 Active 19 DOM
-
2026-05-11historical
-
2026-04-28price $175,000
-
2026-04-14price $185,000
-
2026-03-29price $189,900
-
2026-03-23$199,900 Active
-
2026-03-22$175,000 Active 323-char remark
-
2026-01-16soldstatus $70,000
-
1998-05-20soldstatus $56,406
ⓘ Source: listings_history table (triggers on properties + properties_extension) + one-shot
backfill from property_details.listing_events for pre-trigger history.
Tax reassessment forecast GA · Resets to sale price
- Current annual tax
- $1,345 · $112/mo
- Projected year-2 tax
- $1,610 · $134/mo
- Expected delta
- +$265/yr (+$22/mo · 19.7%)
ⓘ Screening estimate from a state-policy table — verify with the county assessor before closing.
Climate risk First Street
- Flood 1/10 Low FEMA zone X (unshaded) · 0% chance over 30 yrs
- Wildfire 4/10 Moderate
- Heat 7/10 Severe 7 d/yr ≥107°F today · 18 d/yr by 30 yrs out
- Wind 6/10 Major 69% chance of damaging wind over 30 yrs
- Air quality 3/10 Moderate 3 unhealthy d/yr today · 3 by 30 yrs out
Nearby sold comps map
Loading sold comps map…
Walkable amenities ~0.75 mi
Loading nearby amenities…
Taxation est. · year 1
- Rental income
- $20,513
- − Mortgage interest
- −$9,803
- − Property taxes
- −$1,345
- − Insurance
- −$875
- − Repairs & maintenance
- −$1,641
- − Management
- −$1,641
- − Depreciation
- −$5,091
- Taxable income
- $117
- Est. tax owed @ 24.0%
- −$28
- After-tax cash flow
- $2,944/yr
For passive investors: Depreciation is non-cash, so a rental often shows a tax loss while cash-flowing — sheltering income. Rental losses are passive: they offset passive income freely, and up to $25,000/yr can offset ordinary (W-2) income if you actively participate and your MAGI is under $100k (phasing out to $0 by $150k); unused losses carry forward. On sale, claimed depreciation is recaptured at up to 25%, and gains may owe capital-gains tax (a 1031 exchange can defer both). Figures are a year-1 estimate at your 24.0% rate — not tax advice; consult a CPA.
Schools (NCES district)
- District
- Richmond County
- NCES district ID
- 1304380
- Math proficiency
- 12% ▼ -9.00%
- Reading proficiency
- 20% ▼ -6.00%
- Median HH income
- $38,069
- Composite
- 13.43/100
- National rank
- #9524
- State rank
- #154 of 174 in GA
Livability — Augusta-Richmond County consolidated government (balance)
No livability data for this city. (Only ~50 U.S. cities are tracked.)
Census & demographics
- Census place
- Augusta-Richmond County consolidated government (balance), GA
- County
- Richmond County · 190,917 people
- City population
- 154,035
- Metro
- Augusta-Richmond County, GA-SC
- Population (ZIP)
- 44,109
- Household income
- $70,202
- Rent vs Own
- Severe rent burden
- 867.0
Population outlook (Richmond County) Hauer SSP2
- Today (2025)
- 200,753 people
- By 2030
- 200,232 · -0.3%
- By 2040
- 196,813 · -2.0%
- By 2050
- 190,347 · -5.2%
- By 2075
- 172,496 · -14.1%
- By 2100
- 146,284 · -27.1%
Race, ethnicity, and origin ACS 2023
- Neighborhood character
- Majority Black (62%)
- Race & ethnicity
- Black 62% White 27% Two or more races 5% Hispanic / Latino 4%
- Foreign-born
- 4% · Canada, South Korea
- Languages at home
- 93% English-only · Spanish 3% Other Indo-European 1% Korean 1%
Political lean MEDSL · Richmond
- 2024 margin
- Solid D (+36.1) · D 67.8% · R 31.7%
- 2008→2024 swing
- +4.3pp toward D · 2008: 31.8pp · 2024: 36.1pp
- All cycles
- 2024: D+36.1 2020: D+37.2 2016: D+32.4 2012: D+33.8 2008: D+31.8
Not yet ingested
- Civics
- —
Market trends
- HPI YoY
- ▼ -51.74%
- Current HPI
- 162.4074
- Rent YoY
- ▼ -0.71%
- Metro
- Augusta-Richmond County, GA-SC
- State GDP YoY
- ▲ 2.66%
- F500 in state
- 28
Industry mix (Fortune 500 HQ in GA)
| Industry | F500 HQs | Revenue |
|---|---|---|
| Paper / Packaging | 2 | $29B |
|
||
| Retail | 1 | $160B |
|
||
| Transportation / Logistics | 1 | $91B |
|
||
| Airlines | 1 | $62B |
|
||
| Consumer Goods | 1 | $47B |
|
||
| Utilities | 1 | $25B |
|
||
Price history
+210.3% since first listed8 events — show timeline
- 2026-05-11 Listing Removed — Hive MLS
- 2026-04-28 Price Changed $175,000 Hive MLS
- 2026-04-14 Price Changed $185,000 Hive MLS
- 2026-03-29 Price Changed $189,900 Hive MLS
- 2026-03-23 Listed $199,900 Hive MLS
- 2026-03-22 Listed $175,000 Hive MLS
- 2026-01-16 Sold (Public Records) $70,000 Public Records
- 1998-05-20 Sold (Public Records) $56,406 Public Records
Property tax history
+11.0%/yrLatest (2025): $1,345 · +38.3% YoY. Source: county tax records.
Cash-flow waterfall
monthlySold comps — $/sqft
last 12 mo · ≤1 miLoading sold comps…