1456 E PHILADELPHIA #359 · Ontario, CA
Flood risk 4/10 · Minor
- FEMA flood zone
- X
- Chance of flooding over 30 yrs
- 0.2%
- Est. flood insurance / yr
- $507 – $1,088
Fire risk 1/10 · Minimal
- Est. fire insurance / yr
- $659 – $1,223
Heat risk 8/10 · Major
- Hot days now (above 100°F)
- 7 days/yr
- Hot days in 30 yrs
- 19 days/yr
Wind risk 1/10 · Minimal
- Chance of severe wind over 30 yrs
- —
Air-quality risk 9/10 · Severe
- Unhealthy air days now
- 23 days/yr
- Unhealthy air days in 30 yrs
- 26 days/yr
Risk factors via First Street. Map © Google.
Why this score? — see what drove the C+ grade
The composite is a weighted blend of 9 inputs, each scored 0–100. Each bar is that input's sub-score; the figure is the points it added to the 100-point composite (weight × sub-score).
- Cash flow +30.0/30.0
- 1% rule +10.0/10.0
- DSCR +10.0/10.0
- Schools +3.7/10.0
- Livability +3.2/5.0
- Rent growth +3.1/5.0
- Condition / age +2.5/5.0
- ARV discount +0.0/15.0
- Appreciation +0.0/10.0
$169,500
🖨 Deal sheet 📄 Offer letter ✓ Due diligence
Listing remarks
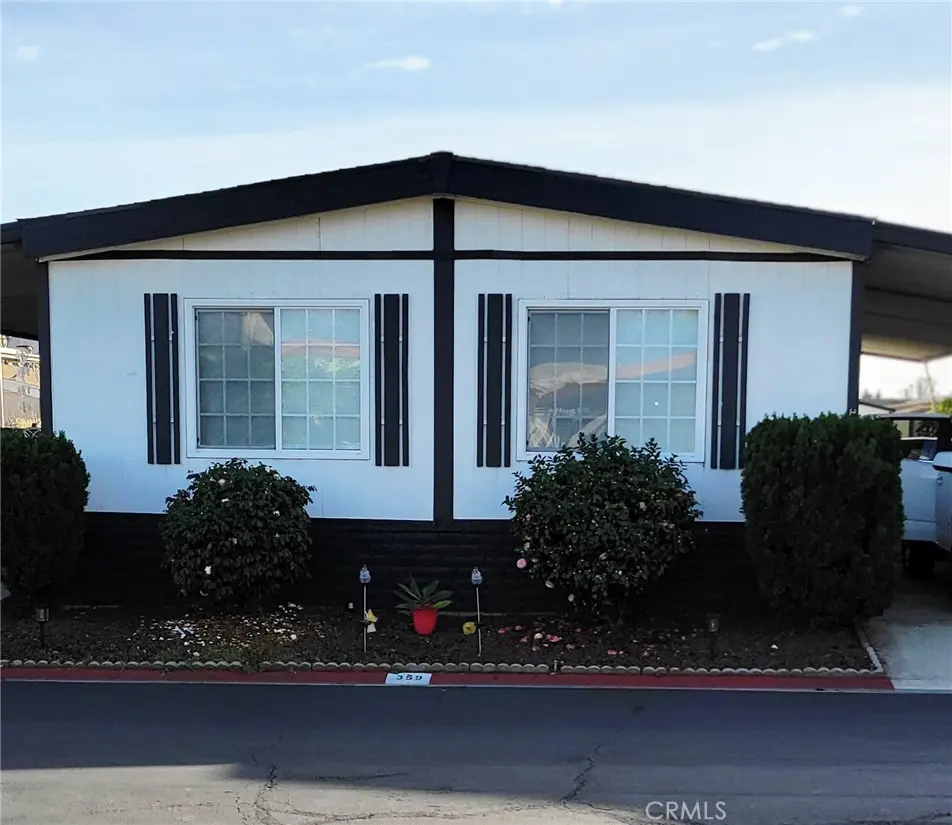
This upgraded and well-maintained home features a bright kitchen with updated finishes and ample natural light. A separate sitting or reading nook provides additional flexible space for work or relaxation. Interior details include neutral flooring, clean wall finishes, double-paned windows, new "Roman-style blinds. " The home has been cared for and is move-in ready, offering a functional layout with inviting interior spaces. The park is a great place to meet new friends, have family visits in the beautiful sparkling pool area, play tennis, walk your dogs and enjoy the quaint 55+ community located just minutes away from the 10 frwy. RV Parking available.
Key facts
- Bright kitchen
- Rv parking
- Sparkling pool area
Tags
Property features AI
Finance
- Other: Pets allowed with breed restrictions
- Financial info: Land lease applies ($1,800)
- HOA & community: Part of an association; Senior community; Park name: Rancho Ontario; Community features include a dog park
Exterior
- Parking: Covered parking / carport; 2 parking spaces (includes 2 garage spaces)
- Utilities: District / public water; Private sewer; Cable available
- Home design: Single-story mobile home (24' x 60'); Faces east; Entry at street level
- Construction: Composition roof; Mobile home remains on property
- Exterior features: Covered patio and open patio; Deck; In-ground heated community pool; Shed; Fenced yard (good condition)
Interior
- Kitchen: Convection oven; Gas range and gas oven; Gas & electric range; Dishwasher; Gas water heater
- Bedrooms: One level entry (Entry located on Philadelphia St)
- Flooring: Vinyl flooring
- Bathrooms: 2 full bathrooms with soaking tub, walk-in shower, and quartz counters
- Heating & cooling: Forced air heating
- Interior features: Ceiling fan; Double pane windows with blinds; Community spa
- Laundry & utility: Dedicated laundry room; Washer hookup; Electric dryer hookup
Neighborhood map
What this means for you Summary
Snapshot
- This is a 3-bed/2.0-bath manufactured listed at $170k.
Deal economics
- At list price, monthly cash flow is $1k ($16k/yr) — positive.
- The deal already cash-flows at list — no discount required.
- Meets the 1% rule at list price ($3k rent vs $170k).
- Cap rate 16.0% vs local median 2.7% in Ontario — top-decile yield for the area; either an underpriced asset or a hidden risk that comps aren't pricing in. Stress-test before assuming the spread holds.
Location & tenants
- Location reads 63/100 on livability (#435 in CA) — a middle-class / working-renter tenant base. Strengths: commute A-, housing B+; Watch: schools F, cost of living F, health & safety F.
- Ontario-Montclair (urban): math 35% / reading 44% proficiency, ranked #731 of 1,400 in CA (top 52%) — families likely to look elsewhere, expect single-tenant / working-renter base with shorter leases; 75% free/reduced lunch — lower-income household profile, screen leases tightly.
- Market conditions: Rents rising (+2.4%/yr); 314 active listings in the ZIP; 10 comparable units currently listed for rent nearby; rentals leasing fast (median 4d on market — plan ~1-2 weeks tenant-placement turnaround); solid renter incomes; 5,458 units permitted in San Bernardino County in 2024 (1,500 in 5+ unit buildings).
- This rent runs 38% of the median local income ($101k/yr) — at the standard rent-burdened threshold; future hikes will face affordability resistance.
Forward outlook
- Local home prices are declining (-3.0%/yr); year-one equity from $1k of loan paydown is wiped out by about $5k of value loss. Plan a longer hold.
- San Bernardino County population projected at +15% by 2050 — modest demand growth; plan on rents tracking national, not racing it.
- At projected returns (-3.0% appreciation + 2.4% rent growth), your $47k cash investment doubles in ~4 years — after that, you're playing with house money.
Negotiation context
- Only 10 days on market — expect competitive offers; lowballing is unlikely to land.
- 5 sale attempts since 4y ago with the ask held roughly flat each time — persistent listings suggest the price (not the market) is what's stuck; bring a comps-based counter.
Risks & watch-outs
- Climate carrying-cost: extreme-heat days projected 7→19/yr by 2055 (HVAC capex compounding) — expect insurance premiums to compound above CPI over the hold.
Questions for the listing agent
- Built in 1979 — when were the roof, HVAC, electrical panel, plumbing, and water heater last replaced?
- Is there a deadline driving the sale (1031 exchange, divorce, estate, relocation)? That informs how much negotiation room exists.
- Schools are F-rated, which usually means shorter tenancies and higher turnover. Who's the typical renter profile here, and what's been the actual vacancy rate?
- What's the average days-on-market for RENTAL listings here right now (not sales)? A rising rental-DOM trend means longer vacancies and softer asking-rent achievability than the comps imply.
- What's the recent tenant-quality profile in this submarket — average credit score on applications, eviction rate, late-payment / NSF rate, and stable-employment percentage? A property-management company in the area should have these aggregated.
- How much new for-sale + rental construction is in the pipeline within 1–3 miles? Heavy new supply typically softens prices + rents 12–24 months out; constrained supply supports both.
Investment metrics
- 1% rule
- 1.90% ✓
- Cap rate
- 15.97%
- Cash-on-cash
- 34.57%
- DSCR
- 2.54
- GRM
- 4.4
CMA / ARV
- ARV (on-the-fly)
- $144,000
- Comps found
- 12
Show comp detail 12 sales within ~0.75 mi
| Address | Dist | Beds/Ba | Sqft | Sold | Price | $/sf | Match |
|---|---|---|---|---|---|---|---|
| 1456 E Philadelphia St Spc 390 | 0.00mi | 3/2.0 | 1,469 (+2%) | 1mo | $180,000 | $123 | 96 |
| 1456 E Philadelphia #2 | 0.00mi | 3/2.0 | 1,425 (-1%) | 3mo | $187,000 | $131 | 96 |
| 1456 E Philadelphia St #300 | 0.00mi | 3/2.0 | 1,440 (0%) | 15mo | $164,900 | $115 | 87 |
| 1456 E Philadelphia St Spc 424 | 0.00mi | 3/2.0 | 1,536 (+7%) | 2mo | $80,000 | $52 | 87 |
| 1456 E Philadelphia St #230 | 0.00mi | 3/2.0 | 1,495 (+4%) | 15mo | $120,000 | $80 | 81 |
| 1456 E Philadelphia #372 | 0.00mi | 3/2.0 | 1,600 (+11%) | 2mo | $96,000 | $60 | 80 |
| 1456 E Philadelphia #24 | 0.00mi | 2/2.0 (-1) | 1,536 (+7%) | 5mo | $130,000 | $85 | 80 |
| 1456 E Philadelphia St Spc 444 | 0.00mi | 3/2.0 | 1,560 (+8%) | 11mo | $150,000 | $96 | 77 |
| 1456 E Philadelphia St Spc 41 | 0.00mi | 2/2.0 (-1) | 1,248 (-13%) | 1mo | $161,000 | $129 | 72 |
| 1456 E Philadelphia St #101 | 0.00mi | 3/2.0 | 1,602 (+11%) | 15mo | $186,000 | $116 | 69 |
| 1456 E PHILADELPHIA St #431 | 0.00mi | 3/2.0 | 1,617 (+12%) | 16mo | $148,000 | $92 | 66 |
| 1456 E Philadelphia St #108 | 0.00mi | 2/2.0 (-1) | 1,248 (-13%) | 10mo | $125,000 | $100 | 65 |
Match score weights: distance 35% · size 25% · config 20% · recency 20%. Top-matched comps best support the ARV.
Projected returns pro-forma
-3.0% appreciation · 2.39% rent growth · sell at horizon
- IRR
- 29.4%
- Equity multiple
- 2.22×
- Total profit
- $57,714
- Equity at exit
- $25,273
- IRR
- 36.3%
- Equity multiple
- 4.26×
- Total profit
- $154,653
- Equity at exit
- $14,655
Cash invested: $47,460 (down + closing). Projections, not guarantees.
Landlord ↔ Tenant lean methodology
- Overall (STATE)
- 18 Strongly Tenant-Friendly
- State California
- 18 Strongly Tenant-Friendly · D+13
- County
- — inherits STATE
- City
- — inherits STATE
ZIP-level market 91761
- Rents YoY
- 2.4%
- Active inventory
- 314
- Price-to-rent
- 4.4×
Monthly cashflow live
- Estimated rent
- $3,214 high interval (Pro) →
- Mortgage (P&I)
- −$889
- Tax est. 1.5%
- −$212 /mo · $2,542/yr
- Insurance
- −$71
- HOA
- −$0
- Vacancy / Maint / Mgmt
- −$675
- Net cashflow
- $1,367
Break-even live
UW: 25.0% down · 7.5% · 30yr · 1.5% tax · 5.0% vac · 8.0% maint · 8.0% mgmt
Financing live
Cash to close
- Down payment
- $42,375
- Closing costs
- $5,085
- Reserves months
- —
- Total cash needed
- —
Loan-product check · same deal, 3 products live
Conventional
25% down · 7.5% · 30yr
- Down + closing
- —
- Monthly P&I
- —
- Monthly cashflow
- —
- DSCR
- —
- Eligible?
- —
Personal DTI + credit; lowest rate.
DSCR
20% down · 8.5% · 30yr
- Down + closing
- —
- Monthly P&I
- —
- Monthly cashflow
- —
- DSCR
- —
- Eligible?
- —
No personal income docs; deal must DSCR.
Hard money
10% down · 12.0% · 12mo
- Down + closing
- —
- Monthly P&I
- —
- Monthly cashflow
- —
- DSCR
- —
- Eligible?
- —
Short-term bridge; refi at stabilization.
Rent comps 10 comps
| Address | Beds | Baths | Sqft | Rent | $/sqft | DOM | Units | Dist |
|---|---|---|---|---|---|---|---|---|
| 1110 E Philadelphia St Ontario, CA | 1.0–2.0 | 1.0–2.0 | 904 | $3,207 | $3.55 | 2d | 12 | 0.47mi |
| 2432 S Garfield Pl Ontario, CA | 3.0 | 2.0 | 1118 | $3,150 | $2.82 | 2d | 1 | 0.66mi |
| 2631 S Cucamonga Ave Ontario, CA | 3.0 | 2.5 | 1726 | $3,400 | $1.97 | 44d | 1 | 0.71mi |
| 2815 S Augusta Ave Ontario, CA | 4.0 | 2.0 | 1524 | $3,600 | $2.36 | 2d | 1 | 0.77mi |
| 2042 S Bon View Ave Unit C Ontario, CA | 2.0 | 2.5 | 1364 | $2,700 | $1.98 | 2d | 1 | 0.85mi |
| 629 E Madeleine Privado Ontario, CA | 3.0 | 2.5 | 1465 | $3,250 | $2.22 | 22d | 1 | 1.29mi |
| 629 E Madeleine Privado Ontario, CA | 3.0 | 2.5 | 1465 | $3,350 | $2.29 | 44d | 1 | 1.29mi |
| 2057 S Cherry Ave Ontario, CA | 4.0 | 2.0 | 1236 | $3,500 | $2.83 | 2d | 1 | 1.36mi |
| 619 E Riverside Dr Ontario, CA | 1.0–2.0 | 1.0–2.0 | 866 | $2,295 | $2.65 | 3d | 5 | 1.43mi |
| 551 E Riverside Dr Ontario, CA | 1.0–2.0 | 1.0–2.0 | 782 | $2,665 | $3.41 | 3d | 12 | 1.49mi |
Listing history 8 events
-
2026-06-18days on market $169,500 Active 10 DOM
-
2026-06-17days on market $169,500 Active 9 DOM
-
2026-06-16days on market $169,500 Active 8 DOM
-
2026-06-15days on market $169,500 Active 7 DOM
-
2026-06-13days on market $169,500 Active 5 DOM
-
2026-06-13days on market $169,500 Active 4 DOM
-
2026-06-09remarks 661-char remark
-
2026-06-09$169,500 Active 1 DOM
ⓘ Source: listings_history table (triggers on properties + properties_extension) + one-shot
backfill from property_details.listing_events for pre-trigger history.
Climate risk First Street
- Flood 4/10 Moderate FEMA zone X · 20% chance over 30 yrs
- Wildfire 1/10 Low
- Heat 8/10 Severe 7 d/yr ≥100°F today · 19 d/yr by 30 yrs out
- Wind 1/10 Low
- Air quality 9/10 Extreme 23 unhealthy d/yr today · 26 by 30 yrs out
Nearby sold comps map
Loading sold comps map…
Walkable amenities ~0.75 mi
Loading nearby amenities…
Taxation est. · year 1
- Rental income
- $38,564
- − Mortgage interest
- −$9,495
- − Property taxes
- −$2,542
- − Insurance
- −$848
- − Repairs & maintenance
- −$3,085
- − Management
- −$3,085
- − Depreciation
- −$4,931
- Taxable income
- $14,578
- Est. tax owed @ 24.0%
- −$3,499
- After-tax cash flow
- $12,910/yr
For passive investors: Depreciation is non-cash, so a rental often shows a tax loss while cash-flowing — sheltering income. Rental losses are passive: they offset passive income freely, and up to $25,000/yr can offset ordinary (W-2) income if you actively participate and your MAGI is under $100k (phasing out to $0 by $150k); unused losses carry forward. On sale, claimed depreciation is recaptured at up to 25%, and gains may owe capital-gains tax (a 1031 exchange can defer both). Figures are a year-1 estimate at your 24.0% rate — not tax advice; consult a CPA.
Schools (NCES district)
- District
- Ontario-Montclair
- NCES district ID
- 0628470
- Math proficiency
- 35% ▲ 4.00%
- Reading proficiency
- 44% ▲ 2.00%
- Median HH income
- $50,668
- Composite
- 36.57/100
- National rank
- #9282
- State rank
- #731 of 1400 in CA
Livability — Ontario
- Score
- 63/100
- State rank
- #435
- US rank
- #14949
Category grades
Schools grade is shown separately in the Schools card above.
Census & demographics
- Census place
- Ontario, CA
- County
- San Bernardino County · 2,030,291 people
- City population
- 183,440
- Metro
- Riverside-San Bernardino-Ontario, CA
- Population (ZIP)
- 62,935
- Household income
- $100,578
- Rent vs Own
- Severe rent burden
- 1853.0
Population outlook (San Bernardino County) Hauer SSP2
- Today (2025)
- 2,300,329 people
- By 2030
- 2,378,907 · +3.4%
- By 2040
- 2,523,137 · +9.7%
- By 2050
- 2,642,388 · +14.9%
- By 2075
- 2,880,769 · +25.2%
- By 2100
- 2,909,436 · +26.5%
Race, ethnicity, and origin ACS 2023
- Neighborhood character
- Predominantly Hispanic (66%)
- Race & ethnicity
- Hispanic / Latino 66% Two or more races 23% White 15% Asian 9% Black 6% Native American 2%
- Hispanic origin (detail)
- Mexican 59%
- Common ancestry
- Iranian 1% Lithuanian 1% Italian 1%
- Foreign-born
- 24% · Canada, China, Vietnam
- Languages at home
- 51% English-only · Spanish 41% Chinese 3% Tagalog/Filipino 1%
Political lean MEDSL · San Bernardino
- 2024 margin
- Toss-up / Even · D 47.5% · R 49.7% · Other 2.8%
- 2008→2024 swing
- -8.5pp toward R · 2008: 6.3pp · 2024: -2.1pp
- All cycles
- 2024: R+2.1 2020: D+10.7 2016: D+9.8 2012: D+5.4 2008: D+6.3
Not yet ingested
- Civics
- —
Market trends
- HPI YoY
- ▼ -374.91%
- Current HPI
- 400.5674
- Rent YoY
- ▲ 2.39%
- Metro
- Riverside-San Bernardino-Ontario, CA
- State GDP YoY
- ▲ 3.21%
- F500 in state
- 116
Industry mix (Fortune 500 HQ in CA)
| Industry | F500 HQs | Revenue |
|---|---|---|
| Technology | 27 | $1,492B |
|
||
| Financial Services | 3 | $174B |
|
||
| Retail | 3 | $44B |
|
||
| Insurance | 3 | $26B |
|
||
| Media / Entertainment | 2 | $115B |
|
||
| Pharmaceuticals / Biotech | 2 | $62B |
|
||
Price history
+6.0% since first listed15 events — show timeline
- 2026-06-08 Listed $169,500 CRMLS
- 2026-05-20 Listing Removed — CRMLS
- 2026-05-15 Relisted — CRMLS
- 2026-05-14 Listing Removed — CRMLS
- 2026-03-06 Listed $175,000 CRMLS
- 2026-03-02 Listing Removed — CRMLS
- 2026-01-30 Listed $175,000 CRMLS
- 2026-01-28 Coming Soon — CRMLS
- 2022-12-23 Sold (MLS) $159,900 CRMLS
- 2022-12-20 Pending — CRMLS
- 2022-12-06 Contingent — CRMLS
- 2022-11-08 Price Changed $159,900 CRMLS
- 2022-09-26 Listed $169,900 CRMLS
- 2022-09-22 Price Changed $169,900 CRMLS
- 2022-09-17 Coming Soon $159,900 CRMLS
Property tax history
+1.1%/yrLatest (2025): $158 · +0.3% YoY. Source: county tax records.
Cash-flow waterfall
monthlySold comps — $/sqft
last 12 mo · ≤1 miLoading sold comps…