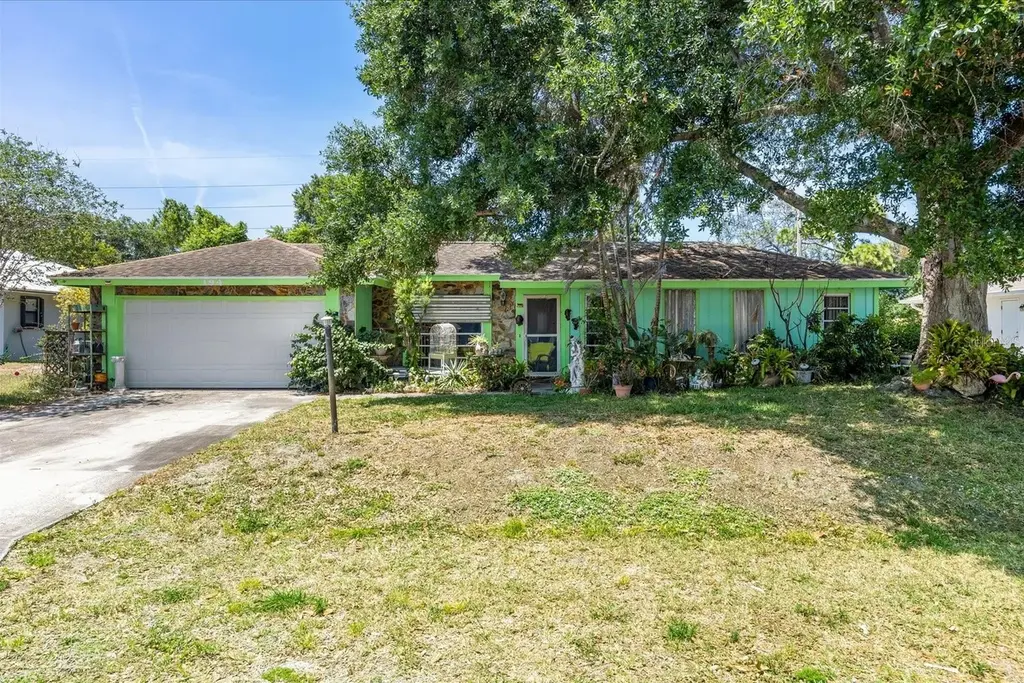
194 Del Monte Rd · Sebastian, FL
Flood risk 1/10 · Minimal
- FEMA flood zone
- X (unshaded)
- Chance of flooding over 30 yrs
- 0.0%
- Est. flood insurance / yr
- $507 – $1,088
Fire risk 2/10 · Minimal
- Est. fire insurance / yr
- $947 – $1,759
Heat risk 10/10 · Severe
- Hot days now (above 105°F)
- 7 days/yr
- Hot days in 30 yrs
- 24 days/yr
Wind risk 10/10 · Severe
- Chance of severe wind over 30 yrs
- 99.0%
Air-quality risk 1/10 · Minimal
- Unhealthy air days now
- 0 days/yr
- Unhealthy air days in 30 yrs
- 0 days/yr
Risk factors via First Street. Map © Google.
Why this score? — see what drove the C grade
The composite is a weighted blend of 9 inputs, each scored 0–100. Each bar is that input's sub-score; the figure is the points it added to the 100-point composite (weight × sub-score).
- Cash flow +17.8/30.0
- ARV discount +13.5/15.0
- DSCR +5.6/10.0
- Schools +4.2/10.0
- Rent growth +4.1/5.0
- Livability +4.0/5.0
- 1% rule +3.8/10.0
- Condition / age +2.5/5.0
- Appreciation +0.0/10.0
$240,700
🖨 Deal sheet 📄 Offer letter ✓ Due diligence
Listing remarks MLS
Cathedral Cedar ceilings in living room give this home a rustic look. Multiple sliders various rooms lead to nice pool area with extra deep lot. (191 ft. ) Jacuzzi jetted tub in master. Fenced yard with tons on room outside pool area. 3 bedrooms, 2 bath, 2 car garage. Great Deal!
Key facts
- Landscaping trees
- Septic drain field
- Well for irrigation
Tags
Property features AI
Finance
- Other: Lot roughly 0.35 acre (approx. 80 x 190.25); Zoned RS-10; No CDD; Living area approx. 1,218 (public records)
Exterior
- Parking: Attached garage with 2 spaces
- Utilities: Public water and well; Septic tank sewer; BB/HS internet available; Electricity connected
- Home design: Single-family residence; One story; Faces north; Homestead exempt
- Construction: Block construction; Shingle roof; Slab foundation; Built as a residential single-family home
- Exterior features: Private in-ground gunite pool; Paved road access
Interior
- Kitchen: Range; Refrigerator
- Bedrooms: 3 bedrooms
- Flooring: Carpet; Tile
- Bathrooms: 2 full bathrooms
- Heating & cooling: Central heating; Central air conditioning
- Interior features: Other interior features
- Laundry & utility: Laundry inside; Electric water heater
Neighborhood map
What this means for you Summary
Snapshot
- This is a 3-bed/2.0-bath single-family listed at $241k.
Deal economics
- At list price, monthly cash flow is $196 ($2k/yr) — positive.
- The deal already cash-flows at list — no discount required.
- To meet the 1% rule (rent ≥ 1% of price), the offer needs to be $212k (11.7% below list).
- Recommended offer: $212k (11.7% below list) — sets the bar for 1% rule.
- Cap rate 7.3% vs local median 4.4% in Sebastian — top-decile yield for the area; either an underpriced asset or a hidden risk that comps aren't pricing in. Stress-test before assuming the spread holds.
Location & tenants
- Location reads 81/100 on livability (#89 in FL, #1,421 nationally) — a professional / high-income tenant draw. Strengths: housing A+, crime A, health & safety A; Watch: schools D+, amenities D-.
- Indian River (other): math 48% / reading 52% proficiency, ranked #35 of 73 in FL (top 48%) — acceptable for families but not a draw, mixed tenant base, ~2y average lease.
- Market conditions: Rents rising fast (+6.2%/yr); 412 active listings in the ZIP; 15 comparable units currently listed for rent nearby; rentals at typical pace (median 21d on market — plan ~3-4 weeks tenant-placement turnaround); 564 units permitted in Indian River County in 2024 (281 in 5+ unit buildings).
- This rent runs 38% of the median local income ($67k/yr) — at the standard rent-burdened threshold; future hikes will face affordability resistance.
Forward outlook
- Local home prices are declining (-3.0%/yr); year-one equity from $2k of loan paydown is wiped out by about $7k of value loss. Plan a longer hold.
- Indian River County population projected at +18% by 2050 — long-run rental-demand tailwind backs the buy-and-hold thesis.
Negotiation context
- It's been on market 18 days — a 2% lower offer ($237k) is reasonable based on typical stale-listing flexibility.
- 4 sale attempts since 15y ago with the ask held roughly flat each time — persistent listings suggest the price (not the market) is what's stuck; bring a comps-based counter.
- Current owner paid $120k; list at $241k implies a 101% gain — meaningful room to come down on a strong offer.
Risks & watch-outs
- Climate carrying-cost: severe wind risk, 99% chance of damaging wind over 30y; extreme-heat days projected 7→24/yr by 2055 (HVAC capex compounding) — expect insurance premiums to compound above CPI over the hold.
Questions for the listing agent
- Is there a deadline driving the sale (1031 exchange, divorce, estate, relocation)? That informs how much negotiation room exists.
- Schools are D-rated, which usually means shorter tenancies and higher turnover. Who's the typical renter profile here, and what's been the actual vacancy rate?
- What's the average days-on-market for RENTAL listings here right now (not sales)? A rising rental-DOM trend means longer vacancies and softer asking-rent achievability than the comps imply.
- What's the recent tenant-quality profile in this submarket — average credit score on applications, eviction rate, late-payment / NSF rate, and stable-employment percentage? A property-management company in the area should have these aggregated.
- How much new for-sale + rental construction is in the pipeline within 1–3 miles? Heavy new supply typically softens prices + rents 12–24 months out; constrained supply supports both.
Investment metrics
- 1% rule
- 0.88% ✗
- Cap rate
- 7.27%
- Cash-on-cash
- 3.49%
- DSCR
- 1.16
- GRM
- 9.4
CMA / ARV
- ARV (on-the-fly)
- $277,704
- Comps found
- 12
Show comp detail 12 sales within ~0.75 mi
| Address | Dist | Beds/Ba | Sqft | Sold | Price | $/sf | Match |
|---|---|---|---|---|---|---|---|
| 194 Del Monte Rd | 0.00mi | 3/2.0 | 1,218 (0%) | 0mo | $210,000 | $172 | 100 |
| 282 Dock Ave | 0.22mi | 2/2.0 (-1) | 1,206 (-1%) | 7mo | $275,000 | $228 | 78 |
| 571 Balboa St | 0.20mi | 2/1.5 (-1) | 1,170 (-4%) | 2mo | $260,000 | $222 | 75 |
| 100 S S. Wimbrow Dr #15 | 0.31mi | 2/2.0 (-1) | 1,253 (+3%) | 2mo | $240,000 | $192 | 74 |
| 100 S Wimbrow Dr | 0.32mi | 2/2.0 (-1) | 1,253 (+3%) | 2mo | $240,000 | $192 | 74 |
| 495 Easy St | 0.43mi | 3/2.0 | 1,276 (+5%) | 3mo | $255,500 | $200 | 69 |
| 382 Easy St | 0.62mi | 3/2.0 | 1,194 (-2%) | 2mo | $325,000 | $272 | 66 |
| 66 Judah Ln | 0.39mi | 3/2.0 | 1,315 (+8%) | 7mo | $378,000 | $287 | 63 |
| 262 Dock Ave | 0.21mi | 2/2.0 (-1) | 1,068 (-12%) | 8mo | $325,000 | $304 | 58 |
| 517 Park Ave | 0.64mi | 2/2.0 (-1) | 1,234 (+1%) | 8mo | $290,000 | $235 | 56 |
| 534 Michael St | 0.71mi | 3/2.0 | 1,188 (-2%) | 9mo | $297,500 | $250 | 55 |
| 589 Michael St | 0.70mi | 3/2.0 | 1,333 (+9%) | 7mo | $252,500 | $189 | 46 |
Match score weights: distance 35% · size 25% · config 20% · recency 20%. Top-matched comps best support the ARV.
Projected returns pro-forma
-3.0% appreciation · 6.22% rent growth · sell at horizon
- IRR
- -7.6%
- Equity multiple
- 0.71×
- Total profit
- $-19,484
- Equity at exit
- $35,889
- IRR
- 5.3%
- Equity multiple
- 1.44×
- Total profit
- $29,951
- Equity at exit
- $20,811
Cash invested: $67,396 (down + closing). Projections, not guarantees.
Landlord ↔ Tenant lean methodology
- Overall (STATE)
- 87 Strongly Landlord-Friendly
- State Florida
- 87 Strongly Landlord-Friendly · R+3
- County
- — inherits STATE
- City
- — inherits STATE
ZIP-level market 32958
- Home prices YoY
- -13.1%
- Rents YoY
- 6.2%
- Active inventory
- 412
- Price-to-rent
- 9.4×
Monthly cashflow live
- Estimated rent
- $2,125 high interval (Pro) →
- Mortgage (P&I)
- −$1,262
- Tax from tax record
- −$120 /mo · $1,436/yr
- Insurance
- −$100
- HOA
- −$0
- Vacancy / Maint / Mgmt
- −$446
- Net cashflow
- $196
Break-even live
UW: 25.0% down · 7.5% · 30yr · 1.5% tax · 5.0% vac · 8.0% maint · 8.0% mgmt
Financing live
Cash to close
- Down payment
- $60,175
- Closing costs
- $7,221
- Reserves months
- —
- Total cash needed
- —
Loan-product check · same deal, 3 products live
Conventional
25% down · 7.5% · 30yr
- Down + closing
- —
- Monthly P&I
- —
- Monthly cashflow
- —
- DSCR
- —
- Eligible?
- —
Personal DTI + credit; lowest rate.
DSCR
20% down · 8.5% · 30yr
- Down + closing
- —
- Monthly P&I
- —
- Monthly cashflow
- —
- DSCR
- —
- Eligible?
- —
No personal income docs; deal must DSCR.
Hard money
10% down · 12.0% · 12mo
- Down + closing
- —
- Monthly P&I
- —
- Monthly cashflow
- —
- DSCR
- —
- Eligible?
- —
Short-term bridge; refi at stabilization.
Rent comps 15 comps
| Address | Beds | Baths | Sqft | Rent | $/sqft | DOM | Units | Dist |
|---|---|---|---|---|---|---|---|---|
| 246 S Wimbrow Dr Sebastian, FL | 3.0 | 2.0 | 1364 | $3,000 | $2.20 | 13d | 1 | 0.40mi |
| 351 Del Monte Rd Unit B Sebastian, FL | 3.0 | 2.0 | 1416 | $1,900 | $1.34 | 13d | 1 | 0.41mi |
| 351 Del Monte Rd Unit B Sebastian, FL | 3.0 | 2.0 | 1416 | $1,900 | $1.34 | 21d | 1 | 0.41mi |
| 362 Del Monte Rd Unit A Sebastian, FL | 2.0 | 2.0 | 1045 | $1,600 | $1.53 | 21d | 1 | 0.43mi |
| 243 Harp Ter Unit A Sebastian, FL | 2.0 | 2.0 | 1150 | $1,885 | $1.64 | 21d | 1 | 0.45mi |
| 371 Keen Ter Unit A Sebastian, FL | 2.0 | 2.0 | 1037 | $1,650 | $1.59 | 21d | 1 | 0.49mi |
| 449 Del Monte Rd Unit A Sebastian, FL | 2.0 | 1.0 | 840 | $1,750 | $2.08 | 21d | 1 | 0.55mi |
| 950 Louisiana Ave Sebastian, FL | 2.0 | 1.5 | 990 | $1,550 | $1.57 | 21d | 1 | 0.93mi |
| 832 Carnation Dr Sebastian, FL | 3.0 | 2.0 | 1400 | $2,800 | $2.00 | 13d | 1 | 0.95mi |
| 586 Gerald St Sebastian, FL | 3.0 | 3.0 | 936 | $1,600 | $1.71 | 13d | 1 | 0.96mi |
| 834 Dolores St Sebastian, FL | 3.0 | 1.0 | 1253 | $1,600 | $1.28 | 13d | 1 | 1.13mi |
| 6124 River Run Dr Unit B Sebastian, FL | 2.0 | 2.0 | 1285 | $2,200 | $1.71 | 21d | 1 | 1.17mi |
| 741 Smith St Sebastian, FL | 2.0 | 1.5 | 891 | $1,900 | $2.13 | 21d | 1 | 1.19mi |
| 6240 E Mirror Lake Dr Unit 201 Sebastian, FL | 2.0 | 2.0 | 1150 | $1,750 | $1.52 | 21d | 1 | 1.38mi |
| 426 Tulip Dr Sebastian, FL | 2.0 | 2.0 | 1161 | $2,100 | $1.81 | 21d | 1 | 1.43mi |
Listing history 14 events
-
2026-06-02status $240,700 Pending 18 DOM
-
2026-06-01days on market $240,700 Active 18 DOM
-
2026-05-31days on market $240,700 Active 17 DOM
-
2026-05-30days on market $240,700 Active 16 DOM
-
2026-05-14$240,700 Active
-
2016-08-16historical 280-char remark
Show marketing remark (280 chars)
Cathedral Cedar ceilings in living room give this home a rustic look. Multiple sliders various rooms lead to nice pool area with extra deep lot. (191 ft. ) Jacuzzi jetted tub in master. Fenced yard with tons on room outside pool area. 3 bedrooms, 2 bath, 2 car garage. Great Deal!
-
2015-03-27$151,000
-
2013-09-21historical
-
2011-07-20$119,900 280-char remark
Show marketing remark (280 chars)
Cathedral Cedar ceilings in living room give this home a rustic look. Multiple sliders various rooms lead to nice pool area with extra deep lot. (191 ft. ) Jacuzzi jetted tub in master. Fenced yard with tons on room outside pool area. 3 bedrooms, 2 bath, 2 car garage. Great Deal!
-
2011-07-20$199,900
Show marketing remark (280 chars)
Cathedral Cedar ceilings in living room give this home a rustic look. Multiple sliders various rooms lead to nice pool area with extra deep lot. (191 ft. ) Jacuzzi jetted tub in master. Fenced yard with tons on room outside pool area. 3 bedrooms, 2 bath, 2 car garage. Great Deal!
-
2003-08-27soldstatus $120,000
-
2000-10-03soldstatus $92,500
-
1991-07-01soldstatus $89,000
-
1981-08-01soldstatus $8,300
ⓘ Source: listings_history table (triggers on properties + properties_extension) + one-shot
backfill from property_details.listing_events for pre-trigger history.
Tax reassessment forecast FL · Resets to sale price
- Current annual tax
- $1,436 · $120/mo
- Projected year-2 tax
- $1,998 · $166/mo
- Expected delta
- +$562/yr (+$47/mo · 39.1%)
ⓘ Screening estimate from a state-policy table — verify with the county assessor before closing.
Climate risk First Street
- Flood 1/10 Low FEMA zone X (unshaded) · 0% chance over 30 yrs
- Wildfire 2/10 Low
- Heat 10/10 Extreme 7 d/yr ≥105°F today · 24 d/yr by 30 yrs out
- Wind 10/10 Extreme 99% chance of damaging wind over 30 yrs
- Air quality 1/10 Low 0 unhealthy d/yr today · 0 by 30 yrs out
Nearby sold comps map
Loading sold comps map…
Walkable amenities ~0.75 mi
Loading nearby amenities…
Taxation est. · year 1
- Rental income
- $25,494
- − Mortgage interest
- −$13,483
- − Property taxes
- −$1,436
- − Insurance
- −$1,204
- − Repairs & maintenance
- −$2,040
- − Management
- −$2,040
- − Depreciation
- −$7,002
- Taxable loss
- −$1,709
- Est. tax savings @ 24.0%
- +$410
- After-tax cash flow
- $2,764/yr
For passive investors: Depreciation is non-cash, so a rental often shows a tax loss while cash-flowing — sheltering income. Rental losses are passive: they offset passive income freely, and up to $25,000/yr can offset ordinary (W-2) income if you actively participate and your MAGI is under $100k (phasing out to $0 by $150k); unused losses carry forward. On sale, claimed depreciation is recaptured at up to 25%, and gains may owe capital-gains tax (a 1031 exchange can defer both). Figures are a year-1 estimate at your 24.0% rate — not tax advice; consult a CPA.
Schools (NCES district)
- District
- Indian River
- NCES district ID
- 1200930
- Math proficiency
- 48% ▼ -9.00%
- Reading proficiency
- 52% ▼ -3.00%
- Median HH income
- $46,597
- Composite
- 42.45/100
- National rank
- #3218
- State rank
- #35 of 73 in FL
Livability — Sebastian
- Score
- 81/100
- State rank
- #89
- US rank
- #1421
Category grades
Schools grade is shown separately in the Schools card above.
Census & demographics
- Census place
- Sebastian, FL
- County
- Indian River County · 143,738 people
- City population
- 30,023
- Metro
- Sebastian-Vero Beach, FL
- Population (ZIP)
- 30,023
- Household income
- $66,840
- Rent vs Own
- Severe rent burden
- 646.0
Population outlook (Indian River County) Hauer SSP2
- Today (2025)
- 165,104 people
- By 2030
- 172,869 · +4.7%
- By 2040
- 185,640 · +12.4%
- By 2050
- 194,465 · +17.8%
- By 2075
- 211,115 · +27.9%
- By 2100
- 211,781 · +28.3%
Race, ethnicity, and origin ACS 2023
- Neighborhood character
- Predominantly White (86%)
- Race & ethnicity
- White 86% Hispanic / Latino 9% Two or more races 7% Black 2% Asian 1%
- Hispanic origin (detail)
- Mexican 1% Puerto Rican 2% Cuban 3%
- Common ancestry
- Lithuanian 4% Slovak 4% Romanian 3%
- Foreign-born
- 7% · Canada, Jamaica
- Languages at home
- 91% English-only · Spanish 6% Other Indo-European 1% Russian/Polish/Slavic 1%
Political lean MEDSL · Indian River
- 2024 margin
- Strong R (+27.4) · D 36.0% · R 63.4%
- 2008→2024 swing
- -12.5pp toward R · 2008: -14.8pp · 2024: -27.4pp
- All cycles
- 2024: R+27.4 2020: R+21.6 2016: R+24.5 2012: R+22.3 2008: R+14.8
Not yet ingested
- Civics
- —
Market trends
- HPI YoY
- ▼ -49.85%
- Current HPI
- 330.1691
- Rent YoY
- ▲ 6.22%
- Metro
- Sebastian-Vero Beach, FL
- State GDP YoY
- ▲ 3.28%
- F500 in state
- 36
Industry mix (Fortune 500 HQ in FL)
| Industry | F500 HQs | Revenue |
|---|---|---|
| Industrial Technology | 2 | $29B |
|
||
| Insurance | 2 | $17B |
|
||
| Retail | 1 | $60B |
|
||
| Technology Distribution | 1 | $58B |
|
||
| Homebuilding | 1 | $35B |
|
||
| Technology Manufacturing | 1 | $35B |
|
||
Price history
+2800.0% since first listed10 events — show timeline
- 2026-05-14 Listed $240,700 Stellar MLS as Distributed by MLS Grid
- 2016-08-16 Listing Removed — SCMLS
- 2015-03-27 Listed $151,000 RAIRCMLS
- 2013-09-21 Listing Removed — Beaches MLS
- 2011-07-20 Listed $199,900 Beaches MLS
- 2011-07-20 Listed $119,900 SCMLS
- 2003-08-27 Sold (Public Records) $120,000 Public Records
- 2000-10-03 Sold (Public Records) $92,500 Public Records
- 1991-07-01 Sold (Public Records) $89,000 Public Records
- 1981-08-01 Sold (Public Records) $8,300 Public Records
Property tax history
+8.5%/yrLatest (2025): $1,436 · +5.1% YoY. Source: county tax records.
Cash-flow waterfall
monthlySold comps — $/sqft
last 12 mo · ≤1 miLoading sold comps…