68 Barberry Ln · Raymond, NH
Flood risk No data
- FEMA flood zone
- —
- Chance of flooding over 30 yrs
- —
- Est. flood insurance / yr
- —
Fire risk No data
- Est. fire insurance / yr
- —
Heat risk No data
- Hot days now (above threshold)
- —
- Hot days in 30 yrs
- —
Wind risk No data
- Chance of severe wind over 30 yrs
- —
Air-quality risk No data
- Unhealthy air days now
- —
- Unhealthy air days in 30 yrs
- —
Risk factors via First Street. Map © Google.
Why this score? — see what drove the C- grade
The composite is a weighted blend of 9 inputs, each scored 0–100. Each bar is that input's sub-score; the figure is the points it added to the 100-point composite (weight × sub-score).
- Cash flow +20.7/30.0
- ARV discount +7.5/15.0
- DSCR +6.6/10.0
- 1% rule +4.8/10.0
- Livability +3.4/5.0
- Schools +3.2/10.0
- Rent growth +2.5/5.0
- Condition / age +2.5/5.0
- Appreciation +0.0/10.0
$190,000
🖨 Deal sheet 📄 Offer letter ✓ Due diligence
Listing remarks MLS
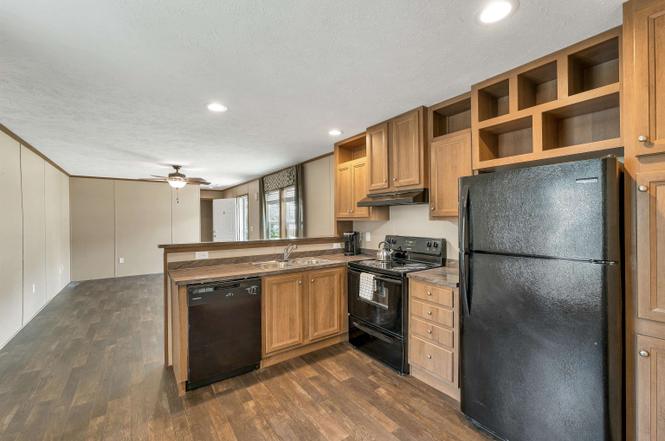
The Good Life begins at home in this 6 years young, beautiful manufactured home. Nothing to do but move in as this home is turnkey and located in Tranquility Estates Cooperative. This home Features 2 bedrooms, 2 baths and laundry facilities. The kitchen has plenty of cabinetry to hold all your pots, pans and collectibles. The innovative floor plan of this home offers more privacy with a bedroom at each end of the home. Just a short drive to shopping, dining and major roadways. Only 20 minutes to Manchester and 35 minutes to Portsmouth. A total of 2 dogs and 2 cats are allowed. Any dog with a history of aggressivebehavior or biting is prohibited. Co-op approval required. * * * Offers due by 6/18/2023 @ 5:00pm
Key facts
- Ample counter space
- Spacious kitchen
- Abundant cabinetry
Tags
Property features AI
Finance
- HOA & community: Community trash removal; Mobile park approval and co-op membership in Tranquility Estates
Exterior
- Parking: Paved driveway
- Utilities: Public water on site; Septic with leach field (shared); 100 amp electrical service with circuit breakers; LP (propane) gas; Fiber optic internet
- Home design: Manufactured / mobile home; Beige exterior; Entry facing information not provided
- Construction: Vinyl siding; Asphalt shingle roof; Built in 2017
- Exterior features: Leased, level lot; Paved driveway; Private paved road frontage
Interior
- Kitchen: Dishwasher; Electric range; Refrigerator
- Flooring: Carpet; Laminate
- Bathrooms: 2 full bathrooms
- Heating & cooling: Propane forced-air heating
- Interior features: 4 total rooms; Carpet and laminate flooring
- Laundry & utility: Electric water heater
Neighborhood map
What this means for you Summary
Snapshot
- This is a 2-bed/2.0-bath manufactured listed at $190k.
Deal economics
- At list price, monthly cash flow is $257 ($3k/yr) — positive.
- The deal already cash-flows at list — no discount required.
- To meet the 1% rule (rent ≥ 1% of price), the offer needs to be $187k (1.7% below list).
- Recommended offer: $187k (1.7% below list) — sets the bar for 1% rule.
- Cap rate 7.9% vs local median 2.1% in Raymond — top-decile yield for the area; either an underpriced asset or a hidden risk that comps aren't pricing in. Stress-test before assuming the spread holds.
Location & tenants
- Location reads 67/100 on livability (#63 in NH) — a middle-class / working-renter tenant base. Strengths: crime A+, housing A, health & safety A; Watch: amenities F, commute F.
- Raymond School District (suburban): math 27% / reading 45% proficiency, ranked #72 of 98 in NH (top 74%) — families likely to look elsewhere, expect single-tenant / working-renter base with shorter leases.
- Zoned schools: Lamprey River Elementary School (math 27% / reading 32%, grade F, #201 of 263 statewide, top 82%, 364 students, 20% FRL) — zoned schools at 20% FRL track the district average.
- Market conditions: 69 active listings in the ZIP; 1,276 units permitted in Rockingham County in 2024 (593 in 5+ unit buildings).
Forward outlook
- Local home prices are declining (-3.0%/yr); year-one equity from $1k of loan paydown is wiped out by about $6k of value loss. Plan a longer hold.
Negotiation context
- Only 1 days on market — expect competitive offers; lowballing is unlikely to land.
- 2 sale attempts since 8y ago; this cycle's ask is 74% above the opening price — seller raised mid-cycle; expect resistance to lowballs.
- Current owner paid $115k; list at $190k implies a 65% gain — meaningful room to come down on a strong offer.
Questions for the listing agent
- Is there a deadline driving the sale (1031 exchange, divorce, estate, relocation)? That informs how much negotiation room exists.
- What's the average days-on-market for RENTAL listings here right now (not sales)? A rising rental-DOM trend means longer vacancies and softer asking-rent achievability than the comps imply.
- What's the recent tenant-quality profile in this submarket — average credit score on applications, eviction rate, late-payment / NSF rate, and stable-employment percentage? A property-management company in the area should have these aggregated.
- How much new for-sale + rental construction is in the pipeline within 1–3 miles? Heavy new supply typically softens prices + rents 12–24 months out; constrained supply supports both.
Investment metrics
- 1% rule
- 0.98% ✗
- Cap rate
- 7.91%
- Cash-on-cash
- 5.79%
- DSCR
- 1.26
- GRM
- 8.5
CMA / ARV
- ARV (on-the-fly)
- $124,740
- Comps found
- 5
Show comp detail 5 sales within ~0.75 mi
| Address | Dist | Beds/Ba | Sqft | Sold | Price | $/sf | Match |
|---|---|---|---|---|---|---|---|
| 39 Old Cart Rd | 0.14mi | 2/1.0 | 924 (0%) | 10mo | $170,000 | $184 | 82 |
| 3 Pinewood Cv | 0.05mi | 2/1.0 | 964 (+4%) | 24mo | $130,000 | $135 | 66 |
| 25 Old Cart Rd | 0.14mi | 2/1.0 | 970 (+5%) | 22mo | $78,000 | $80 | 62 |
| 1 Old Cart Rd | 0.27mi | 3/1.0 (+1) | 879 (-5%) | 10mo | $74,500 | $85 | 62 |
| 102 Boxwood Ln | 0.05mi | 3/1.5 (+1) | 792 (-14%) | 11mo | $215,000 | $271 | 57 |
Match score weights: distance 35% · size 25% · config 20% · recency 20%. Top-matched comps best support the ARV.
Projected returns pro-forma
-3.0% appreciation · 3.0% rent growth · sell at horizon
- IRR
- -7.4%
- Equity multiple
- 0.73×
- Total profit
- $-14,462
- Equity at exit
- $28,330
- IRR
- 2.2%
- Equity multiple
- 1.16×
- Total profit
- $8,347
- Equity at exit
- $16,428
Cash invested: $53,200 (down + closing). Projections, not guarantees.
Landlord ↔ Tenant lean methodology
- Overall (STATE)
- 56 Moderately Landlord-Leaning
- State New Hampshire
- 56 Moderately Landlord-Leaning · D+1
- County
- — inherits STATE
- City
- — inherits STATE
ZIP-level market 03077
- Home prices YoY
- -30.0%
- Active inventory
- 69
- Price-to-rent
- 8.5×
Monthly cashflow live
- Estimated rent
- $1,867 medium interval (Pro) →
- Mortgage (P&I)
- −$996
- Tax from tax record
- −$143 /mo · $1,713/yr
- Insurance
- −$79
- HOA
- −$0
- Vacancy / Maint / Mgmt
- −$392
- Net cashflow
- $257
Break-even live
UW: 25.0% down · 7.5% · 30yr · 1.5% tax · 5.0% vac · 8.0% maint · 8.0% mgmt
Financing live
Cash to close
- Down payment
- $47,500
- Closing costs
- $5,700
- Reserves months
- —
- Total cash needed
- —
Loan-product check · same deal, 3 products live
Conventional
25% down · 7.5% · 30yr
- Down + closing
- —
- Monthly P&I
- —
- Monthly cashflow
- —
- DSCR
- —
- Eligible?
- —
Personal DTI + credit; lowest rate.
DSCR
20% down · 8.5% · 30yr
- Down + closing
- —
- Monthly P&I
- —
- Monthly cashflow
- —
- DSCR
- —
- Eligible?
- —
No personal income docs; deal must DSCR.
Hard money
10% down · 12.0% · 12mo
- Down + closing
- —
- Monthly P&I
- —
- Monthly cashflow
- —
- DSCR
- —
- Eligible?
- —
Short-term bridge; refi at stabilization.
Listing history 3 events
-
2026-06-17status $190,000 Active 1 DOM
-
2026-06-16remarks 693-char remark
-
2026-06-16$190,000 Coming Soon 1 DOM
ⓘ Source: listings_history table (triggers on properties + properties_extension) + one-shot
backfill from property_details.listing_events for pre-trigger history.
Tax reassessment forecast NH · Partial reset (capped growth)
- Current annual tax
- $1,713 · $143/mo
- Projected year-2 tax
- $2,928 · $244/mo
- Expected delta
- +$1,214/yr (+$101/mo · 70.9%)
ⓘ Screening estimate from a state-policy table — verify with the county assessor before closing.
Nearby sold comps map
Loading sold comps map…
Walkable amenities ~0.75 mi
Loading nearby amenities…
Taxation est. · year 1
- Rental income
- $22,407
- − Mortgage interest
- −$10,643
- − Property taxes
- −$1,713
- − Insurance
- −$950
- − Repairs & maintenance
- −$1,793
- − Management
- −$1,793
- − Depreciation
- −$5,527
- Taxable loss
- −$12
- Est. tax savings @ 24.0%
- +$3
- After-tax cash flow
- $3,085/yr
For passive investors: Depreciation is non-cash, so a rental often shows a tax loss while cash-flowing — sheltering income. Rental losses are passive: they offset passive income freely, and up to $25,000/yr can offset ordinary (W-2) income if you actively participate and your MAGI is under $100k (phasing out to $0 by $150k); unused losses carry forward. On sale, claimed depreciation is recaptured at up to 25%, and gains may owe capital-gains tax (a 1031 exchange can defer both). Figures are a year-1 estimate at your 24.0% rate — not tax advice; consult a CPA.
Schools (NCES district)
- District
- Raymond School District
- NCES district ID
- 3305880
- Math proficiency
- 27% ▼ -14.00%
- Reading proficiency
- 45% ▼ -5.00%
- Median HH income
- $63,500
- Composite
- 32.4/100
- National rank
- #5729
- State rank
- #72 of 98 in NH
Livability — Raymond
- Score
- 67/100
- State rank
- #63
- US rank
- #10832
Category grades
Schools grade is shown separately in the Schools card above.
Census & demographics
- Population (ZIP)
- 10,837
Population outlook (Rockingham County) Hauer SSP2
- Today (2025)
- 316,118 people
- By 2030
- 320,929 · +1.5%
- By 2040
- 323,358 · +2.3%
- By 2050
- 314,977 · -0.4%
- By 2075
- 297,686 · -5.8%
- By 2100
- 256,363 · -18.9%
Race, ethnicity, and origin ACS 2023
- Neighborhood character
- Predominantly White (85%)
- Race & ethnicity
- White 85% Two or more races 6% Hispanic / Latino 5% Black 4% Asian 1%
- Hispanic origin (detail)
- Mexican 1% Puerto Rican 2%
- Common ancestry
- Lithuanian 12% Romanian 6% Slovak 4%
- Foreign-born
- 5% · Canada
- Languages at home
- 93% English-only · French/Haitian/Cajun 3% Spanish 2% Other Indo-European 1%
Political lean MEDSL · Rockingham
- 2024 margin
- Toss-up / Even · D 48.3% · R 50.8%
- 2008→2024 swing
- -3.5pp toward R · 2008: 1.1pp · 2024: -2.4pp
- All cycles
- 2024: R+2.4 2020: D+2.1 2016: R+5.8 2012: R+4.5 2008: D+1.1
Not yet ingested
- Civics
- —
Market trends
- HPI YoY
- ▼ -129.11%
- Current HPI
- 301.4856
- Rent YoY
- —
- Metro
- —
- State GDP YoY
- —
- F500 in state
- 0
Price history
+141.1% since first listed8 events — show timeline
- 2026-06-15 Coming Soon $190,000 PrimeMLS
- 2023-07-14 Sold (MLS) $115,000 PrimeMLS
- 2023-06-19 Contingent — PrimeMLS
- 2023-06-16 Price Changed $109,900 PrimeMLS
- 2023-06-15 Listed $109,000 PrimeMLS
- 2018-06-21 Sold (MLS) $75,000 PrimeMLS
- 2018-06-01 Pending — PrimeMLS
- 2018-05-16 Listed $78,800 PrimeMLS
Property tax history
+17.6%/yrLatest (2024): $1,713 · +5.7% YoY. Source: county tax records.
Cash-flow waterfall
monthlySold comps — $/sqft
last 12 mo · ≤1 miLoading sold comps…