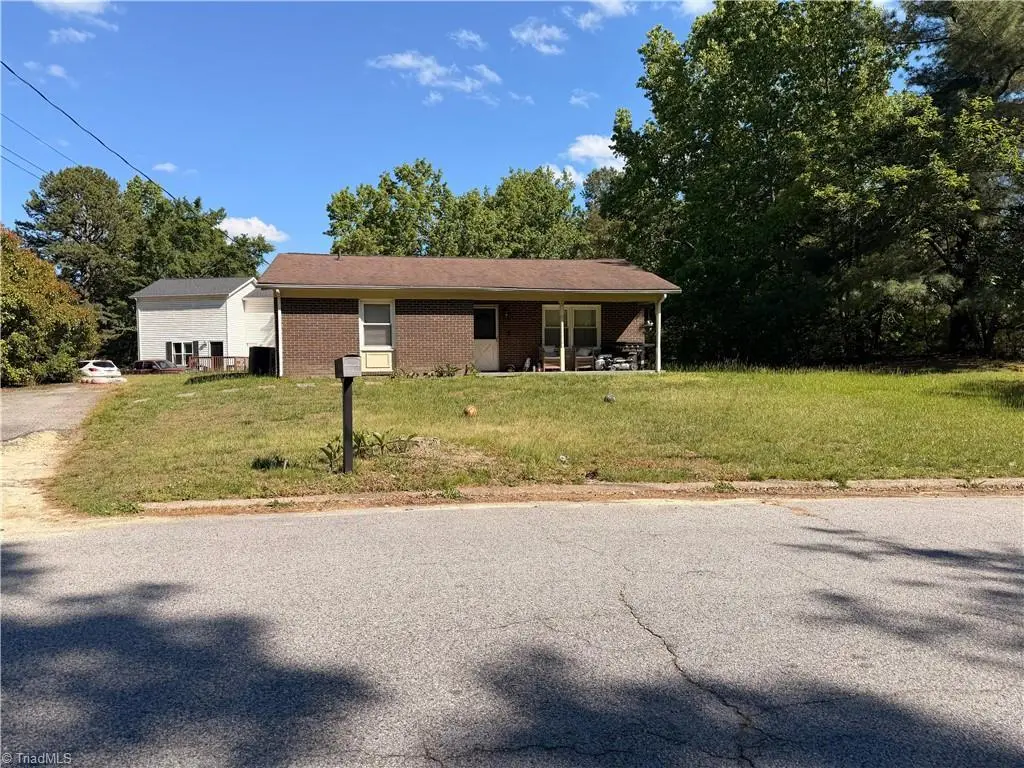
504 Lynn Dr · Thomasville, NC
Flood risk 1/10 · Minimal
- FEMA flood zone
- X (unshaded)
- Chance of flooding over 30 yrs
- 0.0%
- Est. flood insurance / yr
- $507 – $1,088
Fire risk 2/10 · Minimal
- Est. fire insurance / yr
- $906 – $1,684
Heat risk 5/10 · Moderate
- Hot days now (above 103°F)
- 7 days/yr
- Hot days in 30 yrs
- 17 days/yr
Wind risk 4/10 · Minor
- Chance of severe wind over 30 yrs
- 14.0%
Air-quality risk 2/10 · Minimal
- Unhealthy air days now
- 1 days/yr
- Unhealthy air days in 30 yrs
- 1 days/yr
Risk factors via First Street. Map © Google.
Why this score? — see what drove the C- grade
The composite is a weighted blend of 9 inputs, each scored 0–100. Each bar is that input's sub-score; the figure is the points it added to the 100-point composite (weight × sub-score).
- Cash flow +17.0/30.0
- ARV discount +15.0/15.0
- DSCR +5.3/10.0
- Livability +4.0/5.0
- 1% rule +3.6/10.0
- Rent growth +3.6/5.0
- Condition / age +2.5/5.0
- Schools +2.0/10.0
- Appreciation +0.0/10.0
$145,990
🖨 Deal sheet 📄 Offer letter ✓ Due diligence
Listing remarks
The property at 504 Lynn Dr, Thomasville, NC 27360 is a classic brick single-family home, featuring 3 bedrooms, 1 bathroom, and 1,040 square feet of interior living space. Originally built in 1970, this charming residence sits on a spacious 12,196-square-foot lot. Property Specifications Interior Space: 1,040 sq. ft. of single-level living area. Layout: 3 spacious bedrooms and 1 full bathroom. Exterior: Durable, low-maintenance brick construction with a standard footing foundation. Lot Size: Generous 0.28-acre (12,196 sq. ft. ) clear parcel. HVAC Systems: Equipped with central air conditioning and an efficient electric heat pump system. Flooring: A mix of carpet, linoleum, vinyl, and alter
Key facts
- 0.28 acre lot
- Built 1970
- Listed 14 days
Property features AI
Finance
- HOA & community: No homeowners association; Subdivision: Pineywood Estates
Exterior
- Parking: Driveway; Gravel parking; On-street parking
- Utilities: Public water; Public sewer; Electric water heater; Electric heating fuel; Electric power for heat pump
- Home design: Residential stick/site-built house; One story; Built in 1970; Existing structure
- Construction: Vinyl siding; Slab foundation
- Exterior features: Corner lot; Near public transit / public transportation nearby; No fencing; No pool; Public maintained road
Interior
- Kitchen: Microwave; Convection oven; Cooktop; Electric water heater
- Bedrooms: 1 living area (Main level)
- Flooring: Carpet; Concrete
- Bathrooms: 1 full bathroom
- Heating & cooling: Heat pump heating (electric); Central air conditioning
- Interior features: Primary bedroom on the main level; Attic access only
Neighborhood map
What this means for you Summary
Snapshot
- This is a 2-bed/1.0-bath single-family listed at $146k.
Deal economics
- At list price, monthly cash flow is $99 ($1k/yr) — positive.
- The deal already cash-flows at list — no discount required.
- To meet the 1% rule (rent ≥ 1% of price), the offer needs to be $126k (13.9% below list).
- Recommended offer: $126k (13.9% below list) — sets the bar for 1% rule.
- Cap rate 7.1% vs local median 3.1% in Thomasville — top-decile yield for the area; either an underpriced asset or a hidden risk that comps aren't pricing in. Stress-test before assuming the spread holds.
Location & tenants
- Location reads 81/100 on livability (#16 in NC, #1,454 nationally) — a professional / high-income tenant draw. Strengths: commute A+, cost of living A+, housing A+; Watch: crime D+, employment F.
- Thomasville City Schools (suburban): math 24% / reading 25% proficiency, ranked #164 of 178 in NC (top 92%) — low school quality limits family demand, transient renter base, plan for 1-2y turnover; 82% free/reduced lunch — lower-income household profile, screen leases tightly.
- Zoned schools: Liberty Drive Elementary (math 15% / reading 24%, grade F, #1,242 of 1,410 statewide, top 90%, 357 students, 99% FRL); Thomasville Middle (math 21% / reading 25%, grade F, #406 of 475 statewide, top 86%, 494 students, 99% FRL); Thomasville High (math 42% / reading 32%, grade F, #414 of 535 statewide, top 79%, 634 students, 98% FRL) — zoned schools average 99% FRL vs 82% district-wide (17 pts higher); higher-poverty schools than district average — tighter screening recommended.
- Market conditions: Rents rising fast (+4.3%/yr); 307 active listings in the ZIP; 6 comparable units currently listed for rent nearby; rentals at typical pace (median 23d on market — plan ~3-4 weeks tenant-placement turnaround); 990 units permitted in Davidson County in 2024 (54 in 5+ unit buildings).
Forward outlook
- Local home prices are declining (-3.0%/yr); year-one equity from $1k of loan paydown is wiped out by about $4k of value loss. Plan a longer hold.
- Davidson County population projected to shrink 6% by 2050 — rents likely to lag national; underwrite the cash flow, not the appreciation.
Negotiation context
- Only 14 days on market — expect competitive offers; lowballing is unlikely to land.
- Current owner paid $19k; list at $146k implies a 668% gain — meaningful room to come down on a strong offer.
Risks & watch-outs
- Climate carrying-cost: extreme-heat days projected 7→17/yr by 2055 (HVAC capex compounding) — expect insurance premiums to compound above CPI over the hold.
Questions for the listing agent
- Built in 1970 — when were the roof, HVAC, electrical panel, plumbing, and water heater last replaced?
- Is there a deadline driving the sale (1031 exchange, divorce, estate, relocation)? That informs how much negotiation room exists.
- Schools are F-rated, which usually means shorter tenancies and higher turnover. Who's the typical renter profile here, and what's been the actual vacancy rate?
- Crime grade is D in this area — have there been break-ins, vandalism, or insurance claims at this property in the last 3 years? What carrier currently insures it and at what premium?
- What's the average days-on-market for RENTAL listings here right now (not sales)? A rising rental-DOM trend means longer vacancies and softer asking-rent achievability than the comps imply.
- What's the recent tenant-quality profile in this submarket — average credit score on applications, eviction rate, late-payment / NSF rate, and stable-employment percentage? A property-management company in the area should have these aggregated.
- How much new for-sale + rental construction is in the pipeline within 1–3 miles? Heavy new supply typically softens prices + rents 12–24 months out; constrained supply supports both.
Investment metrics
- 1% rule
- 0.86% ✗
- Cap rate
- 7.10%
- Cash-on-cash
- 2.90%
- DSCR
- 1.13
- GRM
- 9.7
CMA / ARV
- ARV (on-the-fly)
- $212,160
- Comps found
- 10
Show comp detail 10 sales within ~0.75 mi
| Address | Dist | Beds/Ba | Sqft | Sold | Price | $/sf | Match |
|---|---|---|---|---|---|---|---|
| 1105 Sunset Dr | 0.20mi | 3/2.0 (+1) | 1,126 (+8%) | 4mo | $243,000 | $216 | 65 |
| 1101 Sunset Dr | 0.18mi | 3/2.0 (+1) | 1,120 (+8%) | 10mo | $245,000 | $219 | 61 |
| 1103 Sunset Dr | 0.20mi | 3/2.0 (+1) | 1,120 (+8%) | 10mo | $242,000 | $216 | 60 |
| 513 Lincoln St | 0.26mi | 3/2.0 (+1) | 1,080 (+4%) | 15mo | $220,000 | $204 | 60 |
| 807 Mary James Ave | 0.26mi | 3/1.0 (+1) | 1,165 (+12%) | 5mo | $105,000 | $90 | 58 |
| 111 Miller St | 0.68mi | 2/1.5 | 1,097 (+6%) | 1mo | $150,000 | $137 | 56 |
| 135 Pineywood St | 0.71mi | 3/1.5 (+1) | 1,014 (-2%) | 3mo | $223,000 | $220 | 53 |
| 119 Pineywood St | 0.57mi | 3/1.5 (+1) | 1,100 (+6%) | 9mo | $200,000 | $182 | 49 |
| 420 Barnwell St | 0.47mi | 3/1.0 (+1) | 960 (-8%) | 19mo | $137,400 | $143 | 44 |
| 423 Barnwell St | 0.50mi | 3/1.0 (+1) | 1,176 (+13%) | 11mo | $188,000 | $160 | 41 |
Match score weights: distance 35% · size 25% · config 20% · recency 20%. Top-matched comps best support the ARV.
Projected returns pro-forma
-3.0% appreciation · 4.34% rent growth · sell at horizon
- IRR
- -10.4%
- Equity multiple
- 0.62×
- Total profit
- $-15,709
- Equity at exit
- $21,768
- IRR
- 0.5%
- Equity multiple
- 1.04×
- Total profit
- $1,444
- Equity at exit
- $12,623
Cash invested: $40,877 (down + closing). Projections, not guarantees.
Landlord ↔ Tenant lean methodology
- Overall (STATE)
- 85 Strongly Landlord-Friendly
- State North Carolina
- 85 Strongly Landlord-Friendly · R+3
- County
- — inherits STATE
- City
- — inherits STATE
ZIP-level market 27360
- Rents YoY
- 4.3%
- Active inventory
- 307
- Price-to-rent
- 9.7×
Monthly cashflow live
- Estimated rent
- $1,257 high interval (Pro) →
- Mortgage (P&I)
- −$766
- Tax from tax record
- −$68 /mo · $818/yr
- Insurance
- −$61
- HOA
- −$0
- Vacancy / Maint / Mgmt
- −$264
- Net cashflow
- $99
Break-even live
UW: 25.0% down · 7.5% · 30yr · 1.5% tax · 5.0% vac · 8.0% maint · 8.0% mgmt
Financing live
Cash to close
- Down payment
- $36,498
- Closing costs
- $4,380
- Reserves months
- —
- Total cash needed
- —
Loan-product check · same deal, 3 products live
Conventional
25% down · 7.5% · 30yr
- Down + closing
- —
- Monthly P&I
- —
- Monthly cashflow
- —
- DSCR
- —
- Eligible?
- —
Personal DTI + credit; lowest rate.
DSCR
20% down · 8.5% · 30yr
- Down + closing
- —
- Monthly P&I
- —
- Monthly cashflow
- —
- DSCR
- —
- Eligible?
- —
No personal income docs; deal must DSCR.
Hard money
10% down · 12.0% · 12mo
- Down + closing
- —
- Monthly P&I
- —
- Monthly cashflow
- —
- DSCR
- —
- Eligible?
- —
Short-term bridge; refi at stabilization.
Rent comps 6 comps
| Address | Beds | Baths | Sqft | Rent | $/sqft | DOM | Units | Dist |
|---|---|---|---|---|---|---|---|---|
| 200 Charles St Thomasville, NC | 3.0 | 2.0 | 1040 | $1,600 | $1.54 | 14d | 1 | 0.57mi |
| 202 Charles St Thomasville, NC | 3.0 | 2.0 | 990 | $1,500 | $1.52 | 14d | 1 | 0.59mi |
| 722 Salem St Thomasville, NC | 2.0–3.0 | 2.0 | 1037 | $900 | $0.87 | 14d | 1 | 0.87mi |
| 199 Sheppard St Unit N Thomasville, NC | 3.0 | 2.0 | 864 | $995 | $1.15 | 23d | 1 | 1.23mi |
| 301 Culbreth Ave Thomasville, NC | 2.0 | 1.0 | 750 | $895 | $1.19 | 23d | 1 | 1.35mi |
| 406 Fisher Ferry St Thomasville, NC | 2.0 | 2.0 | 1144 | $1,450 | $1.27 | 23d | 1 | 1.42mi |
Listing history 6 events
-
2026-06-02status $145,990 Pending 14 DOM
-
2026-06-01days on market $145,990 Active 14 DOM
-
2026-05-31days on market $145,990 Active 13 DOM
-
2026-05-31days on market $145,990 Active 12 DOM
-
2026-05-18$145,990 Active
-
1974-03-01soldstatus $19,000
ⓘ Source: listings_history table (triggers on properties + properties_extension) + one-shot
backfill from property_details.listing_events for pre-trigger history.
Tax reassessment forecast NC · Resets to sale price
- Current annual tax
- $818 · $68/mo
- Projected year-2 tax
- $1,197 · $100/mo
- Expected delta
- +$379/yr (+$32/mo · 46.3%)
ⓘ Screening estimate from a state-policy table — verify with the county assessor before closing.
Climate risk First Street
- Flood 1/10 Low FEMA zone X (unshaded) · 0% chance over 30 yrs
- Wildfire 2/10 Low
- Heat 5/10 Major 7 d/yr ≥103°F today · 17 d/yr by 30 yrs out
- Wind 4/10 Moderate 14% chance of damaging wind over 30 yrs
- Air quality 2/10 Low 1 unhealthy d/yr today · 1 by 30 yrs out
Nearby sold comps map
Loading sold comps map…
Walkable amenities ~0.75 mi
Loading nearby amenities…
Taxation est. · year 1
- Rental income
- $15,087
- − Mortgage interest
- −$8,178
- − Property taxes
- −$818
- − Insurance
- −$730
- − Repairs & maintenance
- −$1,207
- − Management
- −$1,207
- − Depreciation
- −$4,247
- Taxable loss
- −$1,300
- Est. tax savings @ 24.0%
- +$312
- After-tax cash flow
- $1,495/yr
For passive investors: Depreciation is non-cash, so a rental often shows a tax loss while cash-flowing — sheltering income. Rental losses are passive: they offset passive income freely, and up to $25,000/yr can offset ordinary (W-2) income if you actively participate and your MAGI is under $100k (phasing out to $0 by $150k); unused losses carry forward. On sale, claimed depreciation is recaptured at up to 25%, and gains may owe capital-gains tax (a 1031 exchange can defer both). Figures are a year-1 estimate at your 24.0% rate — not tax advice; consult a CPA.
Schools (NCES district)
- District
- Thomasville City Schools
- NCES district ID
- 3704500
- Math proficiency
- 24% ▲ 1.00%
- Reading proficiency
- 25% ▲ 2.00%
- Median HH income
- $29,831
- Composite
- 19.72/100
- National rank
- #8717
- State rank
- #164 of 178 in NC
Livability — Thomasville
- Score
- 81/100
- State rank
- #16
- US rank
- #1454
Category grades
Schools grade is shown separately in the Schools card above.
Census & demographics
- Census place
- Thomasville, NC
- County
- Davidson County · 129,088 people
- City population
- 49,510
- Metro
- Winston-Salem, NC
- Population (ZIP)
- 49,510
- Household income
- $61,983
- Rent vs Own
- Severe rent burden
- 1052.0
Population outlook (Davidson County) Hauer SSP2
- Today (2025)
- 167,156 people
- By 2030
- 167,216 · +0.0%
- By 2040
- 164,524 · -1.6%
- By 2050
- 157,229 · -5.9%
- By 2075
- 138,084 · -17.4%
- By 2100
- 112,729 · -32.6%
Race, ethnicity, and origin ACS 2023
- Neighborhood character
- Predominantly White (71%)
- Race & ethnicity
- White 71% Hispanic / Latino 11% Black 11% Two or more races 11%
- Hispanic origin (detail)
- Mexican 7%
- Common ancestry
- Slovak 2% Serbian 1% Italian 1%
- Foreign-born
- 7% · Canada
- Languages at home
- 88% English-only · Spanish 10% Other Indo-European 1%
Political lean MEDSL · Davidson
- 2024 margin
- Solid R (+47.1) · D 25.9% · R 73.0% · Other 1.1%
- 2008→2024 swing
- -13.5pp toward R · 2008: -33.5pp · 2024: -47.1pp
- All cycles
- 2024: R+47.1 2020: R+47.5 2016: R+49.4 2012: R+40.9 2008: R+33.5
Not yet ingested
- Civics
- —
Market trends
- HPI YoY
- ▼ -146.33%
- Current HPI
- 243.0953
- Rent YoY
- ▲ 4.34%
- Metro
- Winston-Salem, NC
- State GDP YoY
- ▲ 3.28%
- F500 in state
- 26
Industry mix (Fortune 500 HQ in NC)
| Industry | F500 HQs | Revenue |
|---|---|---|
| Financial Services | 2 | $213B |
|
||
| Retail | 2 | $95B |
|
||
| Industrial Conglomerate | 1 | $38B |
|
||
| Metals / Steel | 1 | $35B |
|
||
| Utilities | 1 | $30B |
|
||
| Industrial Machinery | 1 | $19B |
|
||
Price history
+668.4% since first listed2 events — show timeline
- 2026-05-18 Listed $145,990 Triad MLS
- 1974-03-01 Sold (Public Records) $19,000 Public Records
Property tax history
+0.5%/yrLatest (2025): $818 · +0.0% YoY. Source: county tax records.
Cash-flow waterfall
monthlySold comps — $/sqft
last 12 mo · ≤1 miLoading sold comps…