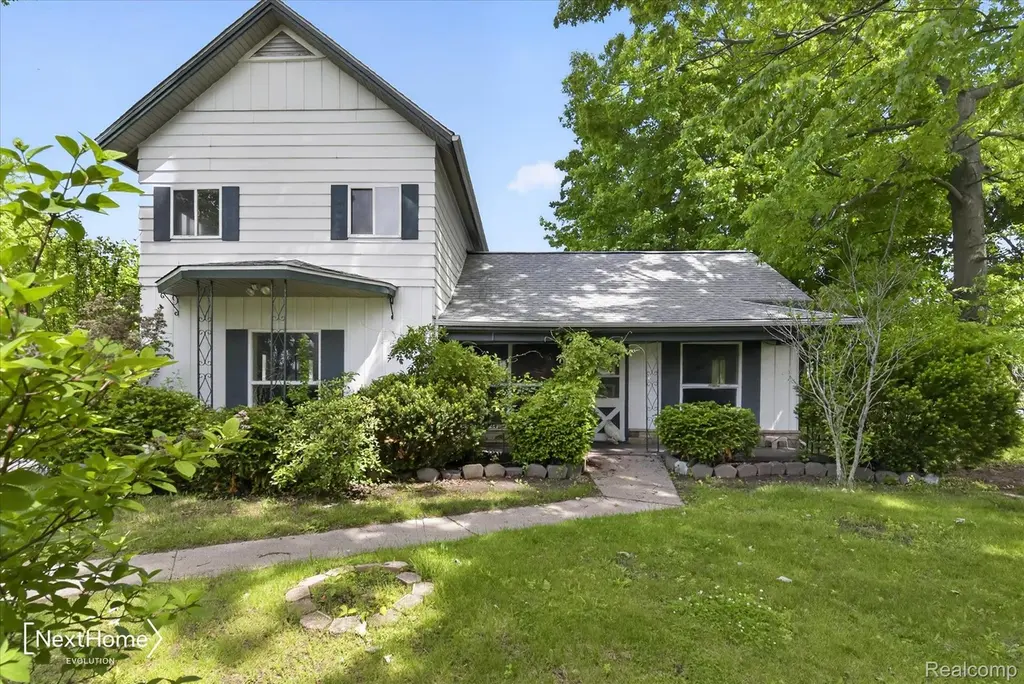
783 E Huron River Dr · Belleville, MI
Flood risk 4/10 · Minor
- FEMA flood zone
- X (unshaded)
- Chance of flooding over 30 yrs
- 0.23%
- Est. flood insurance / yr
- $507 – $1,088
Fire risk 3/10 · Minor
- Est. fire insurance / yr
- $784 – $1,456
Heat risk 3/10 · Minor
- Hot days now (above 98°F)
- 7 days/yr
- Hot days in 30 yrs
- 15 days/yr
Wind risk 2/10 · Minimal
- Chance of severe wind over 30 yrs
- —
Air-quality risk 2/10 · Minimal
- Unhealthy air days now
- 1 days/yr
- Unhealthy air days in 30 yrs
- 2 days/yr
Risk factors via First Street. Map © Google.
Why this score? — see what drove the B- grade
The composite is a weighted blend of 9 inputs, each scored 0–100. Each bar is that input's sub-score; the figure is the points it added to the 100-point composite (weight × sub-score).
- Cash flow +28.8/30.0
- DSCR +10.0/10.0
- 1% rule +8.2/10.0
- ARV discount +7.5/15.0
- Livability +3.8/5.0
- Rent growth +3.4/5.0
- Schools +3.3/10.0
- Condition / age +2.5/5.0
- Appreciation +0.0/10.0
$140,000
🖨 Deal sheet 📄 Offer letter ✓ Due diligence
Listing remarks MLS
Opportunity awaits just outside the city limits of Belleville. This spacious 4-bedroom, 2-bath home offers a flexible layout, a generous lot, and plenty of room to bring your vision to life. Ready for its next chapter, this property is a great option for an investor, contractor, or buyer looking for a renovation project with upside. The large barn adds even more value with a workshop area, additional bathroom, and flexible space for storage, hobbies, projects, or future use. Conveniently located near town, major roads, and everyday amenities. Sold as-is. Buyer to verify all information.
Key facts
- Generous lot
- Workshop area
- Large barn
Tags
Property features AI
Finance
- Other: Property listed as residential, single family
- Financial info: No additional financial details provided
- HOA & community: No HOA information provided
Exterior
- Parking: Detached oversized garage with workshop; Approximately 3.5 garage spaces
- Security: No specific security features provided
- Utilities: Public water; Public sewer; Cable available
- Home design: Single-family residence; One and one-half story; Ground-level entry with steps; Aluminum siding
- Construction: Asphalt roof; Slab foundation; Built with aluminum siding
- Exterior features: Covered porch; Fenced yard; Paved road access
Interior
- Kitchen: No kitchen details provided
- Bedrooms: No bedroom details provided
- Flooring: No flooring details provided
- Bathrooms: 2 full bathrooms
- Heating & cooling: Has heating; Baseboard heating; Radiant heating; Natural gas heating; No central cooling
- Interior features: Gas water heater; Double-sided gas fireplace in the living room; Crawl space basement; 8 total rooms
- Laundry & utility: Dedicated laundry room
Neighborhood map
What this means for you Summary
Snapshot
- This is a 4-bed/2.0-bath single-family listed at $140k.
Deal economics
- At list price, monthly cash flow is $470 ($6k/yr) — positive.
- The deal already cash-flows at list — no discount required.
- Meets the 1% rule at list price ($2k rent vs $140k).
- Cap rate 10.3% vs local median 3.4% in Belleville — top-decile yield for the area; either an underpriced asset or a hidden risk that comps aren't pricing in. Stress-test before assuming the spread holds.
Location & tenants
- Location reads 75/100 on livability (#164 in MI, #4,360 nationally) — a middle-class / working-renter tenant base. Strengths: cost of living A+, housing A+, health & safety A+; Watch: schools D, employment D, amenities F.
- Van Buren Public Schools (suburban): math 33% / reading 43% proficiency, ranked #228 of 540 in MI (top 42%) — families likely to look elsewhere, expect single-tenant / working-renter base with shorter leases.
- Market conditions: Rents rising (+3.6%/yr); 216 active listings in the ZIP; 2 comparable units currently listed for rent nearby; solid renter incomes; 2,639 units permitted in Wayne County in 2024 (1,216 in 5+ unit buildings).
Forward outlook
- Local home prices are declining (-3.0%/yr); year-one equity from $968 of loan paydown is wiped out by about $4k of value loss. Plan a longer hold.
- Wayne County population projected at -17% by 2050 — secular population decline; favor cash flow + early exit over multi-decade hold.
- At projected returns (-3.0% appreciation + 3.6% rent growth), your $39k cash investment doubles in ~8 years — after that, you're playing with house money.
Negotiation context
- Only 6 days on market — expect competitive offers; lowballing is unlikely to land.
- 3 sale attempts since 17y ago with the ask held roughly flat each time — persistent listings suggest the price (not the market) is what's stuck; bring a comps-based counter.
- Current owner paid $100k; 40% above their basis — modest negotiation headroom, anchor on the comps not their cost.
Risks & watch-outs
- Watch-outs: built in 1929 — expect roof / HVAC / electrical / plumbing capex.
Questions for the listing agent
- Built in 1929 — when were the roof, HVAC, electrical panel, plumbing, and water heater last replaced?
- Is there a deadline driving the sale (1031 exchange, divorce, estate, relocation)? That informs how much negotiation room exists.
- Schools are D-rated, which usually means shorter tenancies and higher turnover. Who's the typical renter profile here, and what's been the actual vacancy rate?
- What's the average days-on-market for RENTAL listings here right now (not sales)? A rising rental-DOM trend means longer vacancies and softer asking-rent achievability than the comps imply.
- What's the recent tenant-quality profile in this submarket — average credit score on applications, eviction rate, late-payment / NSF rate, and stable-employment percentage? A property-management company in the area should have these aggregated.
- How much new for-sale + rental construction is in the pipeline within 1–3 miles? Heavy new supply typically softens prices + rents 12–24 months out; constrained supply supports both.
Investment metrics
- 1% rule
- 1.32% ✓
- Cap rate
- 10.32%
- Cash-on-cash
- 14.39%
- DSCR
- 1.64
- GRM
- 6.3
CMA / ARV
- ARV (on-the-fly)
- $286,400
- Comps found
- 11
Show comp detail 11 sales within ~0.75 mi
| Address | Dist | Beds/Ba | Sqft | Sold | Price | $/sf | Match |
|---|---|---|---|---|---|---|---|
| 684 Greylock St | 0.22mi | 3/1.0 (-1) | 1,507 (-6%) | 1mo | $228,250 | $151 | 70 |
| 1140 E Huron River Dr | 0.35mi | 3/2.0 (-1) | 1,608 (+0%) | 12mo | $320,000 | $199 | 68 |
| 60 S Biggs St | 0.24mi | 3/2.0 (-1) | 1,365 (-15%) | 0mo | $340,000 | $249 | 59 |
| 26020 Martinsville Rd | 0.72mi | 3/2.0 (-1) | 1,602 (+0%) | 3mo | $350,000 | $218 | 59 |
| 137 Madelon St | 0.50mi | 4/1.5 | 1,600 (0%) | 20mo | $315,000 | $197 | 58 |
| 127 Madelon St | 0.50mi | 3/2.5 (-1) | 1,718 (+7%) | 4mo | $300,000 | $175 | 54 |
| 11519 Fisher Rd | 0.52mi | 3/1.5 (-1) | 1,584 (-1%) | 20mo | $278,000 | $176 | 50 |
| 133 Angola St | 0.56mi | 4/1.5 | 1,444 (-10%) | 8mo | $255,000 | $177 | 49 |
| 13337 N Cumberland Dr | 0.59mi | 3/2.5 (-1) | 1,735 (+8%) | 7mo | $310,000 | $179 | 45 |
| 138 Clarence St | 0.37mi | 3/2.0 (-1) | 1,376 (-14%) | 16mo | $275,000 | $200 | 41 |
| 208 E Huron River Dr | 0.57mi | 3/1.5 (-1) | 1,385 (-13%) | 14mo | $215,000 | $155 | 32 |
Match score weights: distance 35% · size 25% · config 20% · recency 20%. Top-matched comps best support the ARV.
Projected returns pro-forma
-3.0% appreciation · 3.64% rent growth · sell at horizon
- IRR
- 5.5%
- Equity multiple
- 1.22×
- Total profit
- $8,491
- Equity at exit
- $20,874
- IRR
- 15.5%
- Equity multiple
- 2.30×
- Total profit
- $51,068
- Equity at exit
- $12,105
Cash invested: $39,200 (down + closing). Projections, not guarantees.
Landlord ↔ Tenant lean methodology
- Overall (STATE)
- 62 Landlord-Friendly
- State Michigan
- 62 Landlord-Friendly · EVEN
- County
- — inherits STATE
- City
- — inherits STATE
ZIP-level market 48111
- Rents YoY
- 3.6%
- Active inventory
- 216
- Price-to-rent
- 6.3×
Monthly cashflow live
- Estimated rent
- $1,841 medium interval (Pro) →
- Mortgage (P&I)
- −$734
- Tax from tax record
- −$192 /mo · $2,301/yr
- Insurance
- −$58
- HOA
- −$0
- Vacancy / Maint / Mgmt
- −$387
- Net cashflow
- $470
Break-even live
UW: 25.0% down · 7.5% · 30yr · 1.5% tax · 5.0% vac · 8.0% maint · 8.0% mgmt
Financing live
Cash to close
- Down payment
- $35,000
- Closing costs
- $4,200
- Reserves months
- —
- Total cash needed
- —
Loan-product check · same deal, 3 products live
Conventional
25% down · 7.5% · 30yr
- Down + closing
- —
- Monthly P&I
- —
- Monthly cashflow
- —
- DSCR
- —
- Eligible?
- —
Personal DTI + credit; lowest rate.
DSCR
20% down · 8.5% · 30yr
- Down + closing
- —
- Monthly P&I
- —
- Monthly cashflow
- —
- DSCR
- —
- Eligible?
- —
No personal income docs; deal must DSCR.
Hard money
10% down · 12.0% · 12mo
- Down + closing
- —
- Monthly P&I
- —
- Monthly cashflow
- —
- DSCR
- —
- Eligible?
- —
Short-term bridge; refi at stabilization.
Rent comps 2 comps
| Address | Beds | Baths | Sqft | Rent | $/sqft | DOM | Units | Dist |
|---|---|---|---|---|---|---|---|---|
| 956 Sumpter Rd Van Buren Twp, MI | 2.0–3.0 | 1.0–2.0 | 1232 | $1,599 | $1.30 | 1d | 1 | 1.14mi |
| 955 Sumpter Rd Belleville, MI | 4.0 | 2.0 | 1440 | $1,649 | $1.15 | 1d | 1 | 1.27mi |
Listing history 6 events
-
2026-06-07status $140,000 Pending 6 DOM
-
2026-06-04days on market $140,000 Active 6 DOM
-
2026-06-03days on market $140,000 Active 5 DOM
-
2026-06-02days on market $140,000 Active 4 DOM
-
2026-06-01days on market $140,000 Active 3 DOM
-
2026-05-31days on market $140,000 Active 2 DOM
ⓘ Source: listings_history table (triggers on properties + properties_extension) + one-shot
backfill from property_details.listing_events for pre-trigger history.
Tax reassessment forecast MI · Partial reset (capped growth)
- Current annual tax
- $2,301 · $192/mo
- Projected year-2 tax
- $2,301 · $192/mo
- Expected delta
- $0/yr ($0/mo · 0.0%)
ⓘ Screening estimate from a state-policy table — verify with the county assessor before closing.
Climate risk First Street
- Flood 4/10 Moderate FEMA zone X (unshaded) · 23% chance over 30 yrs
- Wildfire 3/10 Moderate
- Heat 3/10 Moderate 7 d/yr ≥98°F today · 15 d/yr by 30 yrs out
- Wind 2/10 Low
- Air quality 2/10 Low 1 unhealthy d/yr today · 2 by 30 yrs out
Nearby sold comps map
Loading sold comps map…
Walkable amenities ~0.75 mi
Loading nearby amenities…
Taxation est. · year 1
- Rental income
- $22,093
- − Mortgage interest
- −$7,842
- − Property taxes
- −$2,301
- − Insurance
- −$700
- − Repairs & maintenance
- −$1,767
- − Management
- −$1,767
- − Depreciation
- −$4,073
- Taxable income
- $3,642
- Est. tax owed @ 24.0%
- −$874
- After-tax cash flow
- $4,768/yr
For passive investors: Depreciation is non-cash, so a rental often shows a tax loss while cash-flowing — sheltering income. Rental losses are passive: they offset passive income freely, and up to $25,000/yr can offset ordinary (W-2) income if you actively participate and your MAGI is under $100k (phasing out to $0 by $150k); unused losses carry forward. On sale, claimed depreciation is recaptured at up to 25%, and gains may owe capital-gains tax (a 1031 exchange can defer both). Figures are a year-1 estimate at your 24.0% rate — not tax advice; consult a CPA.
Schools (NCES district)
- District
- Van Buren Public Schools
- NCES district ID
- 2634560
- Math proficiency
- 33% ▲ 6.00%
- Reading proficiency
- 43% ▲ 6.00%
- Median HH income
- $54,166
- Composite
- 33.2/100
- National rank
- #5533
- State rank
- #228 of 540 in MI
Livability — Belleville
- Score
- 75/100
- State rank
- #164
- US rank
- #4360
Category grades
Schools grade is shown separately in the Schools card above.
Census & demographics
- Census place
- Belleville, MI
- County
- Wayne County · 1,562,939 people
- City population
- 44,709
- Metro
- Detroit-Warren-Dearborn, MI
- Population (ZIP)
- 44,709
- Household income
- $76,595
- Rent vs Own
- Severe rent burden
- 1200.0
Population outlook (Wayne County) Hauer SSP2
- Today (2025)
- 1,675,273 people
- By 2030
- 1,620,300 · -3.3%
- By 2040
- 1,502,341 · -10.3%
- By 2050
- 1,384,039 · -17.4%
- By 2075
- 1,124,592 · -32.9%
- By 2100
- 881,193 · -47.4%
Race, ethnicity, and origin ACS 2023
- Neighborhood character
- Predominantly White (66%)
- Race & ethnicity
- White 66% Black 22% Two or more races 7% Hispanic / Latino 4% Asian 2%
- Common ancestry
- Romanian 8% Lithuanian 3% Slovak 3%
- Foreign-born
- 4% · Canada
- Languages at home
- 95% English-only · Spanish 1% Other Indo-European 1% Arabic 1%
Political lean MEDSL · Wayne
- 2024 margin
- Strong D (+29.0) · D 62.7% · R 33.7% · Other 3.6%
- 2008→2024 swing
- -20.5pp toward R · 2008: 49.5pp · 2024: 29.0pp
- All cycles
- 2024: D+29.0 2020: D+38.1 2016: D+37.3 2012: D+46.9 2008: D+49.5
Not yet ingested
- Civics
- —
Market trends
- HPI YoY
- ▼ -238.11%
- Current HPI
- 236.4458
- Rent YoY
- ▲ 3.64%
- Metro
- Detroit-Warren-Dearborn, MI
- State GDP YoY
- ▲ 1.37%
- F500 in state
- 28
Industry mix (Fortune 500 HQ in MI)
| Industry | F500 HQs | Revenue |
|---|---|---|
| Automotive Parts | 3 | $48B |
|
||
| Automotive | 2 | $372B |
|
||
| Chemicals | 1 | $45B |
|
||
| Automotive Retail | 1 | $29B |
|
||
| Healthcare / Medical Devices | 1 | $23B |
|
||
| Automotive Technology | 1 | $20B |
|
||
Price history
+0.1% since first listed5 events — show timeline
- 2026-05-29 Listed $140,000 MiRealSource-MiMLS
- 2026-05-29 Listed $140,000 REALCOMP
- 2010-03-17 Sold (Public Records) $100,000 Public Records
- 2010-02-08 Sold (MLS) $100,000 REALCOMP
- 2009-03-06 Listed $139,900 REALCOMP
Property tax history
+0.4%/yrLatest (2025): $2,301 · +3.0% YoY. Source: county tax records.
Cash-flow waterfall
monthlySold comps — $/sqft
last 12 mo · ≤1 miLoading sold comps…