 Duplex
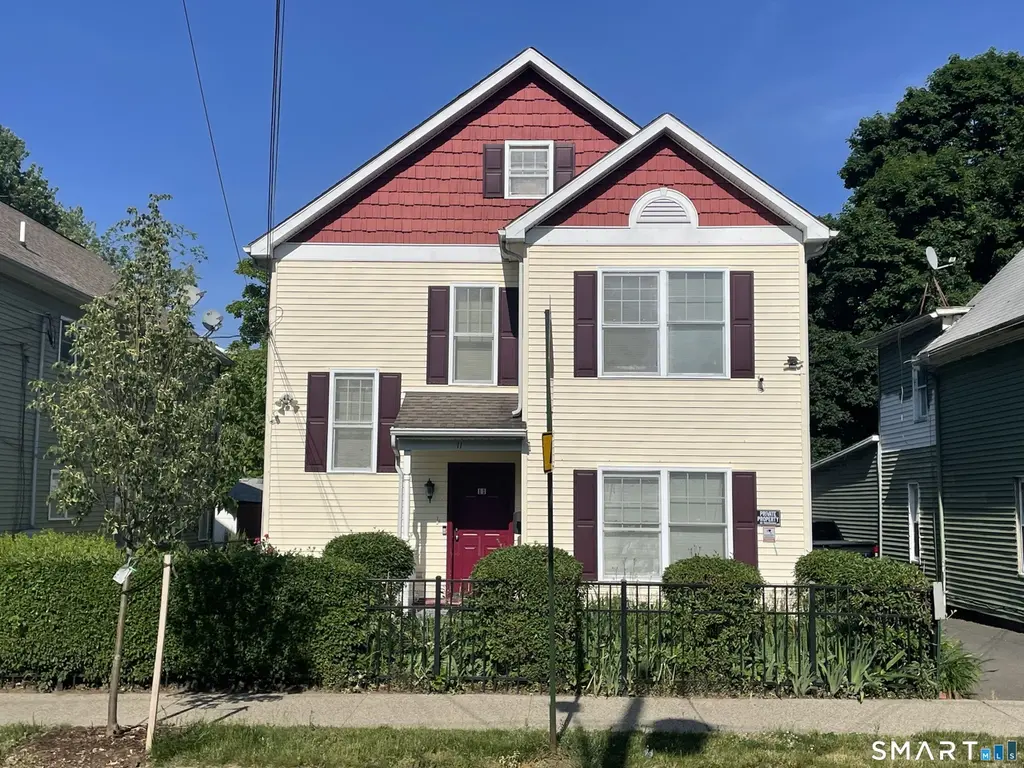
11 Button St · New Haven, CT
Flood risk 8/10 · Major
- FEMA flood zone
- X (unshaded)
- Chance of flooding over 30 yrs
- 0.97%
- Est. flood insurance / yr
- $473 – $860
Fire risk 1/10 · Minimal
- Est. fire insurance / yr
- $829 – $1,539
Heat risk 7/10 · Major
- Hot days now (above 99°F)
- 7 days/yr
- Hot days in 30 yrs
- 16 days/yr
Wind risk 6/10 · Moderate
- Chance of severe wind over 30 yrs
- 55.0%
Air-quality risk 5/10 · Moderate
- Unhealthy air days now
- 6 days/yr
- Unhealthy air days in 30 yrs
- 8 days/yr
Risk factors via First Street. Map © Google.
Why this score? — see what drove the D grade
The composite is a weighted blend of 9 inputs, each scored 0–100. Each bar is that input's sub-score; the figure is the points it added to the 100-point composite (weight × sub-score).
- Cash flow +13.1/30.0
- Appreciation +9.9/10.0
- Livability +4.0/5.0
- DSCR +3.9/10.0
- 1% rule +3.7/10.0
- Rent growth +3.3/5.0
- Condition / age +2.5/5.0
- Schools +1.5/10.0
- ARV discount +0.0/15.0
$550,000
🖨 Deal sheet 📄 Offer letter ✓ Due diligence
Multi-family units
County records classify this as Multi-Family (2-4 Unit). Listing-text estimate: 2 units. confirmed
Listing remarks MLS
New construction! City of new haven. Income restrictions and guidelines apply. 2Family, each apt. Has 3brs,2baths. Hardwood floors in lr&dr. Huge basement.
Key facts
- Minutes to downtown
- Minutes to highways
- Sprinkler system
Tags
Property features AI
Exterior
- Parking: Off-street parking; 3 total parking spaces
- Utilities: Public water connected; Public sewer connected; Natural gas hot water
- Home design: Multi-family 2-family property
- Construction: Frame construction; Concrete foundation; Asphalt shingle roof
- Exterior features: Level lot; Vinyl siding
Interior
- Bedrooms: 6 bedrooms
- Bathrooms: 4 full bathrooms
- Heating & cooling: Hot water heating (natural gas); Window unit cooling
- Interior features: 12 total rooms; Full basement
- Laundry & utility: Basement laundry hook-ups
Neighborhood map
What this means for you Summary
Snapshot
- This is a 2 × 3-bed/2.0-bath units multifamily listed at $550k.
Deal economics
- At list price, monthly cash flow is $-78 ($-932/yr) — negative. Per door: $-39/mo.
- To cash-flow at today's rent, offer at most $536k (2.5% below list).
- To meet the 1% rule (rent ≥ 1% of price), the offer needs to be $476k (13.4% below list).
- Recommended offer: $476k (13.4% below list) — sets the bar for 1% rule.
- Cap rate 6.2% vs local median 4.8% in New Haven — meaningfully above typical; check what's discounted (condition, days-on-market, listing class) to confirm the premium yield is real.
Location & tenants
- Location reads 79/100 on livability (#31 in CT, #2,190 nationally) — a middle-class / working-renter tenant base. Strengths: amenities A+, commute A+, health & safety A+; Watch: schools D+, employment D, crime F.
- New Haven School District (urban): math 12% / reading 25% proficiency, ranked #147 of 153 in CT (top 96%) — low school quality limits family demand, transient renter base, plan for 1-2y turnover; 66% free/reduced lunch — lower-income household profile, screen leases tightly.
- Market conditions: Rents rising (+3.3%/yr); 46 active listings in the ZIP; 5 comparable units currently listed for rent nearby; rentals at typical pace (median 15d on market — plan ~3-4 weeks tenant-placement turnaround); 1,059 units permitted in South Central Connecticut Planning Region in 2024 (779 in 5+ unit buildings).
- At $4,761/mo this rent would consume 115% of the median local household income ($50k/yr) (locally 1321% of renters already pay >50% of income on rent) — very limited rent-growth headroom before tenants either downsize or default.
Forward outlook
- In year one you build about $58k of equity ($4k loan paydown + $54k appreciation (9.8% local appreciation)).
- At projected returns (9.8% appreciation + 3.3% rent growth), your $154k cash investment doubles in ~3 years — after that, you're playing with house money.
- By year 2, paydown + projected appreciation supports a ~$93k cash-out refi (75% LTV) — recoverable capital for the next deal without selling this one.
Negotiation context
- Only 6 days on market — expect competitive offers; lowballing is unlikely to land.
- 2 sale attempts since 21y ago with the ask held roughly flat each time — persistent listings suggest the price (not the market) is what's stuck; bring a comps-based counter.
- Current owner paid $391k; 41% above their basis — modest negotiation headroom, anchor on the comps not their cost.
Risks & watch-outs
- Watch-outs: flood insurance adds $56/mo.
- Climate carrying-cost: severe flood risk; major wind risk, 55% chance of damaging wind over 30y; extreme-heat days projected 7→16/yr by 2055 (HVAC capex compounding) — expect insurance premiums to compound above CPI over the hold.
Questions for the listing agent
- What do current leases actually rent for vs. the listed asking? Can we see a recent rent roll and the last 12 months of T-12 income?
- Can we see the unit-by-unit rent roll, current vacancy, and any below-market leases? What's the average tenancy length?
- What capital expenditures (roof, boiler, parking lot, exteriors) have been made in the last 5 years, and what's planned in the next 2?
- What's the actual annual flood-insurance premium (NFIP or private), and is the property in a SFHA with mandatory coverage?
- Is there a deadline driving the sale (1031 exchange, divorce, estate, relocation)? That informs how much negotiation room exists.
- Schools are D-rated, which usually means shorter tenancies and higher turnover. Who's the typical renter profile here, and what's been the actual vacancy rate?
- Crime grade is F in this area — have there been break-ins, vandalism, or insurance claims at this property in the last 3 years? What carrier currently insures it and at what premium?
- The area grade is low — what's the realistic commute time and amenity access for the typical tenant pool here? Any planned neighborhood developments (good or bad) we should know about?
- What's the average days-on-market for RENTAL listings here right now (not sales)? A rising rental-DOM trend means longer vacancies and softer asking-rent achievability than the comps imply.
- What's the recent tenant-quality profile in this submarket — average credit score on applications, eviction rate, late-payment / NSF rate, and stable-employment percentage? A property-management company in the area should have these aggregated.
- How much new apartment / multifamily construction is in the pipeline within 1–3 miles? Heavy new supply (>2% of stock underway) typically softens rents 12–24 months out; light construction supports rent growth.
Investment metrics
- 1% rule
- 0.87% ✗
- Cap rate
- 6.24%
- Cash-on-cash
- -0.17%
- DSCR
- 0.99
- GRM
- 9.6
CMA / ARV
- ARV (on-the-fly)
- $434,295
- Comps found
- 12
Show comp detail 12 sales within ~0.75 mi
| Address | Dist | Beds/Ba | Sqft | Sold | Price | $/sf | Match |
|---|---|---|---|---|---|---|---|
| 46 Hurlburt St | 0.09mi | 6/3.0 | 3,249 (+1%) | 4mo | $440,000 | $135 | 87 |
| 148 Plymouth St | 0.10mi | 6/3.0 | 3,152 (-2%) | 5mo | $415,000 | $132 | 84 |
| 211 Kimberly Ave | 0.31mi | 6/— | 3,112 (-3%) | 2mo | $240,000 | $77 | 78 |
| 32 Lamberton St | 0.22mi | 6/3.0 | 3,021 (-6%) | 5mo | $535,000 | $177 | 72 |
| 589 Washington Ave | 0.28mi | 6/3.0 | 3,201 (-0%) | 15mo | $535,000 | $167 | 69 |
| 41 Cassius St | 0.21mi | 6/3.0 | 3,551 (+10%) | 4mo | $410,000 | $115 | 66 |
| 423 Howard Ave | 0.20mi | 6/2.0 | 3,026 (-6%) | 12mo | $443,000 | $146 | 63 |
| 102 Plymouth St | 0.18mi | 6/3.0 | 3,528 (+10%) | 12mo | $457,500 | $130 | 62 |
| 256 Davenport Ave | 0.73mi | 6/3.0 | 3,105 (-4%) | 7mo | $415,000 | $134 | 50 |
| 52 Howard Ave | 0.68mi | 5/4.0 (-1) | 3,233 (+0%) | 16mo | $630,000 | $195 | 49 |
| 63 Sea St | 0.68mi | 5/3.0 (-1) | 2,842 (-12%) | 0mo | $675,000 | $238 | 40 |
| 29 Kossuth St | 0.70mi | 6/3.0 | 3,588 (+12%) | 9mo | $330,000 | $92 | 37 |
Match score weights: distance 35% · size 25% · config 20% · recency 20%. Top-matched comps best support the ARV.
Projected returns pro-forma
9.81% appreciation · 3.3% rent growth · sell at horizon
- IRR
- 23.6%
- Equity multiple
- 2.88×
- Total profit
- $288,967
- Equity at exit
- $487,860
- IRR
- 21.1%
- Equity multiple
- 6.56×
- Total profit
- $856,121
- Equity at exit
- $1,044,079
Cash invested: $154,000 (down + closing). Projections, not guarantees.
Landlord ↔ Tenant lean methodology
- Overall (STATE)
- 27 Tenant-Leaning
- State Connecticut
- 27 Tenant-Leaning · D+7
- County
- — inherits STATE
- City
- — inherits STATE
ZIP-level market 06519
- Home prices YoY
- 2.7%
- Rents YoY
- 3.3%
- Active inventory
- 46
- Price-to-rent
- 19.3×
Monthly cashflow live
- Estimated rent
- $4,761 high interval (Pro) →
- Mortgage (P&I)
- −$2,884
- Tax from tax record
- −$670 /mo · $8,039/yr
- Insurance
- −$229
- Flood insurance flood zone
- −$56 /mo · $666/yr
- HOA
- −$0
- Vacancy / Maint / Mgmt
- −$1,000
- Net cashflow
- $-78
Break-even live
2-unit breakdown (identical units grouped — click to expand)
| Units | Beds | Baths | Est. rent |
|---|---|---|---|
| 2× units | 3 | 2 | $4,760 |
| #1 | 3 | 2 | $2,380 |
| #2 | 3 | 2 | $2,380 |
| Total (2 units) | $4,761 | ||
UW: 25.0% down · 7.5% · 30yr · 1.5% tax · 5.0% vac · 8.0% maint · 8.0% mgmt
Financing live
Cash to close
- Down payment
- $137,500
- Closing costs
- $16,500
- Reserves months
- —
- Total cash needed
- —
Loan-product check · same deal, 3 products live
Conventional
25% down · 7.5% · 30yr
- Down + closing
- —
- Monthly P&I
- —
- Monthly cashflow
- —
- DSCR
- —
- Eligible?
- —
Personal DTI + credit; lowest rate.
DSCR
20% down · 8.5% · 30yr
- Down + closing
- —
- Monthly P&I
- —
- Monthly cashflow
- —
- DSCR
- —
- Eligible?
- —
No personal income docs; deal must DSCR.
Hard money
10% down · 12.0% · 12mo
- Down + closing
- —
- Monthly P&I
- —
- Monthly cashflow
- —
- DSCR
- —
- Eligible?
- —
Short-term bridge; refi at stabilization.
Rent comps 5 comps
| Address | Beds | Baths | Sqft | Rent | $/sqft | DOM | Units | Dist |
|---|---|---|---|---|---|---|---|---|
| 37 Center St Unit 2 West Haven, CT | 5.0 | 2.0 | 2500 | $3,300 | $1.32 | 2d | 1 | 0.95mi |
| 395 Crown St New Haven, CT | 6.0 | 3.5 | 2889 | $7,195 | $2.49 | 44d | 1 | 1.21mi |
| 131 Dwight St Unit 1 New Haven, CT | 6.0 | 3.0 | 3097 | $6,250 | $2.02 | 23d | 1 | 1.26mi |
| 131 Dwight St Unit 1 New Haven, CT | 6.0 | 3.0 | 3000 | $6,250 | $2.08 | 14d | 1 | 1.26mi |
| 229 Dwight St New Haven, CT | 6.0 | 2.0 | 2400 | $4,995 | $2.08 | 2d | 1 | 1.43mi |
Listing history 6 events
-
2026-06-16status $550,000 Under Contract 6 DOM
-
2026-06-15days on market $550,000 Active 6 DOM
-
2026-06-14days on market $550,000 Active 4 DOM
-
2026-06-13days on market $550,000 Active 3 DOM
-
2026-06-10remarks 290-char remark
-
2026-06-10$550,000 Active 1 DOM
ⓘ Source: listings_history table (triggers on properties + properties_extension) + one-shot
backfill from property_details.listing_events for pre-trigger history.
Tax reassessment forecast CT · Partial reset (capped growth)
- Current annual tax
- $8,039 · $670/mo
- Projected year-2 tax
- $9,904 · $825/mo
- Expected delta
- +$1,866/yr (+$155/mo · 23.2%)
ⓘ Screening estimate from a state-policy table — verify with the county assessor before closing.
Climate risk First Street
- Flood 8/10 Severe FEMA zone X (unshaded) · 97% chance over 30 yrs
- Wildfire 1/10 Low
- Heat 7/10 Severe 7 d/yr ≥99°F today · 16 d/yr by 30 yrs out
- Wind 6/10 Major 55% chance of damaging wind over 30 yrs
- Air quality 5/10 Major 6 unhealthy d/yr today · 8 by 30 yrs out
Nearby sold comps map
Loading sold comps map…
Walkable amenities ~0.75 mi
Loading nearby amenities…
Taxation est. · year 1
- Rental income
- $57,132
- − Mortgage interest
- −$30,809
- − Property taxes
- −$8,039
- − Insurance
- −$3,416
- − Repairs & maintenance
- −$4,571
- − Management
- −$4,571
- − Depreciation
- −$16,000
- Taxable loss
- −$10,273
- Est. tax savings @ 24.0%
- +$2,466
- After-tax cash flow
- $1,533/yr
For passive investors: Depreciation is non-cash, so a rental often shows a tax loss while cash-flowing — sheltering income. Rental losses are passive: they offset passive income freely, and up to $25,000/yr can offset ordinary (W-2) income if you actively participate and your MAGI is under $100k (phasing out to $0 by $150k); unused losses carry forward. On sale, claimed depreciation is recaptured at up to 25%, and gains may owe capital-gains tax (a 1031 exchange can defer both). Figures are a year-1 estimate at your 24.0% rate — not tax advice; consult a CPA.
Schools (NCES district)
- District
- New Haven School District
- NCES district ID
- 0902790
- Math proficiency
- 12% ▼ -10.00%
- Reading proficiency
- 25% ▼ -10.00%
- Median HH income
- $38,058
- Composite
- 15.48/100
- National rank
- #9308
- State rank
- #147 of 153 in CT
Livability — New Haven
- Score
- 79/100
- State rank
- #31
- US rank
- #2190
Category grades
Schools grade is shown separately in the Schools card above.
Census & demographics
- Census place
- New Haven, CT
- County
- New Haven County · 688,236 people
- City population
- 132,813
- Metro
- New Haven-Milford, CT
- Population (ZIP)
- 15,605
- Household income
- $49,619
- Rent vs Own
- Severe rent burden
- 1321.0
Population outlook (South Central Connecticut County) Hauer SSP2
- By 2040
- 608,362
Race, ethnicity, and origin ACS 2023
- Neighborhood character
- Diverse neighborhood (Simpson 0.67)
- Race & ethnicity
- Hispanic / Latino 49% Black 26% White 15% Two or more races 13% Asian 4% Native American 1%
- Hispanic origin (detail)
- Mexican 15% Puerto Rican 25% Dominican 3%
- Common ancestry
- Romanian 1% Lithuanian 1%
- Foreign-born
- 25% · Canada, Jamaica, China
- Languages at home
- 50% English-only · Spanish 42% Other Indo-European 4% Arabic 1%
Political lean MEDSL · South Central Connecticut
- 2024 margin
- Strong D (+20.1) · D 59.0% · R 38.9% · Other 2.1%
- All cycles
- 2024: D+20.1
Not yet ingested
- Civics
- —
Market trends
- HPI YoY
- ▲ 9.81%
- Current HPI
- 377.4885
- Rent YoY
- ▲ 3.30%
- Metro
- New Haven-Milford, CT
- State GDP YoY
- ▲ 1.06%
- F500 in state
- 38
Industry mix (Fortune 500 HQ in CT)
| Industry | F500 HQs | Revenue |
|---|---|---|
| Industrial Machinery | 4 | $38B |
|
||
| Insurance | 3 | $71B |
|
||
| Financial Services | 2 | $25B |
|
||
| Transportation / Logistics | 2 | $18B |
|
||
| Healthcare | 1 | $247B |
|
||
| Telecommunications | 1 | $55B |
|
||
Price history
+243.8% since first listed4 events — show timeline
- 2026-06-08 Listed $550,000 Smart MLS
- 2023-05-10 Sold (Public Records) $391,000 Public Records
- 2006-04-03 Sold (MLS) $160,000 Smart MLS
- 2005-11-06 Listed $160,000 Smart MLS
Property tax history
+5.9%/yrLatest (2023): $8,039 · -6.4% YoY. Source: county tax records.
Cash-flow waterfall
monthlySold comps — $/sqft
last 12 mo · ≤1 miLoading sold comps…