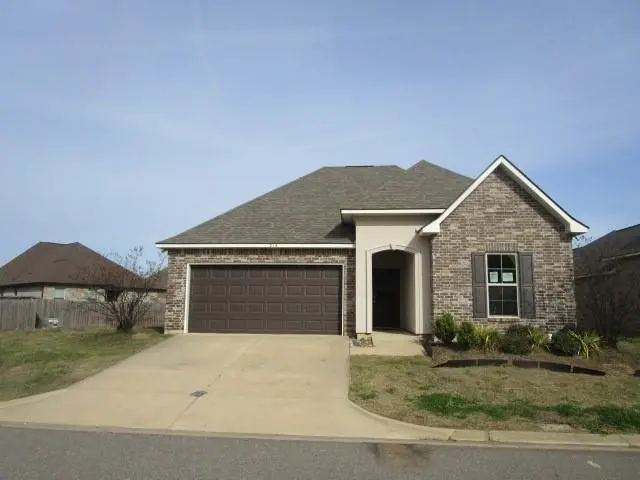
214 Fairhope Dr · Sterlington, LA
Flood risk No data
- FEMA flood zone
- —
- Chance of flooding over 30 yrs
- —
- Est. flood insurance / yr
- —
Fire risk No data
- Est. fire insurance / yr
- —
Heat risk No data
- Hot days now (above threshold)
- —
- Hot days in 30 yrs
- —
Wind risk No data
- Chance of severe wind over 30 yrs
- —
Air-quality risk No data
- Unhealthy air days now
- —
- Unhealthy air days in 30 yrs
- —
Risk factors via First Street. Map © Google.
Why this score? — see what drove the D+ grade
The composite is a weighted blend of 9 inputs, each scored 0–100. Each bar is that input's sub-score; the figure is the points it added to the 100-point composite (weight × sub-score).
- ARV discount +15.0/15.0
- Cash flow +12.9/30.0
- DSCR +3.9/10.0
- 1% rule +3.7/10.0
- Livability +3.5/5.0
- Schools +3.2/10.0
- Rent growth +2.5/5.0
- Condition / age +2.5/5.0
- Appreciation +0.0/10.0
$204,000
🖨 Deal sheet 📄 Offer letter ✓ Due diligence
Listing remarks MLS
3 bedroom 2 bath home is ready for you to move convenient to downtown Monroe
Key facts
- 8,720 sq ft lot
- Garage
- Built 2020
Neighborhood map
What this means for you Summary
Snapshot
- This is a 3-bed/2.0-bath single-family listed at $204k.
Deal economics
- At list price, monthly cash flow is $-14 ($-167/yr) — negative.
- To cash-flow at today's rent, offer at most $202k (1.2% below list).
- To meet the 1% rule (rent ≥ 1% of price), the offer needs to be $178k (12.8% below list).
- Recommended offer: $178k (12.8% below list) — sets the bar for 1% rule.
Location & tenants
- Location reads 70/100 on livability (#60 in LA) — a middle-class / working-renter tenant base. Strengths: cost of living A+, housing A+, schools A-; Watch: health & safety D, amenities F, commute F.
- Ouachita Parish (suburban): math 31% / reading 45% proficiency, ranked #26 of 98 in LA (top 26%) — families likely to look elsewhere, expect single-tenant / working-renter base with shorter leases.
- Market conditions: 437 active listings in the ZIP; 1 comparable units currently listed for rent nearby; 345 units permitted in Ouachita Parish in 2024 (0 in 5+ unit buildings).
- This rent runs 41% of the median local income ($52k/yr) — at the standard rent-burdened threshold; future hikes will face affordability resistance.
Forward outlook
- Local home prices are declining (-3.0%/yr); year-one equity from $1k of loan paydown is wiped out by about $6k of value loss. Plan a longer hold.
Negotiation context
- It's been on market 99 days — a 9% lower offer ($186k) is reasonable based on typical stale-listing flexibility.
- 4 sale attempts; this cycle's ask has dropped $57k (22%) from the opening price — seller is motivated, your offer sets the floor, not the list.
Questions for the listing agent
- What do current leases actually rent for vs. the listed asking? Can we see a recent rent roll and the last 12 months of T-12 income?
- It's been on market 99 days. Have you received any prior offers? Is the seller open to a 13% concession, seller financing, or rate buy-down credit?
- Why hasn't it sold? Are there any deal-killer items the seller is aware of (foundation, flood, title, zoning, code violations)?
- Is there a deadline driving the sale (1031 exchange, divorce, estate, relocation)? That informs how much negotiation room exists.
- Schools are A-rated — typically a magnet for longer-tenancy family renters. What's the average tenant stay here, and is there a school-zone premium baked into asking?
- The area grade is low — what's the realistic commute time and amenity access for the typical tenant pool here? Any planned neighborhood developments (good or bad) we should know about?
- What's the average days-on-market for RENTAL listings here right now (not sales)? A rising rental-DOM trend means longer vacancies and softer asking-rent achievability than the comps imply.
- What's the recent tenant-quality profile in this submarket — average credit score on applications, eviction rate, late-payment / NSF rate, and stable-employment percentage? A property-management company in the area should have these aggregated.
- How much new for-sale + rental construction is in the pipeline within 1–3 miles? Heavy new supply typically softens prices + rents 12–24 months out; constrained supply supports both.
Investment metrics
- 1% rule
- 0.87% ✗
- Cap rate
- 6.21%
- Cash-on-cash
- -0.29%
- DSCR
- 0.99
- GRM
- 9.6
CMA / ARV
- ARV (median comp)
- $318,349
- List price
- $204,000
- Delta
- -35.92%
- Verdict
- UNDERPRICED
- Comps
- 20 within 1.0 mi
Show comp detail 12 sales within ~0.75 mi
| Address | Dist | Beds/Ba | Sqft | Sold | Price | $/sf | Match |
|---|---|---|---|---|---|---|---|
| 207 Lynnhaven St | 0.04mi | 3/2.0 | 1,618 (-8%) | 10mo | $236,000 | $146 | 76 |
| 107 Vieux Carre | 0.34mi | 3/2.0 | 1,800 (+2%) | 8mo | $315,000 | $175 | 74 |
| 301 Southern Grove Rd | 0.18mi | 3/2.0 | 1,926 (+9%) | 10mo | $280,000 | $145 | 68 |
| 304 Southern Grove Rd | 0.16mi | 3/2.0 | 2,020 (+14%) | 4mo | $289,000 | $143 | 65 |
| 123 Vieux Carre Pl | 0.41mi | 3/2.0 | 1,675 (-5%) | 12mo | $325,000 | $194 | 62 |
| 121 Vieux Carre | 0.40mi | 3/2.0 | 1,680 (-5%) | 13mo | $325,000 | $193 | 62 |
| 125 Blue Sky Dr | 0.33mi | 3/2.0 | 1,936 (+10%) | 14mo | $325,000 | $168 | 57 |
| 211 Barker Dr | 0.63mi | 4/2.0 (+1) | 1,838 (+4%) | 2mo | $290,000 | $158 | 57 |
| 202 Thatcher Ln | 0.68mi | 4/2.0 (+1) | 1,863 (+6%) | 3mo | $305,000 | $164 | 52 |
| 212 Hoover Dr | 0.65mi | 4/2.0 (+1) | 1,706 (-3%) | 10mo | $270,000 | $158 | 51 |
| 207 Winkler Way | 0.60mi | 3/2.0 | 1,967 (+11%) | 4mo | $305,000 | $155 | 50 |
| 302 Winkler Way | 0.47mi | 4/2.5 (+1) | 1,968 (+11%) | 13mo | $322,900 | $164 | 41 |
Match score weights: distance 35% · size 25% · config 20% · recency 20%. Top-matched comps best support the ARV.
Projected returns pro-forma
-3.0% appreciation · 3.0% rent growth · sell at horizon
- IRR
- -16.8%
- Equity multiple
- 0.41×
- Total profit
- $-33,911
- Equity at exit
- $30,417
- IRR
- -8.6%
- Equity multiple
- 0.47×
- Total profit
- $-30,538
- Equity at exit
- $17,638
Cash invested: $57,120 (down + closing). Projections, not guarantees.
Landlord ↔ Tenant lean methodology
- Overall (STATE)
- 90 Strongly Landlord-Friendly
- State Louisiana
- 90 Strongly Landlord-Friendly · R+12
- County
- — inherits STATE
- City
- — inherits STATE
ZIP-level market 71203
- Home prices YoY
- -32.4%
- Active inventory
- 437
- Price-to-rent
- 9.6×
Monthly cashflow live
- Estimated rent
- $1,779 medium interval (Pro) →
- Mortgage (P&I)
- −$1,070
- Tax from tax record
- −$264 /mo · $3,170/yr
- Insurance
- −$85
- HOA
- −$0
- Vacancy / Maint / Mgmt
- −$373
- Net cashflow
- $-14
Break-even live
UW: 25.0% down · 7.5% · 30yr · 1.5% tax · 5.0% vac · 8.0% maint · 8.0% mgmt
Financing live
Cash to close
- Down payment
- $51,000
- Closing costs
- $6,120
- Reserves months
- —
- Total cash needed
- —
Loan-product check · same deal, 3 products live
Conventional
25% down · 7.5% · 30yr
- Down + closing
- —
- Monthly P&I
- —
- Monthly cashflow
- —
- DSCR
- —
- Eligible?
- —
Personal DTI + credit; lowest rate.
DSCR
20% down · 8.5% · 30yr
- Down + closing
- —
- Monthly P&I
- —
- Monthly cashflow
- —
- DSCR
- —
- Eligible?
- —
No personal income docs; deal must DSCR.
Hard money
10% down · 12.0% · 12mo
- Down + closing
- —
- Monthly P&I
- —
- Monthly cashflow
- —
- DSCR
- —
- Eligible?
- —
Short-term bridge; refi at stabilization.
Rent comps 1 comps
| Address | Beds | Baths | Sqft | Rent | $/sqft | DOM | Units | Dist |
|---|---|---|---|---|---|---|---|---|
| 115 Lynnhaven St Monroe, LA | 3.0 | 2.0 | 1710 | $2,500 | $1.46 | 43d | 1 | 0.07mi |
Listing history 10 events
-
2026-05-15price $204,000 76-char remark
Show marketing remark (76 chars)
3 bedroom 2 bath home is ready for you to move convenient to downtown Monroe
-
2026-05-15price $204,000 76-char remark
Show marketing remark (76 chars)
3 bedroom 2 bath home is ready for you to move convenient to downtown Monroe
-
2026-04-23status Active 76-char remark
Show marketing remark (76 chars)
3 bedroom 2 bath home is ready for you to move convenient to downtown Monroe
-
2026-04-23status Active 76-char remark
Show marketing remark (76 chars)
3 bedroom 2 bath home is ready for you to move convenient to downtown Monroe
-
2026-04-14status Pending 76-char remark
Show marketing remark (76 chars)
3 bedroom 2 bath home is ready for you to move convenient to downtown Monroe
-
2026-04-14status Pending 76-char remark
Show marketing remark (76 chars)
3 bedroom 2 bath home is ready for you to move convenient to downtown Monroe
-
2026-03-26price $251,000 76-char remark
Show marketing remark (76 chars)
3 bedroom 2 bath home is ready for you to move convenient to downtown Monroe
-
2026-03-26price $251,000 76-char remark
Show marketing remark (76 chars)
3 bedroom 2 bath home is ready for you to move convenient to downtown Monroe
-
2026-02-09$261,000 Active 76-char remark
Show marketing remark (76 chars)
3 bedroom 2 bath home is ready for you to move convenient to downtown Monroe
-
2026-02-09$261,000 Active 76-char remark
Show marketing remark (76 chars)
3 bedroom 2 bath home is ready for you to move convenient to downtown Monroe
ⓘ Source: listings_history table (triggers on properties + properties_extension) + one-shot
backfill from property_details.listing_events for pre-trigger history.
Tax reassessment forecast LA · Resets to sale price
- Current annual tax
- $3,170 · $264/mo
- Projected year-2 tax
- $3,170 · $264/mo
- Expected delta
- $0/yr ($0/mo · 0.0%)
ⓘ Screening estimate from a state-policy table — verify with the county assessor before closing.
Nearby sold comps map
Loading sold comps map…
Walkable amenities ~0.75 mi
Loading nearby amenities…
Taxation est. · year 1
- Rental income
- $21,343
- − Mortgage interest
- −$11,427
- − Property taxes
- −$3,170
- − Insurance
- −$1,020
- − Repairs & maintenance
- −$1,707
- − Management
- −$1,707
- − Depreciation
- −$5,935
- Taxable loss
- −$3,624
- Est. tax savings @ 24.0%
- +$870
- After-tax cash flow
- $703/yr
For passive investors: Depreciation is non-cash, so a rental often shows a tax loss while cash-flowing — sheltering income. Rental losses are passive: they offset passive income freely, and up to $25,000/yr can offset ordinary (W-2) income if you actively participate and your MAGI is under $100k (phasing out to $0 by $150k); unused losses carry forward. On sale, claimed depreciation is recaptured at up to 25%, and gains may owe capital-gains tax (a 1031 exchange can defer both). Figures are a year-1 estimate at your 24.0% rate — not tax advice; consult a CPA.
Schools (NCES district)
- District
- Ouachita Parish
- NCES district ID
- 2201200
- Math proficiency
- 31% ▼ -38.00%
- Reading proficiency
- 45% ▼ -31.00%
- Median HH income
- $43,316
- Composite
- 32.14/100
- National rank
- #5791
- State rank
- #26 of 98 in LA
Livability — Sterlington
- Score
- 70/100
- State rank
- #60
- US rank
- #7741
Category grades
Schools grade is shown separately in the Schools card above.
Census & demographics
- County
- Ouachita Parish · 118,340 people
- Metro
- Monroe, LA
- Population (ZIP)
- 38,354
- Household income
- $52,326
- Rent vs Own
- Severe rent burden
- 2085.0
Population outlook (Ouachita County) Hauer SSP2
- Today (2025)
- 163,370 people
- By 2030
- 165,520 · +1.3%
- By 2040
- 167,652 · +2.6%
- By 2050
- 166,699 · +2.0%
- By 2075
- 156,348 · -4.3%
- By 2100
- 134,102 · -17.9%
Race, ethnicity, and origin ACS 2023
- Neighborhood character
- Diverse neighborhood (Simpson 0.57)
- Race & ethnicity
- Black 48% White 45% Two or more races 4% Hispanic / Latino 3% Asian 1%
- Common ancestry
- Lithuanian 3% Slovak 1% Serbian 1%
- Foreign-born
- 3% · Canada
- Languages at home
- 96% English-only · Spanish 2% Other Indo-European 1%
Political lean MEDSL · Ouachita
- 2024 margin
- Strong R (+27.9) · D 35.5% · R 63.3% · Other 1.2%
- 2008→2024 swing
- -2.7pp toward R · 2008: -25.2pp · 2024: -27.9pp
- All cycles
- 2024: R+27.9 2020: R+23.6 2016: R+25.4 2012: R+20.9 2008: R+25.2
Not yet ingested
- Civics
- —
Market trends
- HPI YoY
- ▼ -99.01%
- Current HPI
- 206.1948
- Rent YoY
- —
- Metro
- Monroe, LA
- State GDP YoY
- ▲ 3.29%
- F500 in state
- 10
Industry mix (Fortune 500 HQ in LA)
| Industry | F500 HQs | Revenue |
|---|---|---|
| Telecommunications | 2 | $23B |
|
||
| Utilities | 1 | $12B |
|
||
| Wholesale / Distribution | 1 | $5B |
|
||
| Advertising | 1 | $2B |
|
||
Price history
-21.8% since first listed10 events — show timeline
- 2026-05-15 Price Changed $204,000 AcadianaMLS
- 2026-05-15 Price Changed $204,000 GSREIN
- 2026-04-23 Relisted — AcadianaMLS
- 2026-04-23 Relisted — GSREIN
- 2026-04-14 Pending — AcadianaMLS
- 2026-04-14 Pending — GSREIN
- 2026-03-26 Price Changed $251,000 AcadianaMLS
- 2026-03-26 Price Changed $251,000 GSREIN
- 2026-02-09 Listed $261,000 GSREIN
- 2026-02-09 Listed $261,000 AcadianaMLS
Property tax history
+176.1%/yrLatest (2025): $3,170 · -0.7% YoY. Source: county tax records.
Cash-flow waterfall
monthlySold comps — $/sqft
last 12 mo · ≤1 miLoading sold comps…