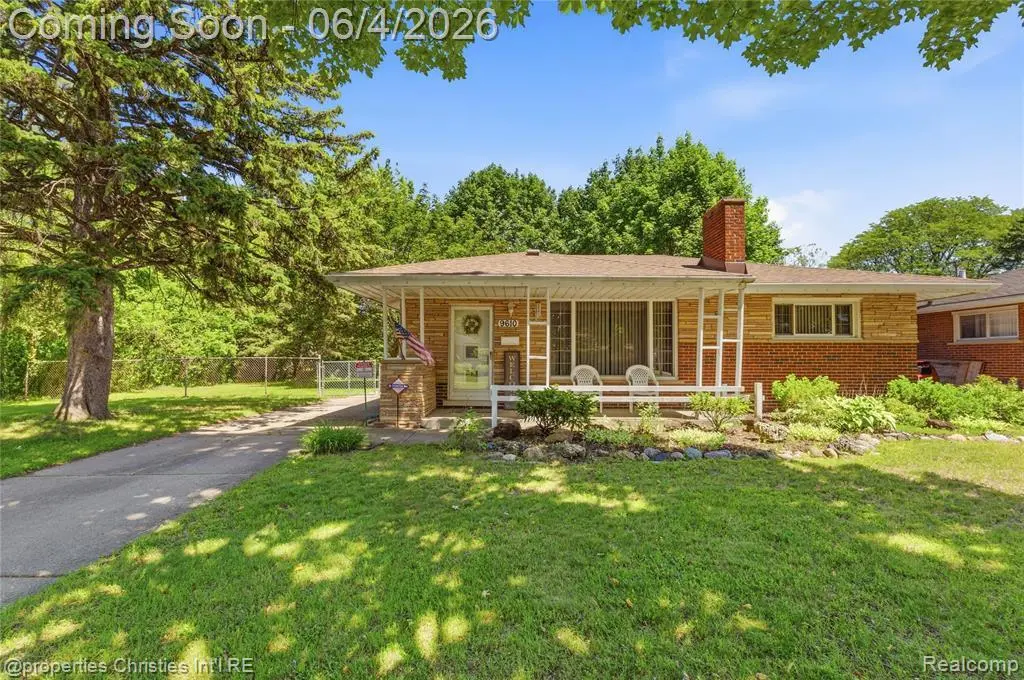
9610 Norborne · Redford, MI
Flood risk 3/10 · Minor
- FEMA flood zone
- X (unshaded)
- Chance of flooding over 30 yrs
- 0.2%
- Est. flood insurance / yr
- $473 – $860
Fire risk 1/10 · Minimal
- Est. fire insurance / yr
- $784 – $1,456
Heat risk 3/10 · Minor
- Hot days now (above 98°F)
- 7 days/yr
- Hot days in 30 yrs
- 15 days/yr
Wind risk 2/10 · Minimal
- Chance of severe wind over 30 yrs
- —
Air-quality risk 3/10 · Minor
- Unhealthy air days now
- 2 days/yr
- Unhealthy air days in 30 yrs
- 3 days/yr
Risk factors via First Street. Map © Google.
Why this score? — see what drove the F grade
The composite is a weighted blend of 9 inputs, each scored 0–100. Each bar is that input's sub-score; the figure is the points it added to the 100-point composite (weight × sub-score).
- Cash flow +15.2/30.0
- DSCR +4.7/10.0
- Rent growth +3.3/5.0
- 1% rule +3.1/10.0
- Livability +2.5/5.0
- Condition / age +2.5/5.0
- Schools +1.8/10.0
- ARV discount +0.0/15.0
- Appreciation +0.0/10.0
$215,000
🖨 Deal sheet 📄 Offer letter ✓ Due diligence
Listing remarks
Welcome to this well-maintained 3-bedroom, 2-bath ranch offering comfortable single-level living on a spacious double lot. Inside, you'll find hardwood flooring throughout much of the home, with carpeting in two bedrooms. The inviting living area features a gas fireplace, creating a warm focal point for everyday living and entertaining. Recent improvements include a new deck installed in Fall 2023 and a new 50-year roof on both the home and detached 2-car garage completed in Fall 2024, providing added peace of mind for years to come. The fenced backyard offers ample outdoor space for relaxation, recreation, gardening, or gatherings, while the double lot provides additional flexibility and r
Key facts
- 0.31 acre lot
- 2 garage spots
- Built 1955
Property features AI
Finance
- Other: Property sits on a paved street in Redford Township, subdivision: Frischkorns Grand Dale Gardens
Exterior
- Parking: Detached 2-car garage
- Utilities: Public water
- Home design: Single-story residential home; Built in 1955; Basement present (partially finished)
- Construction: Brick construction; Basement foundation
- Exterior features: Brick exterior; Fenced yard
Interior
- Kitchen: Basement kitchen (approx. 9 x 11)
- Bedrooms: Three bedrooms on the entry level (approx. 12 x 13; 9 x 11; 9); Total of 9 rooms
- Bathrooms: Two full bathrooms (one on entry level, one in the basement)
- Heating & cooling: Forced air heating; Natural gas fuel
- Interior features: Fireplace in the family room (gas); Partially finished basement
- Laundry & utility: Basement utilities/space
Neighborhood map
What this means for you Summary
Snapshot
- This is a 3-bed/1.0-bath single-family listed at $215k.
Deal economics
- At list price, monthly cash flow is $75 ($898/yr) — positive.
- The deal already cash-flows at list — no discount required.
- To meet the 1% rule (rent ≥ 1% of price), the offer needs to be $173k (19.3% below list).
- Recommended offer: $173k (19.3% below list) — sets the bar for 1% rule.
Location & tenants
- Location reads: area grade F — affects rentability + tenant quality, not the cash-flow math above.
- South Redford School District (suburban): math 11% / reading 29% proficiency, ranked #455 of 540 in MI (top 84%) — low school quality limits family demand, transient renter base, plan for 1-2y turnover.
- Market conditions: Rents rising (+3.2%/yr); 188 active listings in the ZIP; 9 comparable units currently listed for rent nearby; rentals at typical pace (median 15d on market — plan ~3-4 weeks tenant-placement turnaround); 2,639 units permitted in Wayne County in 2024 (1,216 in 5+ unit buildings).
Forward outlook
- Local home prices are declining (-3.0%/yr); year-one equity from $1k of loan paydown is wiped out by about $6k of value loss. Plan a longer hold.
- Wayne County population projected at -17% by 2050 — secular population decline; favor cash flow + early exit over multi-decade hold.
Negotiation context
- Only 14 days on market — expect competitive offers; lowballing is unlikely to land.
Risks & watch-outs
- Watch-outs: built in 1955 — expect roof / HVAC / electrical / plumbing capex.
Questions for the listing agent
- Built in 1955 — when were the roof, HVAC, electrical panel, plumbing, and water heater last replaced?
- Is there a deadline driving the sale (1031 exchange, divorce, estate, relocation)? That informs how much negotiation room exists.
- The area grade is low — what's the realistic commute time and amenity access for the typical tenant pool here? Any planned neighborhood developments (good or bad) we should know about?
- What's the average days-on-market for RENTAL listings here right now (not sales)? A rising rental-DOM trend means longer vacancies and softer asking-rent achievability than the comps imply.
- What's the recent tenant-quality profile in this submarket — average credit score on applications, eviction rate, late-payment / NSF rate, and stable-employment percentage? A property-management company in the area should have these aggregated.
- How much new for-sale + rental construction is in the pipeline within 1–3 miles? Heavy new supply typically softens prices + rents 12–24 months out; constrained supply supports both.
Investment metrics
- 1% rule
- 0.81% ✗
- Cap rate
- 6.71%
- Cash-on-cash
- 1.49%
- DSCR
- 1.07
- GRM
- 10.3
CMA / ARV
- ARV (on-the-fly)
- $164,160
- Comps found
- 12
Show comp detail 12 sales within ~0.75 mi
| Address | Dist | Beds/Ba | Sqft | Sold | Price | $/sf | Match |
|---|---|---|---|---|---|---|---|
| 9636 Centralia | 0.06mi | 3/1.0 | 1,043 (+2%) | 4mo | $135,000 | $129 | 91 |
| 9624 Nathaline | 0.48mi | 3/1.0 | 1,019 (-1%) | 3mo | $209,000 | $205 | 74 |
| 9983 Hemingway | 0.42mi | 3/1.0 | 1,059 (+3%) | 3mo | $149,000 | $141 | 73 |
| 9010 Leverne | 0.57mi | 3/1.0 | 1,020 (-1%) | 2mo | $220,000 | $216 | 71 |
| 9960 Rockland | 0.21mi | 3/2.0 | 937 (-9%) | 2mo | $150,000 | $160 | 70 |
| 11757 Eileen | 0.65mi | 3/1.0 | 1,040 (+1%) | 0mo | $220,000 | $212 | 67 |
| 9130 Kinloch | 0.37mi | 3/1.5 | 1,144 (+12%) | 3mo | $123,000 | $108 | 59 |
| 11748 Leverne | 0.61mi | 3/1.5 | 1,075 (+5%) | 4mo | $142,000 | $132 | 58 |
| 9560 Nathaline | 0.49mi | 4/1.5 (+1) | 1,125 (+10%) | 1mo | $142,500 | $127 | 53 |
| 9648 Nathaline Ave | 0.48mi | 3/1.0 | 894 (-13%) | 4mo | $145,000 | $162 | 53 |
| 9656 Sioux | 0.60mi | 4/1.0 (+1) | 1,116 (+9%) | 2mo | $147,500 | $132 | 51 |
| 11756 Berwyn | 0.55mi | 2/1.5 (-1) | 930 (-9%) | 2mo | $167,500 | $180 | 50 |
Match score weights: distance 35% · size 25% · config 20% · recency 20%. Top-matched comps best support the ARV.
Projected returns pro-forma
-3.0% appreciation · 3.25% rent growth · sell at horizon
- IRR
- -13.7%
- Equity multiple
- 0.51×
- Total profit
- $-29,724
- Equity at exit
- $32,057
- IRR
- -4.6%
- Equity multiple
- 0.70×
- Total profit
- $-18,307
- Equity at exit
- $18,589
Cash invested: $60,200 (down + closing). Projections, not guarantees.
Landlord ↔ Tenant lean methodology
- Overall (STATE)
- 62 Landlord-Friendly
- State Michigan
- 62 Landlord-Friendly · EVEN
- County
- — inherits STATE
- City
- — inherits STATE
ZIP-level market 48239
- Rents YoY
- 3.2%
- Active inventory
- 188
- Price-to-rent
- 10.3×
Monthly cashflow live
- Estimated rent
- $1,735 high interval (Pro) →
- Mortgage (P&I)
- −$1,127
- Tax from tax record
- −$79 /mo · $944/yr
- Insurance
- −$90
- HOA
- −$0
- Vacancy / Maint / Mgmt
- −$364
- Net cashflow
- $75
Break-even live
UW: 25.0% down · 7.5% · 30yr · 1.5% tax · 5.0% vac · 8.0% maint · 8.0% mgmt
Financing live
Cash to close
- Down payment
- $53,750
- Closing costs
- $6,450
- Reserves months
- —
- Total cash needed
- —
Loan-product check · same deal, 3 products live
Conventional
25% down · 7.5% · 30yr
- Down + closing
- —
- Monthly P&I
- —
- Monthly cashflow
- —
- DSCR
- —
- Eligible?
- —
Personal DTI + credit; lowest rate.
DSCR
20% down · 8.5% · 30yr
- Down + closing
- —
- Monthly P&I
- —
- Monthly cashflow
- —
- DSCR
- —
- Eligible?
- —
No personal income docs; deal must DSCR.
Hard money
10% down · 12.0% · 12mo
- Down + closing
- —
- Monthly P&I
- —
- Monthly cashflow
- —
- DSCR
- —
- Eligible?
- —
Short-term bridge; refi at stabilization.
Rent comps 9 comps
| Address | Beds | Baths | Sqft | Rent | $/sqft | DOM | Units | Dist |
|---|---|---|---|---|---|---|---|---|
| 12107 Centralia Redford, MI | 3.0 | 1.0 | 912 | $1,800 | $1.97 | 43d | 1 | 0.67mi |
| 8455 Robindale Ave Dearborn Heights, MI | 3.0 | 1.0 | 1100 | $1,750 | $1.59 | 4d | 1 | 0.98mi |
| 8402 Robindale Ave Dearborn Heights, MI | 3.0 | 1.0 | 1190 | $1,600 | $1.34 | 14d | 1 | 1.03mi |
| 27201 Canfield St W Dearborn Heights, MI | 1.0–2.0 | 1.0–2.0 | 852 | $1,499 | $1.76 | 1d | 22 | 1.14mi |
| 12097 Cavell St Livonia, MI | 3.0 | 1.0 | 985 | $1,200 | $1.22 | 1d | 1 | 1.15mi |
| 11726 Deering St Livonia, MI | 4.0 | 1.5 | 1248 | $2,125 | $1.70 | 1d | 1 | 1.16mi |
| 13231 Hemingway Redford, MI | 3.0 | 1.5 | 1074 | $1,700 | $1.58 | 16d | 1 | 1.35mi |
| 8187 Lenore St Dearborn Heights, MI | 2.0 | 1.0 | 768 | $1,550 | $2.02 | 43d | 1 | 1.37mi |
| 23851 Fullerton Ave Detroit, MI | 1.0–2.0 | 1.0 | 700 | $999 | $1.43 | 43d | 1 | 1.50mi |
Listing history 12 events
-
2026-06-17status $215,000 Pending 14 DOM
-
2026-06-17days on market $215,000 Active Under Contract 14 DOM
-
2026-06-16days on market $215,000 Active Under Contract 13 DOM
-
2026-06-15days on market $215,000 Active Under Contract 12 DOM
-
2026-06-13days on market $215,000 Active Under Contract 10 DOM
-
2026-06-09days on market $215,000 Active Under Contract 6 DOM
-
2026-06-08days on market $215,000 Active Under Contract 5 DOM
-
2026-06-07statusdays on market $215,000 Active Under Contract 4 DOM
-
2026-06-04statusdays on market $215,000 Active 1 DOM
-
2026-06-03days on market $215,000 Coming Soon 2 DOM
-
2026-06-02remarks 699-char remark
-
2026-06-02$215,000 Coming Soon 1 DOM
ⓘ Source: listings_history table (triggers on properties + properties_extension) + one-shot
backfill from property_details.listing_events for pre-trigger history.
Tax reassessment forecast MI · Partial reset (capped growth)
- Current annual tax
- $944 · $79/mo
- Projected year-2 tax
- $2,128 · $177/mo
- Expected delta
- +$1,183/yr (+$99/mo · 125.3%)
ⓘ Screening estimate from a state-policy table — verify with the county assessor before closing.
Climate risk First Street
- Flood 3/10 Moderate FEMA zone X (unshaded) · 20% chance over 30 yrs
- Wildfire 1/10 Low
- Heat 3/10 Moderate 7 d/yr ≥98°F today · 15 d/yr by 30 yrs out
- Wind 2/10 Low
- Air quality 3/10 Moderate 2 unhealthy d/yr today · 3 by 30 yrs out
Nearby sold comps map
Loading sold comps map…
Walkable amenities ~0.75 mi
Loading nearby amenities…
Taxation est. · year 1
- Rental income
- $20,820
- − Mortgage interest
- −$12,043
- − Property taxes
- −$944
- − Insurance
- −$1,075
- − Repairs & maintenance
- −$1,666
- − Management
- −$1,666
- − Depreciation
- −$6,255
- Taxable loss
- −$2,829
- Est. tax savings @ 24.0%
- +$679
- After-tax cash flow
- $1,577/yr
For passive investors: Depreciation is non-cash, so a rental often shows a tax loss while cash-flowing — sheltering income. Rental losses are passive: they offset passive income freely, and up to $25,000/yr can offset ordinary (W-2) income if you actively participate and your MAGI is under $100k (phasing out to $0 by $150k); unused losses carry forward. On sale, claimed depreciation is recaptured at up to 25%, and gains may owe capital-gains tax (a 1031 exchange can defer both). Figures are a year-1 estimate at your 24.0% rate — not tax advice; consult a CPA.
Schools (NCES district)
- District
- South Redford School District
- NCES district ID
- 2632280
- Math proficiency
- 11% ▼ -9.00%
- Reading proficiency
- 29% ▼ -7.00%
- Median HH income
- $52,775
- Composite
- 18.1/100
- National rank
- #8972
- State rank
- #455 of 540 in MI
Livability — Redford
No livability data for this city. (Only ~50 U.S. cities are tracked.)
Census & demographics
- County
- Wayne County · 1,562,939 people
- City population
- 36,976
- Metro
- Detroit-Warren-Dearborn, MI
- Population (ZIP)
- 36,976
- Household income
- $71,151
- Rent vs Own
- Severe rent burden
- 1052.0
Population outlook (Wayne County) Hauer SSP2
- Today (2025)
- 1,675,273 people
- By 2030
- 1,620,300 · -3.3%
- By 2040
- 1,502,341 · -10.3%
- By 2050
- 1,384,039 · -17.4%
- By 2075
- 1,124,592 · -32.9%
- By 2100
- 881,193 · -47.4%
Race, ethnicity, and origin ACS 2023
- Neighborhood character
- Majority Black (58%)
- Race & ethnicity
- Black 58% White 34% Hispanic / Latino 4% Two or more races 4%
- Common ancestry
- Romanian 7% Slovak 2% Lithuanian 2%
- Foreign-born
- 2% · Canada
- Languages at home
- 96% English-only · Spanish 1% Other Indo-European 1% Arabic 1%
Political lean MEDSL · Wayne
- 2024 margin
- Strong D (+29.0) · D 62.7% · R 33.7% · Other 3.6%
- 2008→2024 swing
- -20.5pp toward R · 2008: 49.5pp · 2024: 29.0pp
- All cycles
- 2024: D+29.0 2020: D+38.1 2016: D+37.3 2012: D+46.9 2008: D+49.5
Not yet ingested
- Civics
- —
Market trends
- HPI YoY
- ▼ -202.97%
- Current HPI
- 236.1136
- Rent YoY
- ▲ 3.25%
- Metro
- Detroit-Warren-Dearborn, MI
- State GDP YoY
- ▲ 1.37%
- F500 in state
- 28
Industry mix (Fortune 500 HQ in MI)
| Industry | F500 HQs | Revenue |
|---|---|---|
| Automotive Parts | 3 | $48B |
|
||
| Automotive | 2 | $372B |
|
||
| Chemicals | 1 | $45B |
|
||
| Automotive Retail | 1 | $29B |
|
||
| Healthcare / Medical Devices | 1 | $23B |
|
||
| Automotive Technology | 1 | $20B |
|
||
Price history
1 event — show timeline
- 2026-06-01 Coming Soon $215,000 MiRealSource-MiMLS
Property tax history
-6.4%/yrLatest (2025): $944 · -64.8% YoY. Source: county tax records.
Cash-flow waterfall
monthlySold comps — $/sqft
last 12 mo · ≤1 miLoading sold comps…