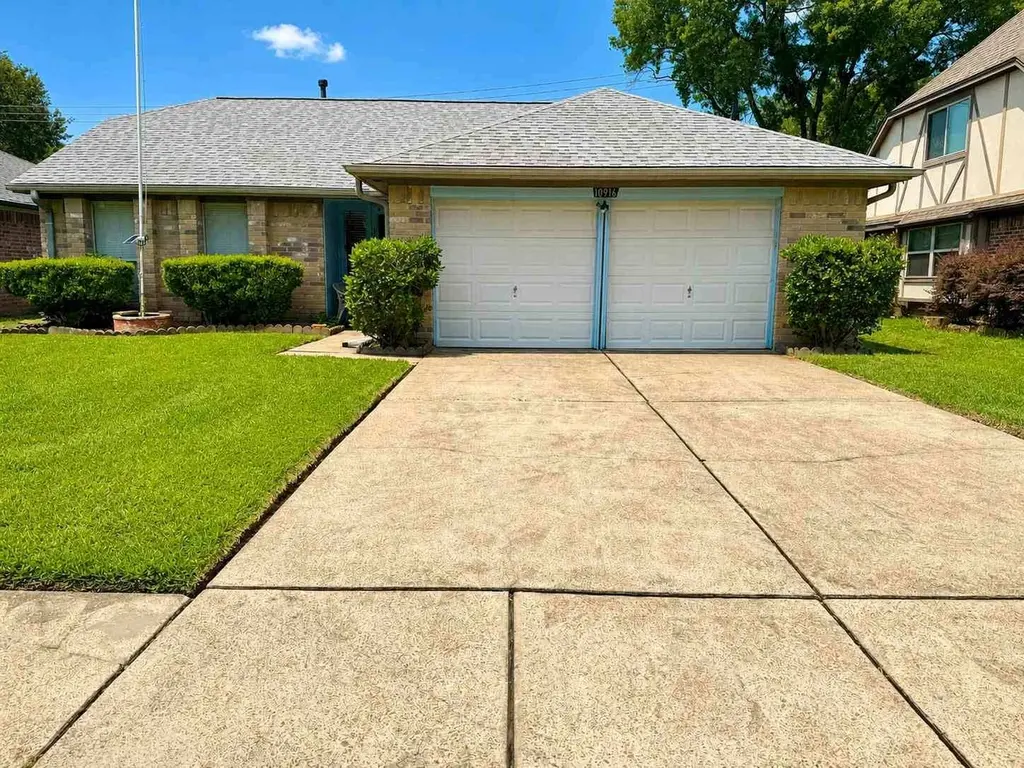
10916 Mulberry Ct · La Porte, TX
Flood risk 5/10 · Moderate
- FEMA flood zone
- X (unshaded)
- Chance of flooding over 30 yrs
- 0.65%
- Est. flood insurance / yr
- $507 – $1,088
Fire risk 2/10 · Minimal
- Est. fire insurance / yr
- $1,222 – $2,270
Heat risk 9/10 · Severe
- Hot days now (above 108°F)
- 7 days/yr
- Hot days in 30 yrs
- 26 days/yr
Wind risk 9/10 · Severe
- Chance of severe wind over 30 yrs
- 99.0%
Air-quality risk 2/10 · Minimal
- Unhealthy air days now
- 2 days/yr
- Unhealthy air days in 30 yrs
- 2 days/yr
Risk factors via First Street. Map © Google.
Why this score? — see what drove the C grade
The composite is a weighted blend of 9 inputs, each scored 0–100. Each bar is that input's sub-score; the figure is the points it added to the 100-point composite (weight × sub-score).
- Cash flow +19.2/30.0
- ARV discount +15.0/15.0
- 1% rule +6.7/10.0
- DSCR +6.1/10.0
- Schools +3.9/10.0
- Livability +3.5/5.0
- Rent growth +3.2/5.0
- Condition / age +2.5/5.0
- Appreciation +0.0/10.0
$190,000
🖨 Deal sheet 📄 Offer letter ✓ Due diligence
Listing remarks MLS
THIS IS A REALLY NICE HOME AND WELL MAINTAINED. IKE GOT THE FOLLOWING NEW THINGS FOR THE PROPERTY - ROOF, AIR CONDITIONER, ABOVE GROUND POOL, DECK ROOF, POOL DECKING. OTHER RECENT IMPROVEMENTS INCLUDE RANGE AND DISHWASHER. CARPETING IS PRETTY RECENT TOO. JUST NEED TO SEE IT. HAS A GREAT FLOOR PLAN WHICH MAKES IT FEEL LIKE A GOOD SIZE. IT HAS TWO FULL BATHS, BOTH WITH TUBS. CERAMIC TILE IN ALL THE WET AREAS AND CARPETING ELSEWHERE. YOU REALLY NEED TO SEE THIS ONE.
Key facts
- 2024 roof
- 2024 patio
- All appliances stay
Tags
Property features AI
Finance
- HOA & community: Association: Fairmont Park East; Annual association fee of $165
Exterior
- Parking: Attached garage with 2 spaces
- Utilities: Public water; Public sewer
- Home design: Residential property; Single-story (all main rooms listed on first floor); Entry on first floor
- Construction: Brick construction; Composition roof; Slab foundation; Built in 1985
- Exterior features: Subdivision lot; Lot approximately 0.1515 acres
Interior
- Kitchen: Kitchen on the first floor — 11x8
- Bedrooms: Primary bedroom (first floor) — 14x13; Bedroom (first floor) — 10x13; Bedroom (first floor) — 10x10; Total of 3 bedrooms
- Bathrooms: 2 full bathrooms
- Heating & cooling: Central heating (gas); Central electric air conditioning
- Interior features: Living room (first floor); Dining room (first floor); Kitchen (first floor); Seller disclosure available
Neighborhood map
What this means for you Summary
Snapshot
- This is a 3-bed/2.0-bath single-family listed at $190k.
Deal economics
- At list price, monthly cash flow is $204 ($2k/yr) — positive.
- The deal already cash-flows at list — no discount required.
- Meets the 1% rule at list price ($2k rent vs $190k).
- Recommended offer: $187k (1.5% below list) — sets the bar for market timing.
- Cap rate 7.6% vs local median 3.4% in La Porte — top-decile yield for the area; either an underpriced asset or a hidden risk that comps aren't pricing in. Stress-test before assuming the spread holds.
Location & tenants
- Location reads 70/100 on livability (#360 in TX) — a middle-class / working-renter tenant base. Strengths: cost of living A+, housing A+, crime A-; Watch: amenities F, commute F, health & safety F.
- La Porte ISD (suburban): math 41% / reading 44% proficiency, ranked #260 of 826 in TX (top 32%) — families likely to look elsewhere, expect single-tenant / working-renter base with shorter leases.
- Zoned schools: Leo A Rizzuto El (math 60% / reading 59%, grade B-, #409 of 4,322 statewide, top 10%, 382 students, 56% FRL); La Porte J H (math 41% / reading 43%, grade D-, #572 of 1,662 statewide, top 36%, 527 students, 65% FRL); La Porte H S (math 24% / reading 46%, grade F, #954 of 1,632 statewide, top 59%, 2,069 students, 51% FRL).
- Market conditions: Rents rising (+2.8%/yr); 337 active listings in the ZIP; 3 comparable units currently listed for rent nearby; rentals leasing fast (median 5d on market — plan ~1-2 weeks tenant-placement turnaround); solid renter incomes; 29,883 units permitted in Harris County in 2024 (8,621 in 5+ unit buildings).
- This rent runs 33% of the median local income ($82k/yr) — at the standard rent-burdened threshold; future hikes will face affordability resistance.
Forward outlook
- Local home prices are declining (-3.0%/yr); year-one equity from $1k of loan paydown is wiped out by about $6k of value loss. Plan a longer hold.
- Harris County population projected at +47% by 2050 — long-run rental-demand tailwind backs the buy-and-hold thesis.
Negotiation context
- It's been on market 17 days — a 2% lower offer ($187k) is reasonable based on typical stale-listing flexibility.
- 2 sale attempts since 15y ago; this cycle's ask has dropped $15k (7%) from the opening price — seller is motivated, your offer sets the floor, not the list.
- Current owner paid $66k; list at $190k implies a 189% gain — meaningful room to come down on a strong offer.
Risks & watch-outs
- Watch-outs: property tax is 2.9% of price.
- Climate carrying-cost: moderate flood risk; severe wind risk, 99% chance of damaging wind over 30y; extreme-heat days projected 7→26/yr by 2055 (HVAC capex compounding) — expect insurance premiums to compound above CPI over the hold.
Questions for the listing agent
- Property tax is high relative to price — has the assessment been appealed recently, and will the sale trigger a re-assessment?
- What does the HOA fee cover, when was the last increase, and are there any pending special assessments or reserve-fund shortfalls?
- Is there a deadline driving the sale (1031 exchange, divorce, estate, relocation)? That informs how much negotiation room exists.
- Schools are D-rated, which usually means shorter tenancies and higher turnover. Who's the typical renter profile here, and what's been the actual vacancy rate?
- What's the average days-on-market for RENTAL listings here right now (not sales)? A rising rental-DOM trend means longer vacancies and softer asking-rent achievability than the comps imply.
- What's the recent tenant-quality profile in this submarket — average credit score on applications, eviction rate, late-payment / NSF rate, and stable-employment percentage? A property-management company in the area should have these aggregated.
- How much new for-sale + rental construction is in the pipeline within 1–3 miles? Heavy new supply typically softens prices + rents 12–24 months out; constrained supply supports both.
Investment metrics
- 1% rule
- 1.17% ✓
- Cap rate
- 7.58%
- Cash-on-cash
- 4.61%
- DSCR
- 1.21
- GRM
- 7.1
CMA / ARV
- ARV (median comp)
- $243,454
- List price
- $190,000
- Delta
- -21.96%
- Verdict
- UNDERPRICED
- Comps
- 20 within 1.0 mi
Show comp detail 12 sales within ~0.75 mi
| Address | Dist | Beds/Ba | Sqft | Sold | Price | $/sf | Match |
|---|---|---|---|---|---|---|---|
| 10900 Mulberry Ct | 0.09mi | 3/2.0 | 1,223 (0%) | 16mo | $239,000 | $195 | 82 |
| 10850 E Idlewood Dr | 0.11mi | 3/2.0 | 1,304 (+7%) | 7mo | $280,000 | $215 | 78 |
| 10929 Birch Dr | 0.09mi | 3/2.0 | 1,304 (+7%) | 10mo | $260,000 | $199 | 77 |
| 10827 W Mulberry Dr | 0.24mi | 3/2.0 | 1,304 (+7%) | 3mo | $245,000 | $188 | 75 |
| 10824 W Mulberry Dr | 0.27mi | 3/2.0 | 1,304 (+7%) | 2mo | $259,900 | $199 | 75 |
| 10904 Mulberry Ct | 0.07mi | 3/2.0 | 1,304 (+7%) | 13mo | $265,000 | $203 | 75 |
| 10936 Collingswood Dr | 0.11mi | 3/2.0 | 1,304 (+7%) | 14mo | $240,000 | $184 | 72 |
| 10812 Collingswood Dr | 0.23mi | 3/2.0 | 1,304 (+7%) | 10mo | $258,000 | $198 | 70 |
| 10826 Birch Dr | 0.19mi | 4/2.0 (+1) | 1,385 (+13%) | 6mo | $264,000 | $191 | 59 |
| 10331 Collingswood Rd | 0.64mi | 3/2.0 | 1,374 (+12%) | 2mo | $244,950 | $178 | 48 |
| 10303 Winding Trail Rd | 0.73mi | 3/2.0 | 1,374 (+12%) | 9mo | $195,000 | $142 | 38 |
| 10334 Antrim Ln | 0.60mi | 3/1.5 | 1,397 (+14%) | 20mo | $219,999 | $157 | 30 |
Match score weights: distance 35% · size 25% · config 20% · recency 20%. Top-matched comps best support the ARV.
Projected returns pro-forma
-3.0% appreciation · 2.81% rent growth · sell at horizon
- IRR
- -9.3%
- Equity multiple
- 0.66×
- Total profit
- $-18,021
- Equity at exit
- $28,330
- IRR
- 0.0%
- Equity multiple
- 1.00×
- Total profit
- $59
- Equity at exit
- $16,428
Cash invested: $53,200 (down + closing). Projections, not guarantees.
Landlord ↔ Tenant lean methodology
- Overall (STATE)
- 87 Strongly Landlord-Friendly
- State Texas
- 87 Strongly Landlord-Friendly · R+5
- County
- — inherits STATE
- City
- — inherits STATE
ZIP-level market 77571
- Home prices YoY
- -28.9%
- Rents YoY
- 2.8%
- Active inventory
- 337
- Price-to-rent
- 7.1×
Monthly cashflow live
- Estimated rent
- $2,221 medium interval (Pro) →
- Mortgage (P&I)
- −$996
- Tax from tax record
- −$461 /mo · $5,533/yr
- Insurance
- −$79
- HOA
- −$14
- Vacancy / Maint / Mgmt
- −$467
- Net cashflow
- $204
Break-even live
UW: 25.0% down · 7.5% · 30yr · 1.5% tax · 5.0% vac · 8.0% maint · 8.0% mgmt
Financing live
Cash to close
- Down payment
- $47,500
- Closing costs
- $5,700
- Reserves months
- —
- Total cash needed
- —
Loan-product check · same deal, 3 products live
Conventional
25% down · 7.5% · 30yr
- Down + closing
- —
- Monthly P&I
- —
- Monthly cashflow
- —
- DSCR
- —
- Eligible?
- —
Personal DTI + credit; lowest rate.
DSCR
20% down · 8.5% · 30yr
- Down + closing
- —
- Monthly P&I
- —
- Monthly cashflow
- —
- DSCR
- —
- Eligible?
- —
No personal income docs; deal must DSCR.
Hard money
10% down · 12.0% · 12mo
- Down + closing
- —
- Monthly P&I
- —
- Monthly cashflow
- —
- DSCR
- —
- Eligible?
- —
Short-term bridge; refi at stabilization.
Rent comps 3 comps
| Address | Beds | Baths | Sqft | Rent | $/sqft | DOM | Units | Dist |
|---|---|---|---|---|---|---|---|---|
| 3300 Bay Area Blvd La Porte, TX | 1.0–3.0 | 1.0–2.0 | 1060 | $2,722 | $2.57 | 1d | 47 | 0.93mi |
| 4922 Crestway Dr La Porte, TX | 3.0 | 2.0 | 1465 | $2,155 | $1.47 | 5d | 1 | 0.95mi |
| 9999 Spencer Hwy La Porte, TX | 1.0–2.0 | 1.0–2.0 | 849 | $1,475 | $1.74 | 5d | 6 | 1.31mi |
HOA detail
- Monthly dues
- $14 · $168/yr
- Likely covers
- pool
Listing history 10 events
-
2026-05-11status Pending 430-char remark
-
2026-05-06price $190,000 430-char remark
-
2026-05-06$205,000 Active 430-char remark
-
2020-02-05soldstatus
-
2011-05-05soldstatus
-
2011-04-29soldstatus 475-char remark
Show marketing remark (475 chars)
THIS IS A REALLY NICE HOME AND WELL MAINTAINED. IKE GOT THE FOLLOWING NEW THINGS FOR THE PROPERTY - ROOF, AIR CONDITIONER, ABOVE GROUND POOL, DECK ROOF, POOL DECKING. OTHER RECENT IMPROVEMENTS INCLUDE RANGE AND DISHWASHER. CARPETING IS PRETTY RECENT TOO. JUST NEED TO SEE IT. HAS A GREAT FLOOR PLAN WHICH MAKES IT FEEL LIKE A GOOD SIZE. IT HAS TWO FULL BATHS, BOTH WITH TUBS. CERAMIC TILE IN ALL THE WET AREAS AND CARPETING ELSEWHERE. YOU REALLY NEED TO SEE THIS ONE.
-
2011-03-21historical 475-char remark
Show marketing remark (475 chars)
THIS IS A REALLY NICE HOME AND WELL MAINTAINED. IKE GOT THE FOLLOWING NEW THINGS FOR THE PROPERTY - ROOF, AIR CONDITIONER, ABOVE GROUND POOL, DECK ROOF, POOL DECKING. OTHER RECENT IMPROVEMENTS INCLUDE RANGE AND DISHWASHER. CARPETING IS PRETTY RECENT TOO. JUST NEED TO SEE IT. HAS A GREAT FLOOR PLAN WHICH MAKES IT FEEL LIKE A GOOD SIZE. IT HAS TWO FULL BATHS, BOTH WITH TUBS. CERAMIC TILE IN ALL THE WET AREAS AND CARPETING ELSEWHERE. YOU REALLY NEED TO SEE THIS ONE.
-
2011-01-28$119,900 475-char remark
Show marketing remark (475 chars)
THIS IS A REALLY NICE HOME AND WELL MAINTAINED. IKE GOT THE FOLLOWING NEW THINGS FOR THE PROPERTY - ROOF, AIR CONDITIONER, ABOVE GROUND POOL, DECK ROOF, POOL DECKING. OTHER RECENT IMPROVEMENTS INCLUDE RANGE AND DISHWASHER. CARPETING IS PRETTY RECENT TOO. JUST NEED TO SEE IT. HAS A GREAT FLOOR PLAN WHICH MAKES IT FEEL LIKE A GOOD SIZE. IT HAS TWO FULL BATHS, BOTH WITH TUBS. CERAMIC TILE IN ALL THE WET AREAS AND CARPETING ELSEWHERE. YOU REALLY NEED TO SEE THIS ONE.
-
2004-07-07soldstatus
-
1992-08-04soldstatus $65,800
ⓘ Source: listings_history table (triggers on properties + properties_extension) + one-shot
backfill from property_details.listing_events for pre-trigger history.
Tax reassessment forecast TX · Resets to sale price
- Current annual tax
- $5,533 · $461/mo
- Projected year-2 tax
- $5,533 · $461/mo
- Expected delta
- $0/yr ($0/mo · 0.0%)
ⓘ Screening estimate from a state-policy table — verify with the county assessor before closing.
Climate risk First Street
- Flood 5/10 Major FEMA zone X (unshaded) · 65% chance over 30 yrs
- Wildfire 2/10 Low
- Heat 9/10 Extreme 7 d/yr ≥108°F today · 26 d/yr by 30 yrs out
- Wind 9/10 Extreme 99% chance of damaging wind over 30 yrs
- Air quality 2/10 Low 2 unhealthy d/yr today · 2 by 30 yrs out
Nearby sold comps map
Loading sold comps map…
Walkable amenities ~0.75 mi
Loading nearby amenities…
Taxation est. · year 1
- Rental income
- $26,658
- − Mortgage interest
- −$10,643
- − Property taxes
- −$5,533
- − Insurance
- −$950
- − Repairs & maintenance
- −$2,133
- − Management
- −$2,133
- − HOA
- −$168
- − Depreciation
- −$5,527
- Taxable loss
- −$429
- Est. tax savings @ 24.0%
- +$103
- After-tax cash flow
- $2,555/yr
For passive investors: Depreciation is non-cash, so a rental often shows a tax loss while cash-flowing — sheltering income. Rental losses are passive: they offset passive income freely, and up to $25,000/yr can offset ordinary (W-2) income if you actively participate and your MAGI is under $100k (phasing out to $0 by $150k); unused losses carry forward. On sale, claimed depreciation is recaptured at up to 25%, and gains may owe capital-gains tax (a 1031 exchange can defer both). Figures are a year-1 estimate at your 24.0% rate — not tax advice; consult a CPA.
Schools (NCES district)
- District
- La Porte ISD
- NCES district ID
- 4826190
- Math proficiency
- 41% ▼ -10.00%
- Reading proficiency
- 44% ▼ -4.00%
- Median HH income
- $71,841
- Composite
- 38.65/100
- National rank
- #4151
- State rank
- #260 of 826 in TX
Livability — La Porte
- Score
- 70/100
- State rank
- #360
- US rank
- #7754
Category grades
Schools grade is shown separately in the Schools card above.
Census & demographics
- Census place
- La Porte, TX
- County
- Harris County · 4,702,590 people
- City population
- 38,543
- Metro
- Houston-The Woodlands-Sugar Land, TX
- Population (ZIP)
- 38,543
- Household income
- $81,850
- Rent vs Own
- Severe rent burden
- 1176.0
Population outlook (Harris County) Hauer SSP2
- Today (2025)
- 5,571,493 people
- By 2030
- 6,089,821 · +9.3%
- By 2040
- 7,142,806 · +28.2%
- By 2050
- 8,185,864 · +46.9%
- By 2075
- 10,574,329 · +89.8%
- By 2100
- 12,109,958 · +117.4%
Race, ethnicity, and origin ACS 2023
- Neighborhood character
- Diverse neighborhood (Simpson 0.60)
- Race & ethnicity
- White 51% Hispanic / Latino 36% Two or more races 20% Black 8% Asian 1%
- Hispanic origin (detail)
- Mexican 31%
- Common ancestry
- Italian 4% Lithuanian 3% Iranian 1%
- Foreign-born
- 10% · Canada, Vietnam
- Languages at home
- 77% English-only · Spanish 21% Other Indo-European 1%
Political lean MEDSL · Harris
- 2024 margin
- Lean D (+5.5) · D 52.0% · R 46.4% · Other 1.6%
- 2008→2024 swing
- +3.9pp toward D · 2008: 1.6pp · 2024: 5.5pp
- All cycles
- 2024: D+5.5 2020: D+13.3 2016: D+12.4 2012: D+0.1 2008: D+1.6
Not yet ingested
- Civics
- —
Market trends
- HPI YoY
- ▼ -103.81%
- Current HPI
- 255.0768
- Rent YoY
- ▲ 2.81%
- Metro
- Houston-The Woodlands-Sugar Land, TX
- State GDP YoY
- ▲ 3.95%
- F500 in state
- 110
Industry mix (Fortune 500 HQ in TX)
| Industry | F500 HQs | Revenue |
|---|---|---|
| Energy | 16 | $1,198B |
|
||
| Technology | 5 | $198B |
|
||
| Engineering / Construction | 4 | $72B |
|
||
| Energy Services | 3 | $60B |
|
||
| Utilities | 3 | $41B |
|
||
| Healthcare | 2 | $330B |
|
||
Price history
+188.8% since first listed11 events — show timeline
- 2026-05-24 Pending — HARMLS
- 2026-05-11 Pending — HARMLS
- 2026-05-06 Price Changed $190,000 HARMLS
- 2026-05-06 Listed $205,000 HARMLS
- 2020-02-05 Sold (Public Records) — Public Records
- 2011-05-05 Sold (Public Records) — Public Records
- 2011-04-29 Sold (MLS) — HARMLS
- 2011-03-21 Listing Removed — HARMLS
- 2011-01-28 Listed $119,900 HARMLS
- 2004-07-07 Sold (Public Records) — Public Records
- 1992-08-04 Sold (Public Records) $65,800 Public Records
Property tax history
+7.0%/yrLatest (2025): $5,533 · +5.1% YoY. Source: county tax records.
Cash-flow waterfall
monthlySold comps — $/sqft
last 12 mo · ≤1 miLoading sold comps…