 Multi-family
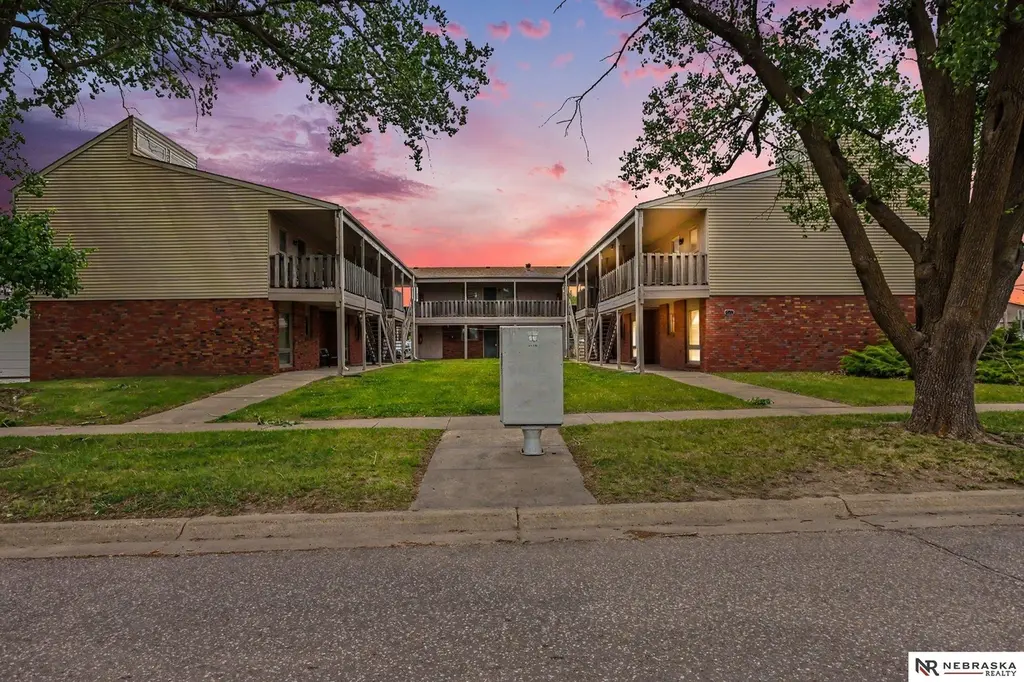
421 Capitol Beach Blvd · Lincoln, NE
Flood risk 1/10 · Minimal
- FEMA flood zone
- X (unshaded)
- Chance of flooding over 30 yrs
- 0.0%
- Est. flood insurance / yr
- $507 – $1,088
Fire risk 1/10 · Minimal
- Est. fire insurance / yr
- $1,161 – $2,155
Heat risk 3/10 · Minor
- Hot days now (above 106°F)
- 7 days/yr
- Hot days in 30 yrs
- 16 days/yr
Wind risk 2/10 · Minimal
- Chance of severe wind over 30 yrs
- —
Air-quality risk 1/10 · Minimal
- Unhealthy air days now
- 0 days/yr
- Unhealthy air days in 30 yrs
- 0 days/yr
Risk factors via First Street. Map © Google.
Why this score? — see what drove the B grade
The composite is a weighted blend of 9 inputs, each scored 0–100. Each bar is that input's sub-score; the figure is the points it added to the 100-point composite (weight × sub-score).
- Cash flow +30.0/30.0
- DSCR +10.0/10.0
- 1% rule +9.0/10.0
- ARV discount +7.5/15.0
- Schools +4.4/10.0
- Livability +4.2/5.0
- Rent growth +2.5/5.0
- Condition / age +2.5/5.0
- Appreciation +0.0/10.0
$1,295,000
🖨 Deal sheet 📄 Offer letter ✓ Due diligence
Multi-family units
County records classify this as Multi-Family (5+ Unit). Listing-text estimate: 1 unit. estimate disagrees with records
5+ unit building — per-unit beds/baths from public records are typically unavailable; the breakdown below (if shown) is an estimate from the listing text.
Listing remarks
13-unit value-add multifamily investment opportunity near Capitol Beach and downtown Lincoln. Unit mix consists of six 1-bedroom units, six 2-bedroom units, and one efficiency unit. Three vacant units provide immediate lease-up opportunity and upside potential. All units are all-electric with tenants responsible for electric service. Ownership pays water, sewer, and trash. Features include 22 off-street parking spaces, on-site laundry, storage units, slab-on-grade construction, and six zero-entry units. Majority month-to-month leases provide flexibility for repositioning rents to market levels. A landlord-managed Allo Internet program is in place and provides additional owner income. Offere
Key facts
- Storage units
- Near capitol beach
- On-site laundry
Tags
Property features AI
Finance
- Financial info: Residential income with 13 total units
Exterior
- Parking: Off-street parking; Total of 22 parking spaces; No attached garage
- Utilities: Public water; Public sewer; 13 electrical meters; 2 gas meters
- Home design: Residential income property (multi-family); Not new / not a model; One building with multiple units; Built in 1974; Entry level accessible
- Construction: Brick/other exterior construction; Slab foundation
- Exterior features: Zero-step entry; Level lot; Lot over 1/4 up to 1/2 acre
Interior
- Kitchen: Range; Refrigerator
- Bathrooms: 3 full bathrooms
- Heating & cooling: Natural gas forced-air heating; Multiple A/C units (12)
- Interior features: Zero-step entry; Exterior and interior accessibility features
- Laundry & utility: On-site laundry facilities
Neighborhood map
What this means for you Summary
Snapshot
- This is a 3-bed/3.0-bath multifamily listed at $1.29M.
Deal economics
- At list price, monthly cash flow is $6k ($72k/yr) — positive.
- The deal already cash-flows at list — no discount required.
- Meets the 1% rule at list price ($18k rent vs $1.29M).
- Cap rate 11.9% vs local median 3.0% in Lincoln — top-decile yield for the area; either an underpriced asset or a hidden risk that comps aren't pricing in. Stress-test before assuming the spread holds.
Location & tenants
- Location reads 85/100 on livability (#5 in NE, #545 nationally) — a professional / high-income tenant draw. Strengths: amenities A+, cost of living A+, housing A+; Watch: crime D+.
- Lincoln Public Schools (urban): math 50% / reading 53% proficiency, ranked #59 of 111 in NE (top 53%) — acceptable for families but not a draw, mixed tenant base, ~2y average lease.
- Zoned schools: Lakeview Elementary School (math 32% / reading 37%, grade F, #390 of 502 statewide, top 80%, 388 students, 75% FRL); Park Middle School (math 37% / reading 37%, grade F, #99 of 128 statewide, top 79%, 834 students, 68% FRL); Northwest High School (499 students, 52% FRL) — zoned schools average 65% FRL vs 37% district-wide (28 pts higher); higher-poverty schools than district average — tighter screening recommended.
- Zoned-school proficiency averages 36% at this address vs 52% district-wide (-16 pts) — the specific schools serving this property underperform the Lincoln Public Schools average; the district grade overstates school quality for this exact location.
- Market conditions: 43 active listings in the ZIP; solid renter incomes; 1,940 units permitted in Lancaster County in 2024 (895 in 5+ unit buildings).
- At $18,098/mo this rent would consume 287% of the median local household income ($76k/yr) (locally 225% of renters already pay >50% of income on rent) — very limited rent-growth headroom before tenants either downsize or default.
Forward outlook
- Local home prices are declining (-3.0%/yr); year-one equity from $9k of loan paydown is wiped out by about $39k of value loss. Plan a longer hold.
- Lancaster County population projected at +37% by 2050 — long-run rental-demand tailwind backs the buy-and-hold thesis.
- At projected returns (-3.0% appreciation + 3.0% rent growth), your $363k cash investment doubles in ~7 years — after that, you're playing with house money.
Negotiation context
- Only 13 days on market — expect competitive offers; lowballing is unlikely to land.
- Current owner paid $900k; 44% above their basis — modest negotiation headroom, anchor on the comps not their cost.
Questions for the listing agent
- Built in 1974 — when were the roof, HVAC, electrical panel, plumbing, and water heater last replaced?
- Is there a deadline driving the sale (1031 exchange, divorce, estate, relocation)? That informs how much negotiation room exists.
- Schools are A-rated — typically a magnet for longer-tenancy family renters. What's the average tenant stay here, and is there a school-zone premium baked into asking?
- Crime grade is D in this area — have there been break-ins, vandalism, or insurance claims at this property in the last 3 years? What carrier currently insures it and at what premium?
- What's the average days-on-market for RENTAL listings here right now (not sales)? A rising rental-DOM trend means longer vacancies and softer asking-rent achievability than the comps imply.
- What's the recent tenant-quality profile in this submarket — average credit score on applications, eviction rate, late-payment / NSF rate, and stable-employment percentage? A property-management company in the area should have these aggregated.
- How much new apartment / multifamily construction is in the pipeline within 1–3 miles? Heavy new supply (>2% of stock underway) typically softens rents 12–24 months out; light construction supports rent growth.
Investment metrics
- 1% rule
- 1.40% ✓
- Cap rate
- 11.85%
- Cash-on-cash
- 19.86%
- DSCR
- 1.88
- GRM
- 6.0
CMA / ARV
No comps found within radius.
Projected returns pro-forma
-3.0% appreciation · 3.0% rent growth · sell at horizon
- IRR
- 12.0%
- Equity multiple
- 1.47×
- Total profit
- $172,177
- Equity at exit
- $193,089
- IRR
- 20.9%
- Equity multiple
- 2.77×
- Total profit
- $641,491
- Equity at exit
- $111,968
Cash invested: $362,600 (down + closing). Projections, not guarantees.
Landlord ↔ Tenant lean methodology
- Overall (STATE)
- 83 Strongly Landlord-Friendly
- State Nebraska
- 83 Strongly Landlord-Friendly · R+13
- County
- — inherits STATE
- City
- — inherits STATE
ZIP-level market 68528
- Home prices YoY
- -34.8%
- Active inventory
- 43
- Price-to-rent
- 86.9×
Monthly cashflow live
- Estimated rent
- $18,098 medium interval (Pro) →
- Mortgage (P&I)
- −$6,791
- Tax from tax record
- −$967 /mo · $11,599/yr
- Insurance
- −$540
- HOA
- −$0
- Vacancy / Maint / Mgmt
- −$3,801
- Net cashflow
- $6,000
Break-even live
13-unit breakdown (identical units grouped — click to expand)
| Units | Beds | Baths | Est. rent |
|---|---|---|---|
| 6× units | 1 | 1 | $7,452 |
| #1 | 1 | 1 | $1,242 |
| #2 | 1 | 1 | $1,242 |
| #3 | 1 | 1 | $1,242 |
| #4 | 1 | 1 | $1,242 |
| #5 | 1 | 1 | $1,242 |
| #6 | 1 | 1 | $1,242 |
| 6× units | 2 | 1 | $9,324 |
| #7 | 2 | 1 | $1,554 |
| #8 | 2 | 1 | $1,554 |
| #9 | 2 | 1 | $1,554 |
| #10 | 2 | 1 | $1,554 |
| #11 | 2 | 1 | $1,554 |
| #12 | 2 | 1 | $1,554 |
| 1× unit | 0 | 1 | $1,324 |
| Total (13 units) | $18,098 | ||
UW: 25.0% down · 7.5% · 30yr · 1.5% tax · 5.0% vac · 8.0% maint · 8.0% mgmt
Financing live
Cash to close
- Down payment
- $323,750
- Closing costs
- $38,850
- Reserves months
- —
- Total cash needed
- —
Loan-product check · same deal, 3 products live
Conventional
25% down · 7.5% · 30yr
- Down + closing
- —
- Monthly P&I
- —
- Monthly cashflow
- —
- DSCR
- —
- Eligible?
- —
Personal DTI + credit; lowest rate.
DSCR
20% down · 8.5% · 30yr
- Down + closing
- —
- Monthly P&I
- —
- Monthly cashflow
- —
- DSCR
- —
- Eligible?
- —
No personal income docs; deal must DSCR.
Hard money
10% down · 12.0% · 12mo
- Down + closing
- —
- Monthly P&I
- —
- Monthly cashflow
- —
- DSCR
- —
- Eligible?
- —
Short-term bridge; refi at stabilization.
Listing history 10 events
-
2026-06-18days on market $1,295,000 Active 13 DOM
-
2026-06-17days on market $1,295,000 Active 12 DOM
-
2026-06-16days on market $1,295,000 Active 11 DOM
-
2026-06-15days on market $1,295,000 Active 10 DOM
-
2026-06-14days on market $1,295,000 Active 8 DOM
-
2026-06-10statusdays on market $1,295,000 Active 5 DOM
-
2026-06-09days on market $1,295,000 New 4 DOM
-
2026-06-08days on market $1,295,000 New 3 DOM
-
2026-06-07remarks 699-char remark
-
2026-06-07$1,295,000 New 2 DOM
ⓘ Source: listings_history table (triggers on properties + properties_extension) + one-shot
backfill from property_details.listing_events for pre-trigger history.
Tax reassessment forecast NE · Resets to sale price
- Current annual tax
- $11,599 · $967/mo
- Projected year-2 tax
- $22,404 · $1,867/mo
- Expected delta
- +$10,804/yr (+$900/mo · 93.1%)
ⓘ Screening estimate from a state-policy table — verify with the county assessor before closing.
Climate risk First Street
- Flood 1/10 Low FEMA zone X (unshaded) · 0% chance over 30 yrs
- Wildfire 1/10 Low
- Heat 3/10 Moderate 7 d/yr ≥106°F today · 16 d/yr by 30 yrs out
- Wind 2/10 Low
- Air quality 1/10 Low 0 unhealthy d/yr today · 0 by 30 yrs out
Nearby sold comps map
Loading sold comps map…
Walkable amenities ~0.75 mi
Loading nearby amenities…
Taxation est. · year 1
- Rental income
- $217,176
- − Mortgage interest
- −$72,540
- − Property taxes
- −$11,599
- − Insurance
- −$6,475
- − Repairs & maintenance
- −$17,374
- − Management
- −$17,374
- − Depreciation
- −$37,673
- Taxable income
- $54,141
- Est. tax owed @ 24.0%
- −$12,994
- After-tax cash flow
- $59,008/yr
For passive investors: Depreciation is non-cash, so a rental often shows a tax loss while cash-flowing — sheltering income. Rental losses are passive: they offset passive income freely, and up to $25,000/yr can offset ordinary (W-2) income if you actively participate and your MAGI is under $100k (phasing out to $0 by $150k); unused losses carry forward. On sale, claimed depreciation is recaptured at up to 25%, and gains may owe capital-gains tax (a 1031 exchange can defer both). Figures are a year-1 estimate at your 24.0% rate — not tax advice; consult a CPA.
Schools (NCES district)
- District
- Lincoln Public Schools
- NCES district ID
- 3172840
- Math proficiency
- 50% ▼ -6.00%
- Reading proficiency
- 53% ▼ -3.00%
- Median HH income
- $50,273
- Composite
- 44.05/100
- National rank
- #2880
- State rank
- #59 of 111 in NE
Livability — Lincoln
- Score
- 85/100
- State rank
- #5
- US rank
- #545
Category grades
Schools grade is shown separately in the Schools card above.
Census & demographics
- Census place
- Lincoln, NE
- County
- Lancaster County · 291,509 people
- City population
- 291,509
- Metro
- Lincoln, NE
- Population (ZIP)
- 7,273
- Household income
- $75,740
- Rent vs Own
- Severe rent burden
- 225.0
Population outlook (Lancaster County) Hauer SSP2
- Today (2025)
- 352,806 people
- By 2030
- 377,899 · +7.1%
- By 2040
- 428,582 · +21.5%
- By 2050
- 483,103 · +36.9%
- By 2075
- 632,390 · +79.2%
- By 2100
- 759,513 · +115.3%
Race, ethnicity, and origin ACS 2023
- Neighborhood character
- Predominantly White (76%)
- Race & ethnicity
- White 76% Hispanic / Latino 10% Two or more races 6% Asian 5% Black 5%
- Hispanic origin (detail)
- Mexican 6% Cuban 2%
- Common ancestry
- Slovak 3% Romanian 3% Iranian 2%
- Foreign-born
- 9% · Vietnam, Canada, China
- Languages at home
- 87% English-only · Spanish 4% Russian/Polish/Slavic 2% Vietnamese 2%
Political lean MEDSL · Lancaster
- 2024 margin
- Toss-up / Even · D 51.4% · R 47.1% · Other 1.5%
- 2008→2024 swing
- -0.7pp no change · 2008: 5.0pp · 2024: 4.3pp
- All cycles
- 2024: D+4.3 2020: D+7.8 2016: D+0.1 2012: R+1.0 2008: D+5.0
Not yet ingested
- Civics
- —
Market trends
- HPI YoY
- ▼ -126.10%
- Current HPI
- 235.7901
- Rent YoY
- —
- Metro
- Lincoln, NE
- State GDP YoY
- ▲ 0.68%
- F500 in state
- 2
Industry mix (Fortune 500 HQ in NE)
| Industry | F500 HQs | Revenue |
|---|---|---|
| Conglomerate | 1 | $371B |
|
||
Price history
+164.3% since first listed3 events — show timeline
- 2026-05-04 Listed $1,295,000 GPRMLS
- 2025-07-31 Sold (Public Records) $900,000 Public Records
- 2012-01-27 Sold (Public Records) $490,000 Public Records
Property tax history
+2.6%/yrLatest (2025): $11,599 · -3.3% YoY. Source: county tax records.
Cash-flow waterfall
monthlySold comps — $/sqft
last 12 mo · ≤1 miLoading sold comps…