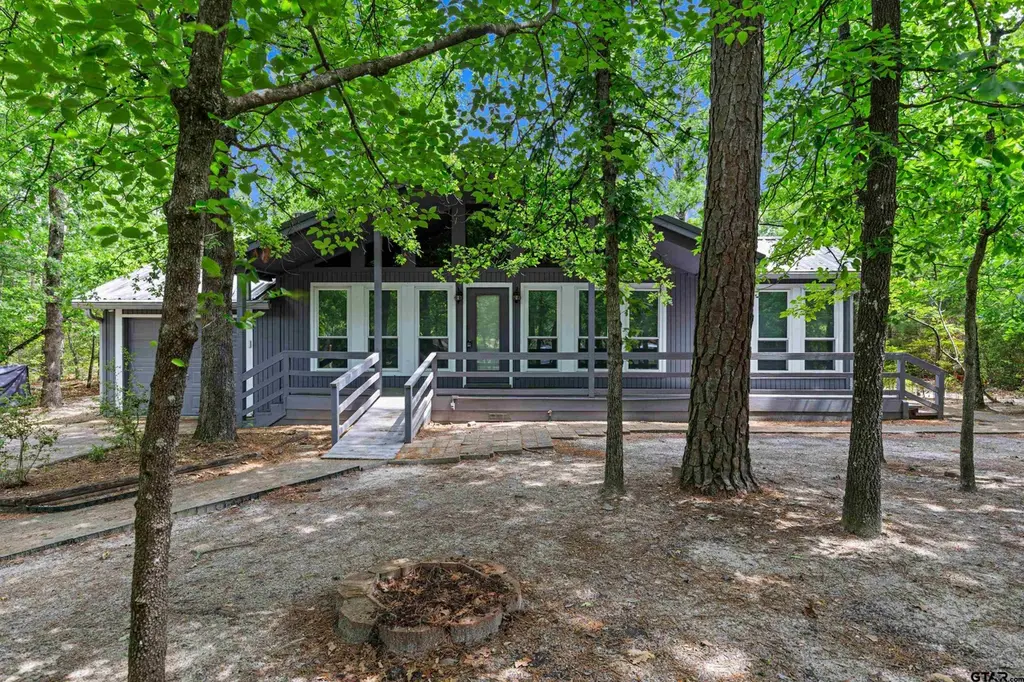
274 Wildwood Trl · Holly Lake Ranch, TX
Flood risk 1/10 · Minimal
- FEMA flood zone
- X (unshaded)
- Chance of flooding over 30 yrs
- 0.0%
- Est. flood insurance / yr
- $507 – $1,088
Fire risk 5/10 · Moderate
- Est. fire insurance / yr
- $1,222 – $2,270
Heat risk 6/10 · Moderate
- Hot days now (above 110°F)
- 7 days/yr
- Hot days in 30 yrs
- 23 days/yr
Wind risk 6/10 · Moderate
- Chance of severe wind over 30 yrs
- 50.0%
Air-quality risk 2/10 · Minimal
- Unhealthy air days now
- 1 days/yr
- Unhealthy air days in 30 yrs
- 1 days/yr
Risk factors via First Street. Map © Google.
Why this score? — see what drove the D grade
The composite is a weighted blend of 9 inputs, each scored 0–100. Each bar is that input's sub-score; the figure is the points it added to the 100-point composite (weight × sub-score).
- Cash flow +8.4/30.0
- ARV discount +8.0/15.0
- Appreciation +6.5/10.0
- Schools +4.0/10.0
- 1% rule +3.8/10.0
- Livability +3.3/5.0
- Rent growth +2.5/5.0
- Condition / age +2.5/5.0
- DSCR +2.3/10.0
$185,143
🖨 Deal sheet (PDF) 📄 Offer letter ✓ Due diligence
Listing remarks MLS
Private, wooded lot with a well-maintained home offering a functional, open layout and abundant natural light. The main living area features vaulted ceilings and large windows overlooking the trees. The kitchen is equipped with granite countertops and flows easily into the main living spaces. Throughout the home, light-filtering solar shades provide comfort and energy efficiency while still allowing in natural light. Upgrades include a metal roof, new windows, gutter helmets, and a whole-house generator (still under warranty)—offering added value and peace of mind. Exterior features include an attached garage, extended driveway for additional parking, and a front deck with ramp access. The wooded lot provides a quiet, private setting with space to enjoy the outdoors. A great option for buyers looking for privacy, practical upgrades, and move-in ready convenience.
Key facts
- Garage
- Built 1996
- Listed 39 days
Neighborhood map
What this means for you Summary
Snapshot
- This is a 2-bed/3.0-bath single-family listed at $185k.
Deal economics
- At list price, monthly cash flow is $-166 ($-2k/yr) — negative.
- To cash-flow at today's rent, offer at most $156k (15.9% below list).
- To meet the 1% rule (rent ≥ 1% of price), the offer needs to be $163k (12.2% below list).
- Recommended offer: $156k (15.9% below list) — sets the bar for cash-flow.
- Cap rate 5.2% vs local median 3.8% in Holly Lake Ranch — top-decile yield for the area; either an underpriced asset or a hidden risk that comps aren't pricing in. Stress-test before assuming the spread holds.
Location & tenants
- Location reads 66/100 on livability (#597 in TX) — a middle-class / working-renter tenant base. Strengths: crime A+, cost of living A+, housing A+; Watch: amenities F, commute F, health & safety D-.
- Harmony ISD (rural): math 48% / reading 47% proficiency, ranked #224 of 826 in TX (top 27%) — families likely to look elsewhere, expect single-tenant / working-renter base with shorter leases.
- Zoned schools: Harmony El (math 52% / reading 47%, grade D, #865 of 4,322 statewide, top 21%, 313 students, 62% FRL); Harmony J H (math 45% / reading 43%, grade D, #512 of 1,662 statewide, top 32%, 258 students, 46% FRL); Harmony H S (math 37% / reading 57%, grade D-, #591 of 1,632 statewide, top 38%, 282 students, 53% FRL).
- Market conditions: 219 active listings in the ZIP; 72 units permitted in Wood County in 2024 (29 in 5+ unit buildings).
Forward outlook
- In year one you build about $7k of equity ($1k loan paydown + $6k appreciation (3.1% local appreciation)).
- Wood County population projected at +12% by 2050 — modest demand growth; plan on rents tracking national, not racing it.
- By year 5, paydown + projected appreciation supports a ~$30k cash-out refi (75% LTV) — recoverable capital for the next deal without selling this one.
Negotiation context
- It's been on market 39 days — a 3% lower offer ($180k) is reasonable based on typical stale-listing flexibility.
Risks & watch-outs
- Climate carrying-cost: major wind risk, 50% chance of damaging wind over 30y; moderate wildfire risk; extreme-heat days projected 7→23/yr by 2055 (HVAC capex compounding) — expect insurance premiums to compound above CPI over the hold.
Questions for the listing agent
- What do current leases actually rent for vs. the listed asking? Can we see a recent rent roll and the last 12 months of T-12 income?
- It's been on market 39 days. Have you received any prior offers? Is the seller open to a 16% concession, seller financing, or rate buy-down credit?
- What does the HOA fee cover, when was the last increase, and are there any pending special assessments or reserve-fund shortfalls?
- Is there a deadline driving the sale (1031 exchange, divorce, estate, relocation)? That informs how much negotiation room exists.
- Schools are D-rated, which usually means shorter tenancies and higher turnover. Who's the typical renter profile here, and what's been the actual vacancy rate?
- The area grade is low — what's the realistic commute time and amenity access for the typical tenant pool here? Any planned neighborhood developments (good or bad) we should know about?
- What's the average days-on-market for RENTAL listings here right now (not sales)? A rising rental-DOM trend means longer vacancies and softer asking-rent achievability than the comps imply.
- What's the recent tenant-quality profile in this submarket — average credit score on applications, eviction rate, late-payment / NSF rate, and stable-employment percentage? A property-management company in the area should have these aggregated.
- How much new for-sale + rental construction is in the pipeline within 1–3 miles? Heavy new supply typically softens prices + rents 12–24 months out; constrained supply supports both.
Investment metrics
- 1% rule
- 0.88% ✗
- Cap rate
- 5.21%
- Cash-on-cash
- -3.85%
- DSCR
- 0.83
- GRM
- 9.5
CMA / ARV
- ARV (median comp)
- $187,301
- List price
- $185,143
- Delta
- -1.15%
- Verdict
- FAIR
- Comps
- 20 within 1.0 mi
Show comp detail 12 sales within ~0.75 mi
| Address | Dist | Beds/Ba | Sqft | Sold | Price | $/sf | Match |
|---|---|---|---|---|---|---|---|
| 167 Knollwood Ln | 0.22mi | 2/2.0 | 1,106 (+2%) | 14mo | $210,000 | $190 | 71 |
| 115 Primrose Path | 0.31mi | 2/2.0 | 1,124 (+3%) | 10mo | $182,000 | $162 | 68 |
| 142 Primrose Cv | 0.38mi | 2/2.0 | 986 (-9%) | 1mo | $134,000 | $136 | 62 |
| 132 Wild Rose Knl | 0.39mi | 2/2.0 | 986 (-9%) | 3mo | $165,000 | $167 | 60 |
| 154 Wild Rose Knl | 0.37mi | 2/2.0 | 1,150 (+6%) | 16mo | $238,000 | $207 | 56 |
| 746 Wildwood Trl | 0.47mi | 2/2.0 | 986 (-9%) | 3mo | $169,000 | $171 | 56 |
| 272 Alamosa Ln | 0.57mi | 2/2.0 | 1,116 (+3%) | 16mo | $210,000 | $188 | 52 |
| 138 Wildwood Trl | 0.16mi | 2/2.0 | 1,228 (+13%) | 18mo | $199,900 | $163 | 52 |
| 735 Wildwood Trl | 0.44mi | 2/2.0 | 1,240 (+14%) | 7mo | $215,000 | $173 | 46 |
| 802 Wildwood Trl | 0.55mi | 2/2.0 | 1,220 (+12%) | 10mo | $229,000 | $188 | 42 |
| 2332 Holly Trl E | 0.72mi | 2/2.0 | 1,248 (+15%) | 1mo | $195,000 | $156 | 37 |
| 253 Pagosa Ln | 0.60mi | 2/2.0 | 1,180 (+9%) | 21mo | $229,900 | $195 | 36 |
Match score weights: distance 35% · size 25% · config 20% · recency 20%. Top-matched comps best support the ARV.
Projected returns pro-forma
3.1% appreciation · 3.0% rent growth · sell at horizon
- IRR
- 4.3%
- Equity multiple
- 1.25×
- Total profit
- $12,785
- Equity at exit
- $84,256
- IRR
- 7.5%
- Equity multiple
- 2.15×
- Total profit
- $59,399
- Equity at exit
- $130,637
Cash invested: $51,840 (down + closing). Projections, not guarantees.
Landlord ↔ Tenant lean methodology
- Overall (STATE)
- 87 Strongly Landlord-Friendly
- State Texas
- 87 Strongly Landlord-Friendly · R+5
- County
- — inherits STATE
- City
- — inherits STATE
ZIP-level market 75765
- Home prices YoY
- 1.3%
- Active inventory
- 219
- Price-to-rent
- 9.5×
Monthly cashflow live
- Estimated rent
- $1,626 medium interval (Pro) →
- Mortgage (P&I)
- −$971
- Tax from tax record
- −$221 /mo · $2,649/yr
- Insurance
- −$77
- HOA
- −$182
- Vacancy / Maint / Mgmt
- −$341
- Net cashflow
- $-166
Break-even live
Sensitivity live
| Price | -10% $-62 | -5% $-114 | +0% $-166 | +5% $-219 | +10% $-271 |
|---|---|---|---|---|---|
| Rent | -10% $-295 | -5% $-231 | +0% $-166 | +5% $-102 | +10% $-38 |
| Rate | -1.0pp $-73 | -0.5pp $-119 | base $-166 | +0.5pp $-214 | +1.0pp $-263 |
UW: 25.0% down · 7.5% · 30yr · 1.5% tax · 5.0% vac · 8.0% maint · 8.0% mgmt
Financing live
Cash to close
- Down payment
- $46,286
- Closing costs
- $5,554
- Reserves months
- —
- Total cash needed
- —
Loan-product check · same deal, 3 products live
Conventional
25% down · 7.5% · 30yr
- Down + closing
- —
- Monthly P&I
- —
- Monthly cashflow
- —
- DSCR
- —
- Eligible?
- —
Personal DTI + credit; lowest rate.
DSCR
20% down · 8.5% · 30yr
- Down + closing
- —
- Monthly P&I
- —
- Monthly cashflow
- —
- DSCR
- —
- Eligible?
- —
No personal income docs; deal must DSCR.
Hard money
10% down · 12.0% · 12mo
- Down + closing
- —
- Monthly P&I
- —
- Monthly cashflow
- —
- DSCR
- —
- Eligible?
- —
Short-term bridge; refi at stabilization.
HOA detail
- Monthly dues
- $182 · $2,184/yr
Listing history 3 events
-
2026-04-17$185,143 Active 881-char remark
Show marketing remark (881 chars)
Private, wooded lot with a well-maintained home offering a functional, open layout and abundant natural light. The main living area features vaulted ceilings and large windows overlooking the trees. The kitchen is equipped with granite countertops and flows easily into the main living spaces. Throughout the home, light-filtering solar shades provide comfort and energy efficiency while still allowing in natural light. Upgrades include a metal roof, new windows, gutter helmets, and a whole-house generator (still under warranty)—offering added value and peace of mind. Exterior features include an attached garage, extended driveway for additional parking, and a front deck with ramp access. The wooded lot provides a quiet, private setting with space to enjoy the outdoors. A great option for buyers looking for privacy, practical upgrades, and move-in ready convenience.
-
2011-10-07soldstatus
-
2006-01-31soldstatus
ⓘ Source: listings_history table (triggers on properties + properties_extension) + one-shot
backfill from property_details.listing_events for pre-trigger history.
Tax reassessment forecast TX · Resets to sale price
- Current annual tax
- $2,649 · $221/mo
- Projected year-2 tax
- $3,388 · $282/mo
- Expected delta
- +$739/yr (+$62/mo · 27.9%)
ⓘ Screening estimate from a state-policy table — verify with the county assessor before closing.
Climate risk First Street
- Flood 1/10 Low FEMA zone X (unshaded) · 0% chance over 30 yrs
- Wildfire 5/10 Major
- Heat 6/10 Major 7 d/yr ≥110°F today · 23 d/yr by 30 yrs out
- Wind 6/10 Major 50% chance of damaging wind over 30 yrs
- Air quality 2/10 Low 1 unhealthy d/yr today · 1 by 30 yrs out
Nearby sold comps map
Loading sold comps map…
Walkable amenities ~0.75 mi
Loading nearby amenities…
Taxation est. · year 1
- Rental income
- $19,510
- − Mortgage interest
- −$10,371
- − Property taxes
- −$2,649
- − Insurance
- −$926
- − Repairs & maintenance
- −$1,561
- − Management
- −$1,561
- − HOA
- −$2,184
- − Depreciation
- −$5,386
- Taxable loss
- −$5,127
- Est. tax savings @ 24.0%
- +$1,230
- After-tax cash flow
- $-766/yr
For passive investors: Depreciation is non-cash, so a rental often shows a tax loss while cash-flowing — sheltering income. Rental losses are passive: they offset passive income freely, and up to $25,000/yr can offset ordinary (W-2) income if you actively participate and your MAGI is under $100k (phasing out to $0 by $150k); unused losses carry forward. On sale, claimed depreciation is recaptured at up to 25%, and gains may owe capital-gains tax (a 1031 exchange can defer both). Figures are a year-1 estimate at your 24.0% rate — not tax advice; consult a CPA.
Schools (NCES district)
- District
- Harmony ISD
- NCES district ID
- 4822560
- Math proficiency
- 48% ▲ 2.00%
- Reading proficiency
- 47% ▼ -4.00%
- Median HH income
- $47,303
- Composite
- 40.47/100
- National rank
- #3721
- State rank
- #224 of 826 in TX
Livability — Holly Lake Ranch
- Score
- 66/100
- State rank
- #597
- US rank
- #11377
Category grades
Schools grade is shown separately in the Schools card above.
Census & demographics
- Census place
- Holly Lake Ranch, TX
- Population (ZIP)
- 8,195
Population outlook (Wood County) Hauer SSP2
- Today (2025)
- 46,480 people
- By 2030
- 47,796 · +2.8%
- By 2040
- 50,142 · +7.9%
- By 2050
- 52,122 · +12.1%
- By 2075
- 57,033 · +22.7%
- By 2100
- 56,418 · +21.4%
Race, ethnicity, and origin ACS 2023
- Neighborhood character
- Predominantly White (79%)
- Race & ethnicity
- White 79% Black 12% Hispanic / Latino 6% Two or more races 5%
- Hispanic origin (detail)
- Mexican 5%
- Common ancestry
- Lithuanian 2% Slovak 2% Serbian 1%
- Foreign-born
- 1% · Canada
- Languages at home
- 95% English-only · Spanish 4%
Political lean MEDSL · Wood
- 2024 margin
- Solid R (+69.7) · D 14.8% · R 84.6%
- 2008→2024 swing
- -15.5pp toward R · 2008: -54.2pp · 2024: -69.7pp
- All cycles
- 2024: R+69.7 2020: R+68.2 2016: R+70.0 2012: R+64.2 2008: R+54.2
Not yet ingested
- Civics
- —
Market trends
- HPI YoY
- ▲ 3.10%
- Current HPI
- 236.7688
- Rent YoY
- —
- Metro
- —
- State GDP YoY
- ▲ 3.95%
- F500 in state
- 110
Industry mix (Fortune 500 HQ in TX)
| Industry | F500 HQs | Revenue |
|---|---|---|
| Energy | 16 | $1,198B |
|
||
| Technology | 5 | $198B |
|
||
| Engineering / Construction | 4 | $72B |
|
||
| Energy Services | 3 | $60B |
|
||
| Utilities | 3 | $41B |
|
||
| Healthcare | 2 | $330B |
|
||
Price history
3 events — show timeline
- 2026-04-17 Listed $185,143 GTAR
- 2011-10-07 Sold (Public Records) — Public Records
- 2006-01-31 Sold (Public Records) — Public Records
Property tax history
+6.2%/yrLatest (2025): $2,649 · +8.7% YoY. Source: county tax records.
Cash-flow waterfall
monthlySold comps — $/sqft
last 12 mo · ≤1 miLoading sold comps…