 🏷️ Likely Rental
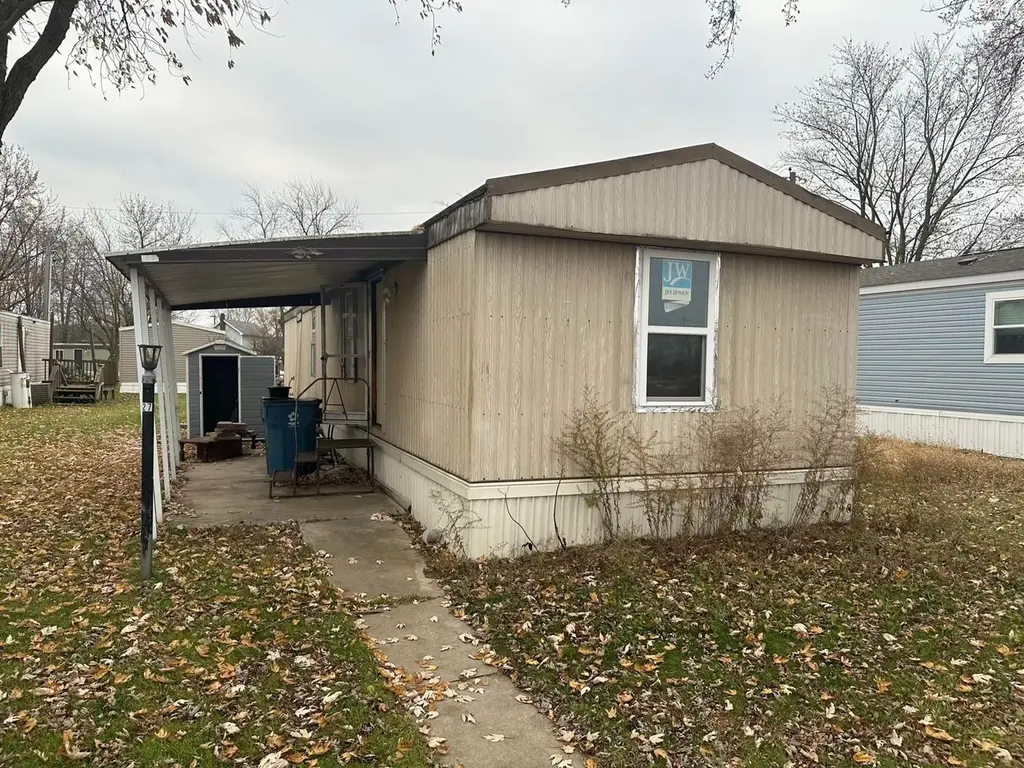
450 W Main St Unit N27 · Delta, OH
Flood risk No data
- FEMA flood zone
- —
- Chance of flooding over 30 yrs
- —
- Est. flood insurance / yr
- —
Fire risk No data
- Est. fire insurance / yr
- —
Heat risk No data
- Hot days now (above threshold)
- —
- Hot days in 30 yrs
- —
Wind risk No data
- Chance of severe wind over 30 yrs
- —
Air-quality risk No data
- Unhealthy air days now
- —
- Unhealthy air days in 30 yrs
- —
Risk factors via First Street. Map © Google.
Why this score? — see what drove the D+ grade
The composite is a weighted blend of 9 inputs, each scored 0–100. Each bar is that input's sub-score; the figure is the points it added to the 100-point composite (weight × sub-score).
- Cash flow +15.0/30.0
- ARV discount +7.5/15.0
- Schools +6.0/10.0
- 1% rule +5.0/10.0
- DSCR +5.0/10.0
- Livability +3.9/5.0
- Rent growth +2.5/5.0
- Condition / age +2.5/5.0
- Appreciation +0.0/10.0
$2,500
🖨 Deal sheet 📄 Offer letter ✓ Due diligence
Listing remarks
This 2-bedroom, 1-bathroom fixer-upper home in the Green Acres community in Delta, Ohio offers a great opportunity for buyers looking to renovate and customize their space. Built by Champion with the Mansion model, this home features a functional layout ready for updates and improvements. The property requires work throughout, making it ideal for buyers who want to create a home tailored to their preferences. With an affordable purchase price, this home provides a chance to build value through renovation. Located in Green Acres, residents enjoy a convenient Delta, OH location close to local amenities, shopping, and major roadways. This home is a great option for those seeking a budget-frien
Key facts
- Built 2026
- Listed 48 days
Neighborhood map
What this means for you Summary
Snapshot
- This is a 2-bed/1.0-bath single-family listed at $2k.
Deal economics
- At list price, monthly cash flow is $804 ($10k/yr) — positive.
- The deal already cash-flows at list — no discount required.
- Meets the 1% rule at list price ($1k rent vs $2k).
- Recommended offer: $2k (3.0% below list) — sets the bar for market timing.
- Cap rate 392.4% vs local median 4.5% in Delta — top-decile yield for the area; either an underpriced asset or a hidden risk that comps aren't pricing in. Stress-test before assuming the spread holds.
Location & tenants
- Location reads 77/100 on livability (#192 in OH, #2,924 nationally) — a middle-class / working-renter tenant base. Strengths: schools A+, crime A+, cost of living A+; Watch: amenities F, commute F, health & safety F.
- Pike-Delta-York Local (town): math 71% / reading 70% proficiency, ranked #142 of 656 in OH (top 22%) — strong family-tenant draw, lease renewals of 3-5y typical.
- Market conditions: 26 active listings in the ZIP; 3 comparable units currently listed for rent nearby; rentals at typical pace (median 21d on market — plan ~3-4 weeks tenant-placement turnaround); solid renter incomes; 24 units permitted in Fulton County in 2024 (0 in 5+ unit buildings).
- This rent is only 16% of the median local income ($78k/yr) — well below the 30% rent-burden line; pricing power to push rent on renewal without tenant pushback.
Forward outlook
- Local home prices are declining (-3.0%/yr); year-one equity from $17 of loan paydown is wiped out by about $75 of value loss. Plan a longer hold.
- Fulton County population projected at -14% by 2050 — secular population decline; favor cash flow + early exit over multi-decade hold.
- At projected returns (-3.0% appreciation + 3.0% rent growth), your $700 cash investment doubles in ~1 year — after that, you're playing with house money.
Negotiation context
- It's been on market 49 days — a 3% lower offer ($2k) is reasonable based on typical stale-listing flexibility.
Questions for the listing agent
- It's been on market 49 days. Have you received any prior offers? Is the seller open to a 3% concession, seller financing, or rate buy-down credit?
- Is there a deadline driving the sale (1031 exchange, divorce, estate, relocation)? That informs how much negotiation room exists.
- Schools are A-rated — typically a magnet for longer-tenancy family renters. What's the average tenant stay here, and is there a school-zone premium baked into asking?
- The area grade is low — what's the realistic commute time and amenity access for the typical tenant pool here? Any planned neighborhood developments (good or bad) we should know about?
- What's the average days-on-market for RENTAL listings here right now (not sales)? A rising rental-DOM trend means longer vacancies and softer asking-rent achievability than the comps imply.
- What's the recent tenant-quality profile in this submarket — average credit score on applications, eviction rate, late-payment / NSF rate, and stable-employment percentage? A property-management company in the area should have these aggregated.
- How much new for-sale + rental construction is in the pipeline within 1–3 miles? Heavy new supply typically softens prices + rents 12–24 months out; constrained supply supports both.
Investment metrics
- 1% rule
- 41.60% ✓
- Cap rate
- 392.37%
- Cash-on-cash
- 1378.85%
- DSCR
- 62.35
- GRM
- 0.2
CMA / ARV
- ARV (median comp)
- $156,589
- List price
- $2,500
- Delta
- -98.40%
- Verdict
- UNDERPRICED
- Comps
- 20 within 1.0 mi
Show comp detail 10 sales within ~0.75 mi
| Address | Dist | Beds/Ba | Sqft | Sold | Price | $/sf | Match |
|---|---|---|---|---|---|---|---|
| 613 Maplewood Ave | 0.25mi | 2/1.0 | 986 (-2%) | 11mo | $108,000 | $110 | 76 |
| 929 Linwood Ave | 0.51mi | 2/1.5 | 1,064 (+6%) | 3mo | $140,000 | $132 | 63 |
| 708 Fernwood Ave | 0.35mi | 3/1.0 (+1) | 1,004 (-0%) | 19mo | $173,500 | $173 | 62 |
| 908 Fernwood St | 0.48mi | 3/1.0 (+1) | 1,104 (+10%) | 6mo | $169,900 | $154 | 51 |
| 302 Jackson St | 0.51mi | 3/1.0 (+1) | 880 (-13%) | 1mo | $110,000 | $125 | 49 |
| 235 W Main St | 0.64mi | 3/1.0 (+1) | 1,015 (+1%) | 19mo | $105,000 | $103 | 48 |
| 800 Fernwood Ave | 0.39mi | 3/1.0 (+1) | 1,092 (+8%) | 18mo | $180,000 | $165 | 48 |
| 7 Hawthorne Dr | 0.54mi | 2/1.0 | 1,112 (+10%) | 15mo | $165,000 | $148 | 46 |
| 709 E Main St | 0.25mi | 3/2.0 (+1) | 1,158 (+15%) | 15mo | $165,000 | $142 | 42 |
| 308 Jackson St | 0.53mi | 3/1.0 (+1) | 864 (-14%) | 11mo | $125,000 | $145 | 37 |
Match score weights: distance 35% · size 25% · config 20% · recency 20%. Top-matched comps best support the ARV.
Projected returns pro-forma
-3.0% appreciation · 3.0% rent growth · sell at horizon
- IRR
- —
- Equity multiple
- 73.63×
- Total profit
- $50,839
- Equity at exit
- $373
- IRR
- —
- Equity multiple
- 158.57×
- Total profit
- $110,298
- Equity at exit
- $216
Cash invested: $700 (down + closing). Projections, not guarantees.
Landlord ↔ Tenant lean methodology
- Overall (STATE)
- 73 Landlord-Friendly
- State Ohio
- 73 Landlord-Friendly · R+6
- County
- — inherits STATE
- City
- — inherits STATE
ZIP-level market 43515
- Home prices YoY
- -14.4%
- Active inventory
- 26
- Price-to-rent
- 0.2×
Monthly cashflow live
- Estimated rent
- $1,040 medium interval (Pro) →
- Mortgage (P&I)
- −$13
- Tax est. 1.5%
- −$3 /mo · $38/yr
- Insurance
- −$1
- HOA
- −$0
- Vacancy / Maint / Mgmt
- −$218
- Net cashflow
- $804
Break-even live
UW: 25.0% down · 7.5% · 30yr · 1.5% tax · 5.0% vac · 8.0% maint · 8.0% mgmt
Financing live
Cash to close
- Down payment
- $625
- Closing costs
- $75
- Reserves months
- —
- Total cash needed
- —
Loan-product check · same deal, 3 products live
Conventional
25% down · 7.5% · 30yr
- Down + closing
- —
- Monthly P&I
- —
- Monthly cashflow
- —
- DSCR
- —
- Eligible?
- —
Personal DTI + credit; lowest rate.
DSCR
20% down · 8.5% · 30yr
- Down + closing
- —
- Monthly P&I
- —
- Monthly cashflow
- —
- DSCR
- —
- Eligible?
- —
No personal income docs; deal must DSCR.
Hard money
10% down · 12.0% · 12mo
- Down + closing
- —
- Monthly P&I
- —
- Monthly cashflow
- —
- DSCR
- —
- Eligible?
- —
Short-term bridge; refi at stabilization.
Rent comps 3 comps
| Address | Beds | Baths | Sqft | Rent | $/sqft | DOM | Units | Dist |
|---|---|---|---|---|---|---|---|---|
| 820 Delta AVE Delta, OH | 2.0 | 1.0 | 950 | $1,100 | $1.16 | 13d | 1 | 0.38mi |
| 1112 Oakview Dr Unit 1106 Delta, OH | 2.0 | 1.0 | 950 | $1,000 | $1.05 | 43d | 1 | 0.51mi |
| 1112 Oakview Dr Delta, OH | 2.0 | 1.0 | 950 | $1,000 | $1.05 | 21d | 1 | 0.51mi |
Listing history 10 events
-
2026-06-12days on market $2,500 Active 49 DOM
-
2026-06-09days on market $2,500 Active 46 DOM
-
2026-06-08days on market $2,500 Active 45 DOM
-
2026-06-08days on market $2,500 Active 44 DOM
-
2026-06-07days on market $2,500 Active 43 DOM
-
2026-06-04days on market $2,500 Active 40 DOM
-
2026-06-02days on market $2,500 Active 39 DOM
-
2026-06-01days on market $2,500 Active 38 DOM
-
2026-05-31days on market $2,500 Active 37 DOM
-
2026-04-25$2,500 Active 727-char remark
ⓘ Source: listings_history table (triggers on properties + properties_extension) + one-shot
backfill from property_details.listing_events for pre-trigger history.
Nearby sold comps map
Loading sold comps map…
Walkable amenities ~0.75 mi
Loading nearby amenities…
Taxation est. · year 1
- Rental income
- $12,480
- − Mortgage interest
- −$140
- − Property taxes
- −$38
- − Insurance
- −$12
- − Repairs & maintenance
- −$998
- − Management
- −$998
- − Depreciation
- −$73
- Taxable income
- $10,221
- Est. tax owed @ 24.0%
- −$2,453
- After-tax cash flow
- $7,199/yr
For passive investors: Depreciation is non-cash, so a rental often shows a tax loss while cash-flowing — sheltering income. Rental losses are passive: they offset passive income freely, and up to $25,000/yr can offset ordinary (W-2) income if you actively participate and your MAGI is under $100k (phasing out to $0 by $150k); unused losses carry forward. On sale, claimed depreciation is recaptured at up to 25%, and gains may owe capital-gains tax (a 1031 exchange can defer both). Figures are a year-1 estimate at your 24.0% rate — not tax advice; consult a CPA.
Schools (NCES district)
- District
- Pike-Delta-York Local
- NCES district ID
- 3904708
- Math proficiency
- 71% ▼ -8.00%
- Reading proficiency
- 70% ▼ -10.00%
- Median HH income
- $54,734
- Composite
- 60.24/100
- National rank
- #860
- State rank
- #142 of 656 in OH
Livability — Delta
- Score
- 77/100
- State rank
- #192
- US rank
- #2924
Category grades
Schools grade is shown separately in the Schools card above.
Census & demographics
- Census place
- Delta, OH
- County
- Fulton · 33,657 people
- Metro
- Toledo, OH
- Population (ZIP)
- 8,139
- Household income
- $77,654
- Rent vs Own
- Severe rent burden
- 3.9
Population outlook (Fulton County) Hauer SSP2
- Today (2025)
- 41,958 people
- By 2030
- 41,130 · -2.0%
- By 2040
- 38,760 · -7.6%
- By 2050
- 36,040 · -14.1%
- By 2075
- 30,793 · -26.6%
- By 2100
- 25,429 · -39.4%
Race, ethnicity, and origin ACS 2023
- Neighborhood character
- Predominantly White (89%)
- Race & ethnicity
- White 89% Hispanic / Latino 9% Two or more races 6% Native American 1%
- Hispanic origin (detail)
- Mexican 8%
- Common ancestry
- Romanian 5% Slovak 3% Lithuanian 2%
- Foreign-born
- 1% · Canada
- Languages at home
- 97% English-only · Spanish 3%
Political lean MEDSL · Fulton
- 2024 margin
- Solid R (+42.4) · D 28.4% · R 70.8%
- 2008→2024 swing
- -34.3pp toward R · 2008: -8.1pp · 2024: -42.4pp
- All cycles
- 2024: R+42.4 2020: R+39.8 2016: R+36.0 2012: R+13.2 2008: R+8.1
Not yet ingested
- Civics
- —
Market trends
- HPI YoY
- ▼ -36.56%
- Current HPI
- 217.8733
- Rent YoY
- —
- Metro
- —
- State GDP YoY
- ▲ 1.98%
- F500 in state
- 48
Industry mix (Fortune 500 HQ in OH)
| Industry | F500 HQs | Revenue |
|---|---|---|
| Insurance | 3 | $145B |
|
||
| Industrial Machinery | 3 | $49B |
|
||
| Financial Services | 3 | $24B |
|
||
| Consumer Goods | 2 | $93B |
|
||
| Aerospace / Defense | 2 | $47B |
|
||
| Utilities | 2 | $33B |
|
||
Cash-flow waterfall
monthlySold comps — $/sqft
last 12 mo · ≤1 miLoading sold comps…