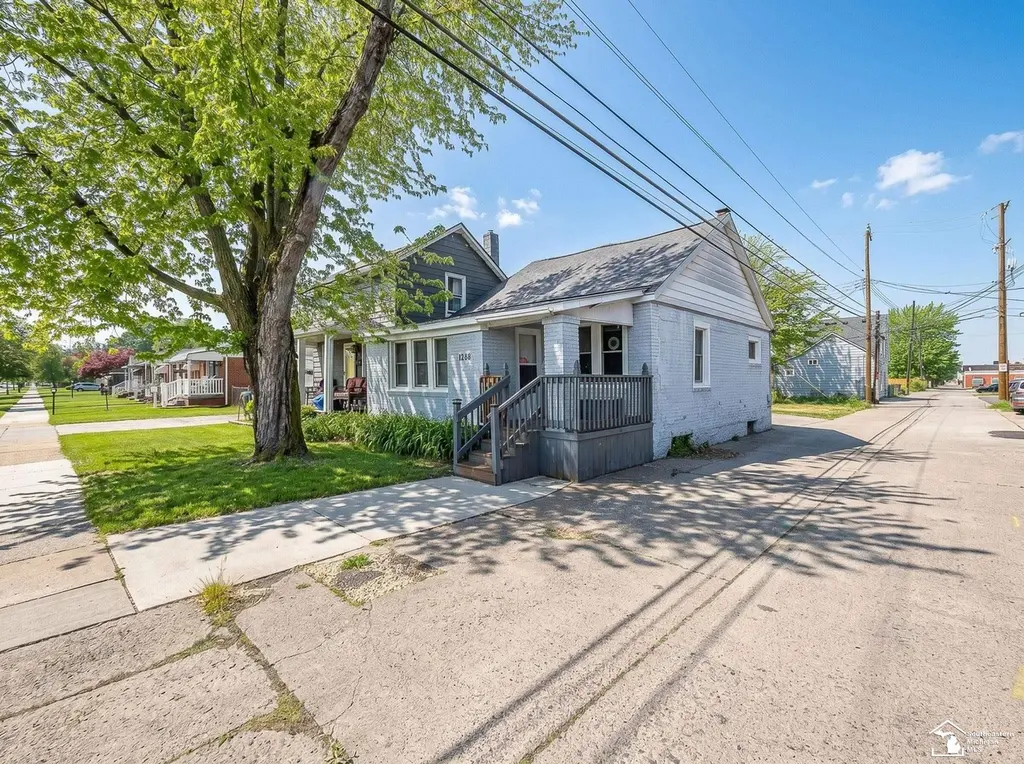
1288 Stewart Ave · Lincoln Park, MI
Flood risk 4/10 · Minor
- FEMA flood zone
- X (unshaded)
- Chance of flooding over 30 yrs
- 0.2%
- Est. flood insurance / yr
- $473 – $860
Fire risk 1/10 · Minimal
- Est. fire insurance / yr
- $784 – $1,456
Heat risk 3/10 · Minor
- Hot days now (above 97°F)
- 7 days/yr
- Hot days in 30 yrs
- 15 days/yr
Wind risk 2/10 · Minimal
- Chance of severe wind over 30 yrs
- —
Air-quality risk 3/10 · Minor
- Unhealthy air days now
- 3 days/yr
- Unhealthy air days in 30 yrs
- 5 days/yr
Risk factors via First Street. Map © Google.
Why this score? — see what drove the C- grade
The composite is a weighted blend of 9 inputs, each scored 0–100. Each bar is that input's sub-score; the figure is the points it added to the 100-point composite (weight × sub-score).
- ARV discount +15.0/15.0
- Cash flow +14.2/30.0
- 1% rule +4.8/10.0
- DSCR +4.3/10.0
- Livability +4.0/5.0
- Rent growth +3.7/5.0
- Condition / age +2.5/5.0
- Schools +2.0/10.0
- Appreciation +0.0/10.0
$99,000
🖨 Deal sheet 📄 Offer letter ✓ Due diligence
Listing remarks MLS
Say goodbye to apartment living and enjoy the comfort of having a place to truly call your own! This 1-bedroom, 1-bath home offers low-maintenance living with the cozy feel you’ve been looking for. Featuring newer windows, furnace, and roof, this home is perfect for first-time buyers, downsizers, or anyone ready to ditch shared walls and monthly rent payments.
Key facts
- Newer furnace
- Newer roof
- Newer windows
Tags
Property features AI
Finance
- Other: Subdivision: ASSRS FORT SUPERHIGHWAY SUB 11; Cross street: Fort / Stewart
- Financial info: Annual tax listed (details excluded per instructions)
- HOA & community: Property is part of a homeowners association
Exterior
- Parking: Attached garage with 1 garage space
- Utilities: Public water; Public sewer
- Home design: Single-family residence; One story
- Construction: Brick construction
- Exterior features: Lot dimensions approximately 26 x 100; Lot size about 0.06 acres
Interior
- Kitchen: Includes microwave, oven, refrigerator, range, dishwasher not listed
- Bedrooms: Total of 3 rooms (bedroom count not separately specified)
- Bathrooms: 1 full bathroom
- Heating & cooling: Forced air heating (natural gas); No cooling
- Interior features: Dryer, Washer, Microwave, Oven, Refrigerator, Range; Finished above-grade living area of 695 (one level); Basement
- Laundry & utility: Washer and dryer included
Neighborhood map
What this means for you Summary
Snapshot
- This is a 1-bed/1.0-bath single-family listed at $99k.
Deal economics
- At list price, monthly cash flow is $16 ($190/yr) — positive.
- The deal already cash-flows at list — no discount required.
- To meet the 1% rule (rent ≥ 1% of price), the offer needs to be $97k (2.5% below list).
- Recommended offer: $96k (3.0% below list) — sets the bar for market timing.
Location & tenants
- Location reads 80/100 on livability (#82 in MI, #1,720 nationally) — a professional / high-income tenant draw. Strengths: amenities A+, commute A+, cost of living A+; Watch: schools D-, crime F, employment D-.
- Lincoln Park School District (suburban): math 15% / reading 32% proficiency, ranked #440 of 540 in MI (top 82%) — low school quality limits family demand, transient renter base, plan for 1-2y turnover; 72% free/reduced lunch — lower-income household profile, screen leases tightly.
- Market conditions: Rents rising fast (+4.7%/yr); 151 active listings in the ZIP; 13 comparable units currently listed for rent nearby; rentals at typical pace (median 25d on market — plan ~3-4 weeks tenant-placement turnaround); 2,639 units permitted in Wayne County in 2024 (1,216 in 5+ unit buildings).
Forward outlook
- Local home prices are declining (-3.0%/yr); year-one equity from $684 of loan paydown is wiped out by about $3k of value loss. Plan a longer hold.
- Wayne County population projected at -17% by 2050 — secular population decline; favor cash flow + early exit over multi-decade hold.
Negotiation context
- It's been on market 31 days — a 3% lower offer ($96k) is reasonable based on typical stale-listing flexibility.
- 4 sale attempts since 3y ago with the ask held roughly flat each time — persistent listings suggest the price (not the market) is what's stuck; bring a comps-based counter.
- Current owner paid $85k; 16% above their basis — modest negotiation headroom, anchor on the comps not their cost.
Risks & watch-outs
- Watch-outs: built in 1923 — expect roof / HVAC / electrical / plumbing capex.
Questions for the listing agent
- It's been on market 31 days. Have you received any prior offers? Is the seller open to a 3% concession, seller financing, or rate buy-down credit?
- Built in 1923 — when were the roof, HVAC, electrical panel, plumbing, and water heater last replaced?
- Is there a deadline driving the sale (1031 exchange, divorce, estate, relocation)? That informs how much negotiation room exists.
- Schools are D-rated, which usually means shorter tenancies and higher turnover. Who's the typical renter profile here, and what's been the actual vacancy rate?
- Crime grade is F in this area — have there been break-ins, vandalism, or insurance claims at this property in the last 3 years? What carrier currently insures it and at what premium?
- What's the average days-on-market for RENTAL listings here right now (not sales)? A rising rental-DOM trend means longer vacancies and softer asking-rent achievability than the comps imply.
- What's the recent tenant-quality profile in this submarket — average credit score on applications, eviction rate, late-payment / NSF rate, and stable-employment percentage? A property-management company in the area should have these aggregated.
- How much new for-sale + rental construction is in the pipeline within 1–3 miles? Heavy new supply typically softens prices + rents 12–24 months out; constrained supply supports both.
Investment metrics
- 1% rule
- 0.98% ✗
- Cap rate
- 6.49%
- Cash-on-cash
- 0.69%
- DSCR
- 1.03
- GRM
- 8.5
CMA / ARV
- ARV (on-the-fly)
- $121,625
- Comps found
- 12
Show comp detail 12 sales within ~0.75 mi
| Address | Dist | Beds/Ba | Sqft | Sold | Price | $/sf | Match |
|---|---|---|---|---|---|---|---|
| 1404 Liberty Ave | 0.24mi | 2/1.0 (+1) | 682 (-2%) | 6mo | $124,000 | $182 | 76 |
| 1409 Capitol Ave | 0.23mi | 2/1.0 (+1) | 720 (+4%) | 4mo | $100,000 | $139 | 75 |
| — | 0.32mi | 2/1.0 (+1) | 729 (+5%) | 6mo | $80,000 | $110 | 67 |
| 1678 Gregory Ave | 0.45mi | 2/1.0 (+1) | 672 (-3%) | 3mo | $118,000 | $176 | 66 |
| 1771 Stewart Ave | 0.54mi | 2/1.0 (+1) | 700 (+1%) | 5mo | $75,000 | $107 | 64 |
| 1081 Mill St | 0.50mi | 2/1.0 (+1) | 672 (-3%) | 3mo | $133,000 | $198 | 63 |
| 1779 Progress Ave | 0.67mi | 2/1.0 (+1) | 690 (-1%) | 1mo | $121,000 | $175 | 62 |
| 1038 Detroit Ave | 0.34mi | 2/1.0 (+1) | 760 (+9%) | 3mo | $95,000 | $125 | 61 |
| 1770 Rose Ave | 0.70mi | 2/1.0 (+1) | 690 (-1%) | 3mo | $140,000 | $203 | 59 |
| 622 Mayflower Ave | 0.67mi | 2/1.0 (+1) | 681 (-2%) | 3mo | $126,000 | $185 | 58 |
| 754 Mill St | 0.69mi | 2/1.0 (+1) | 729 (+5%) | 6mo | $80,000 | $110 | 50 |
| 879 Highland Ave | 0.60mi | 2/1.0 (+1) | 764 (+10%) | 7mo | $129,900 | $170 | 45 |
Match score weights: distance 35% · size 25% · config 20% · recency 20%. Top-matched comps best support the ARV.
Projected returns pro-forma
-3.0% appreciation · 4.65% rent growth · sell at horizon
- IRR
- -13.1%
- Equity multiple
- 0.52×
- Total profit
- $-13,350
- Equity at exit
- $14,761
- IRR
- -1.6%
- Equity multiple
- 0.88×
- Total profit
- $-3,195
- Equity at exit
- $8,560
Cash invested: $27,720 (down + closing). Projections, not guarantees.
Landlord ↔ Tenant lean methodology
- Overall (STATE)
- 62 Landlord-Friendly
- State Michigan
- 62 Landlord-Friendly · EVEN
- County
- — inherits STATE
- City
- — inherits STATE
ZIP-level market 48146
- Home prices YoY
- -32.7%
- Rents YoY
- 4.7%
- Active inventory
- 151
- Price-to-rent
- 8.5×
Monthly cashflow live
- Estimated rent
- $965 high interval (Pro) →
- Mortgage (P&I)
- −$519
- Tax from tax record
- −$186 /mo · $2,237/yr
- Insurance
- −$41
- HOA
- −$0
- Vacancy / Maint / Mgmt
- −$203
- Net cashflow
- $16
Break-even live
UW: 25.0% down · 7.5% · 30yr · 1.5% tax · 5.0% vac · 8.0% maint · 8.0% mgmt
Financing live
Cash to close
- Down payment
- $24,750
- Closing costs
- $2,970
- Reserves months
- —
- Total cash needed
- —
Loan-product check · same deal, 3 products live
Conventional
25% down · 7.5% · 30yr
- Down + closing
- —
- Monthly P&I
- —
- Monthly cashflow
- —
- DSCR
- —
- Eligible?
- —
Personal DTI + credit; lowest rate.
DSCR
20% down · 8.5% · 30yr
- Down + closing
- —
- Monthly P&I
- —
- Monthly cashflow
- —
- DSCR
- —
- Eligible?
- —
No personal income docs; deal must DSCR.
Hard money
10% down · 12.0% · 12mo
- Down + closing
- —
- Monthly P&I
- —
- Monthly cashflow
- —
- DSCR
- —
- Eligible?
- —
Short-term bridge; refi at stabilization.
Rent comps 13 comps
| Address | Beds | Baths | Sqft | Rent | $/sqft | DOM | Units | Dist |
|---|---|---|---|---|---|---|---|---|
| 1324 Liberty Ave Unit 3 Lincoln Park, MI | 1.0 | 1.0 | 500 | $850 | $1.70 | 24d | 1 | 0.23mi |
| 1454 Goddard Rd Lincoln Park, MI | 1.0 | 1.0 | 750 | $950 | $1.27 | 5d | 1 | 0.97mi |
| 1750 Saint Johns Blvd Unit 17 Lincoln Park, MI | 2.0 | 1.0 | 750 | $1,025 | $1.37 | 24d | 1 | 1.01mi |
| 1760 Saint Johns Blvd Apt 14 Lincoln Park, MI | 2.0 | 1.0 | 750 | $995 | $1.33 | 24d | 1 | 1.02mi |
| 2201 London Lincoln Park, MI | 1.0 | 1.0 | 750 | $765 | $1.02 | 24d | 1 | 1.05mi |
| 1563 Wilson Ave Lincoln Park, MI | 1.0 | 1.0 | 750 | $895 | $1.19 | 5d | 1 | 1.06mi |
| 1583 Empire Ave Lincoln Park, MI | 1.0 | 1.0 | 700 | $1,050 | $1.50 | 24d | 1 | 1.09mi |
| 1537 Chandler Ave Lincoln Park, MI | 2.0 | 1.0 | 725 | $1,100 | $1.52 | 17d | 1 | 1.10mi |
| 4059 Longtin Ave Apt 1 Lincoln Park, MI | 1.0 | 1.0 | 750 | $950 | $1.27 | 5d | 1 | 1.17mi |
| 1308 Hanford Ave Apt 3 Lincoln Park, MI | 1.0 | 1.0 | 650 | $1,200 | $1.85 | 24d | 1 | 1.29mi |
| 1270 Electric Ave Lincoln Park, MI | 1.0 | 1.0 | 500 | $1,045 | $2.09 | 24d | 1 | 1.37mi |
| 1201 Fort St Lincoln Park, MI | 1.0 | 1.0 | 636 | $795 | $1.25 | 22d | 1 | 1.45mi |
| 800 Montie Rd Apt 12 Lincoln Park, MI | 1.0 | 1.0 | 700 | $1,000 | $1.43 | 24d | 1 | 1.45mi |
Listing history 22 events
-
2026-06-18days on market $99,000 Active 31 DOM
-
2026-06-17days on market $99,000 Active 30 DOM
-
2026-06-16days on market $99,000 Active 29 DOM
-
2026-06-15days on market $99,000 Active 28 DOM
-
2026-06-13days on market $99,000 Active 26 DOM
-
2026-06-13days on market $99,000 Active 25 DOM
-
2026-06-09days on market $99,000 Active 22 DOM
-
2026-06-08days on market $99,000 Active 21 DOM
-
2026-06-07days on market $99,000 Active 20 DOM
-
2026-06-04days on market $99,000 Active 17 DOM
-
2026-06-03days on market $99,000 Active 16 DOM
-
2026-06-02days on market $99,000 Active 15 DOM
-
2026-06-01days on market $99,000 Active 14 DOM
-
2026-05-31days on market $99,000 Active 13 DOM
-
2026-05-18$99,000 Active
Show marketing remark (368 chars)
Say goodbye to apartment living and enjoy the comfort of having a place to truly call your own! This 1-bedroom, 1-bath home offers low-maintenance living with the cozy feel you’ve been looking for. Featuring newer windows, furnace, and roof, this home is perfect for first-time buyers, downsizers, or anyone ready to ditch shared walls and monthly rent payments.
-
2026-05-18$99,000 Active 368-char remark
Show marketing remark (368 chars)
Say goodbye to apartment living and enjoy the comfort of having a place to truly call your own! This 1-bedroom, 1-bath home offers low-maintenance living with the cozy feel you’ve been looking for. Featuring newer windows, furnace, and roof, this home is perfect for first-time buyers, downsizers, or anyone ready to ditch shared walls and monthly rent payments.
-
2024-04-05soldstatus $85,000
-
2024-03-21historical
-
2024-03-21historical
-
2023-11-21$87,000 Active
-
2023-11-21$87,000 Active
-
1993-12-03soldstatus $15,000
ⓘ Source: listings_history table (triggers on properties + properties_extension) + one-shot
backfill from property_details.listing_events for pre-trigger history.
Tax reassessment forecast MI · Partial reset (capped growth)
- Current annual tax
- $2,237 · $186/mo
- Projected year-2 tax
- $2,237 · $186/mo
- Expected delta
- $0/yr ($0/mo · 0.0%)
ⓘ Screening estimate from a state-policy table — verify with the county assessor before closing.
Climate risk First Street
- Flood 4/10 Moderate FEMA zone X (unshaded) · 20% chance over 30 yrs
- Wildfire 1/10 Low
- Heat 3/10 Moderate 7 d/yr ≥97°F today · 15 d/yr by 30 yrs out
- Wind 2/10 Low
- Air quality 3/10 Moderate 3 unhealthy d/yr today · 5 by 30 yrs out
Nearby sold comps map
Loading sold comps map…
Walkable amenities ~0.75 mi
Loading nearby amenities…
Taxation est. · year 1
- Rental income
- $11,585
- − Mortgage interest
- −$5,546
- − Property taxes
- −$2,237
- − Insurance
- −$495
- − Repairs & maintenance
- −$927
- − Management
- −$927
- − Depreciation
- −$2,880
- Taxable loss
- −$1,426
- Est. tax savings @ 24.0%
- +$342
- After-tax cash flow
- $533/yr
For passive investors: Depreciation is non-cash, so a rental often shows a tax loss while cash-flowing — sheltering income. Rental losses are passive: they offset passive income freely, and up to $25,000/yr can offset ordinary (W-2) income if you actively participate and your MAGI is under $100k (phasing out to $0 by $150k); unused losses carry forward. On sale, claimed depreciation is recaptured at up to 25%, and gains may owe capital-gains tax (a 1031 exchange can defer both). Figures are a year-1 estimate at your 24.0% rate — not tax advice; consult a CPA.
Schools (NCES district)
- District
- Lincoln Park School District
- NCES district ID
- 2621600
- Math proficiency
- 15% ▼ -5.00%
- Reading proficiency
- 32% ▬ 0.00%
- Median HH income
- $41,486
- Composite
- 19.93/100
- National rank
- #8678
- State rank
- #440 of 540 in MI
Livability — Lincoln Park
- Score
- 80/100
- State rank
- #82
- US rank
- #1720
Category grades
Schools grade is shown separately in the Schools card above.
Census & demographics
- Census place
- Lincoln Park, MI
- County
- Wayne County · 1,562,939 people
- City population
- 39,257
- Metro
- Detroit-Warren-Dearborn, MI
- Population (ZIP)
- 39,257
- Household income
- $58,616
- Rent vs Own
- Severe rent burden
- 1142.0
Population outlook (Wayne County) Hauer SSP2
- Today (2025)
- 1,675,273 people
- By 2030
- 1,620,300 · -3.3%
- By 2040
- 1,502,341 · -10.3%
- By 2050
- 1,384,039 · -17.4%
- By 2075
- 1,124,592 · -32.9%
- By 2100
- 881,193 · -47.4%
Race, ethnicity, and origin ACS 2023
- Neighborhood character
- Diverse neighborhood (Simpson 0.57)
- Race & ethnicity
- White 60% Hispanic / Latino 25% Two or more races 12% Black 9% Native American 1%
- Hispanic origin (detail)
- Mexican 19% Puerto Rican 3%
- Common ancestry
- Romanian 6% Lithuanian 4% Slovak 1%
- Foreign-born
- 9% · Canada
- Languages at home
- 80% English-only · Spanish 17% Arabic 2%
Political lean MEDSL · Wayne
- 2024 margin
- Strong D (+29.0) · D 62.7% · R 33.7% · Other 3.6%
- 2008→2024 swing
- -20.5pp toward R · 2008: 49.5pp · 2024: 29.0pp
- All cycles
- 2024: D+29.0 2020: D+38.1 2016: D+37.3 2012: D+46.9 2008: D+49.5
Not yet ingested
- Civics
- —
Market trends
- HPI YoY
- ▼ -108.25%
- Current HPI
- 222.8545
- Rent YoY
- ▲ 4.65%
- Metro
- Detroit-Warren-Dearborn, MI
- State GDP YoY
- ▲ 1.37%
- F500 in state
- 28
Industry mix (Fortune 500 HQ in MI)
| Industry | F500 HQs | Revenue |
|---|---|---|
| Automotive Parts | 3 | $48B |
|
||
| Automotive | 2 | $372B |
|
||
| Chemicals | 1 | $45B |
|
||
| Automotive Retail | 1 | $29B |
|
||
| Healthcare / Medical Devices | 1 | $23B |
|
||
| Automotive Technology | 1 | $20B |
|
||
Price history
+560.0% since first listed8 events — show timeline
- 2026-05-18 Listed $99,000 REALCOMP
- 2026-05-18 Listed $99,000 MiRealSource-MiMLS
- 2024-04-05 Sold (Public Records) $85,000 Public Records
- 2024-03-21 Listing Removed — MiRealSource-MiMLS
- 2024-03-21 Listing Removed — REALCOMP
- 2023-11-21 Listed $87,000 MiRealSource-MiMLS
- 2023-11-21 Listed $87,000 REALCOMP
- 1993-12-03 Sold (Public Records) $15,000 Public Records
Property tax history
+5.1%/yrLatest (2025): $2,237 · +16.2% YoY. Source: county tax records.
Cash-flow waterfall
monthlySold comps — $/sqft
last 12 mo · ≤1 miLoading sold comps…