144 Carr Ln · Dentsville, SC
Flood risk No data
- FEMA flood zone
- —
- Chance of flooding over 30 yrs
- —
- Est. flood insurance / yr
- —
Fire risk No data
- Est. fire insurance / yr
- —
Heat risk No data
- Hot days now (above threshold)
- —
- Hot days in 30 yrs
- —
Wind risk No data
- Chance of severe wind over 30 yrs
- —
Air-quality risk No data
- Unhealthy air days now
- —
- Unhealthy air days in 30 yrs
- —
Risk factors via First Street. Map © Google.
Why this score? — see what drove the D- grade
The composite is a weighted blend of 9 inputs, each scored 0–100. Each bar is that input's sub-score; the figure is the points it added to the 100-point composite (weight × sub-score).
- Cash flow +10.8/30.0
- ARV discount +7.5/15.0
- 1% rule +4.3/10.0
- Condition / age +4.0/5.0
- Schools +3.6/10.0
- Livability +3.6/5.0
- DSCR +3.1/10.0
- Rent growth +2.6/5.0
- Appreciation +0.0/10.0
$190,999
🖨 Deal sheet 📄 Offer letter ✓ Due diligence
Listing remarks
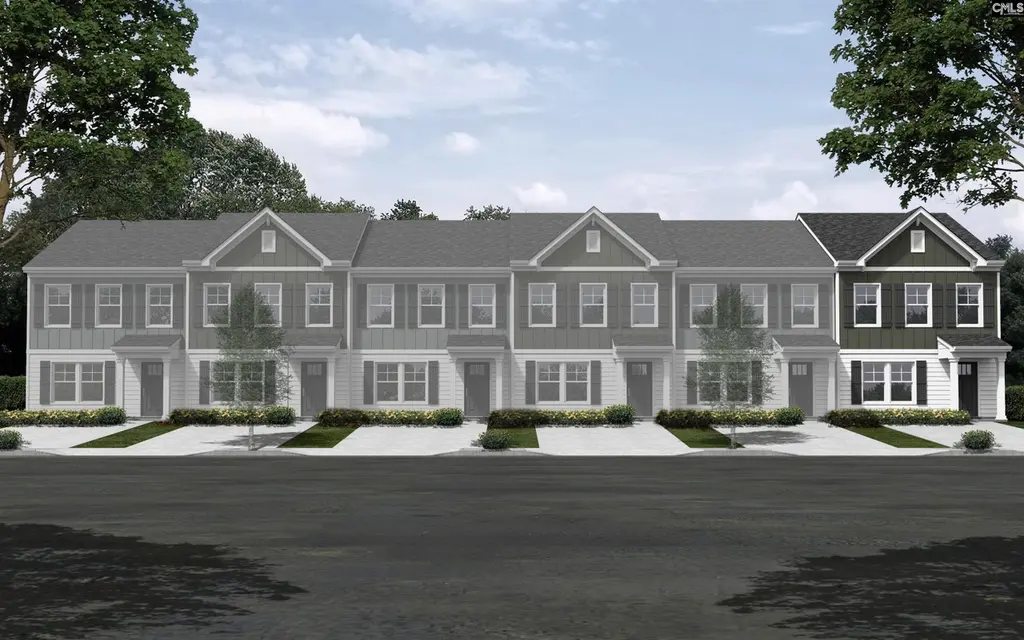
* * * ESTIMATED COMPLETION MID AUGUST * * * The Hickory is an efficient townhome plan with a large great room that allows for several great furniture arrangement options! A coat closet is thoughtfully included along with a nice powder bath and laundry closet with a stack unit. The kitchen allows for friends gathering at the peninsula or the ample dining area that overlooks the back patio. And, wow, a walk-in pantry is a nice surprise! The second-floor owner’s suite with walk-in closet and nice bathroom with a double vanity option is separated from the two secondary bedrooms at the rear of the home. A hall bath and linen closet are also included on the second floor. And don&rsqu
Key facts
- Laundry closet
- Powder bath
- Great room
Tags
Property features AI
Finance
- Other: Directions available: From I-77 N - Take exit 17 onto Two Notch Rd. Turn right onto Two Notch Rd. Travel .2 miles, then turn left onto N Grampian Hills Rd. Travel .6 miles, then turn right onto Legrand Dr. Travel .8 miles and turn right on Ross Rd; drive about .4 miles and community will be on the right.
- HOA & community: Property is part of an association
Exterior
- Parking: 2 parking spaces
- Utilities: Public water; Public sewer
- Home design: Lot number 153
- Construction: Slab foundation
- Exterior features: Vinyl exterior; Paved road access; Lot is approximately 0.1 acre
Interior
- Bedrooms: Master bedroom located on the second floor
- Bathrooms: Two full bathrooms; One partial bathroom; One main half bath
- Heating & cooling: Central heating; Central cooling
- Interior features: Total heated area approximately 1,290
Neighborhood map
What this means for you Summary
Snapshot
- This is a 3-bed/2.5-bath townhouse listed at $191k. Condition is rated good.
Deal economics
- At list price, monthly cash flow is $-89 ($-1k/yr) — negative.
- To cash-flow at today's rent, offer at most $178k (6.7% below list).
- To meet the 1% rule (rent ≥ 1% of price), the offer needs to be $177k (7.4% below list).
- Recommended offer: $177k (7.4% below list) — sets the bar for 1% rule.
Location & tenants
- Location reads 71/100 on livability (#50 in SC) — a middle-class / working-renter tenant base. Strengths: cost of living A+, health & safety A+, housing A; Watch: amenities D+, crime F, commute F.
- Richland 02 (suburban): math 35% / reading 47% proficiency, ranked #29 of 80 in SC (top 36%) — families likely to look elsewhere, expect single-tenant / working-renter base with shorter leases.
- Zoned schools: Windsor Elementary (math 21% / reading 23%, grade F, #475 of 597 statewide, top 81%, 537 students, 100% FRL); Westwood High (math 47% / reading 87%, grade B, #73 of 196 statewide, top 41%, 1,684 students, 66% FRL) — zoned schools average 83% FRL vs 38% district-wide (45 pts higher); higher-poverty schools than district average — tighter screening recommended.
- Market conditions: Rents flat; 341 active listings in the ZIP; 18 comparable units currently listed for rent nearby; rentals leasing fast (median 12d on market — plan ~1-2 weeks tenant-placement turnaround); 3,472 units permitted in Richland County in 2024 (1,096 in 5+ unit buildings).
- This rent runs 34% of the median local income ($62k/yr) — at the standard rent-burdened threshold; future hikes will face affordability resistance.
Forward outlook
- Local home prices are declining (-3.0%/yr); year-one equity from $1k of loan paydown is wiped out by about $6k of value loss. Plan a longer hold.
- Richland County population projected at +30% by 2050 — long-run rental-demand tailwind backs the buy-and-hold thesis.
Negotiation context
- It's been on market 56 days — a 3% lower offer ($185k) is reasonable based on typical stale-listing flexibility.
Questions for the listing agent
- What do current leases actually rent for vs. the listed asking? Can we see a recent rent roll and the last 12 months of T-12 income?
- It's been on market 56 days. Have you received any prior offers? Is the seller open to a 7% concession, seller financing, or rate buy-down credit?
- What does the HOA fee cover, when was the last increase, and are there any pending special assessments or reserve-fund shortfalls?
- Is there a deadline driving the sale (1031 exchange, divorce, estate, relocation)? That informs how much negotiation room exists.
- Schools are D-rated, which usually means shorter tenancies and higher turnover. Who's the typical renter profile here, and what's been the actual vacancy rate?
- Crime grade is F in this area — have there been break-ins, vandalism, or insurance claims at this property in the last 3 years? What carrier currently insures it and at what premium?
- The area grade is low — what's the realistic commute time and amenity access for the typical tenant pool here? Any planned neighborhood developments (good or bad) we should know about?
- What's the average days-on-market for RENTAL listings here right now (not sales)? A rising rental-DOM trend means longer vacancies and softer asking-rent achievability than the comps imply.
- What's the recent tenant-quality profile in this submarket — average credit score on applications, eviction rate, late-payment / NSF rate, and stable-employment percentage? A property-management company in the area should have these aggregated.
- How much new for-sale + rental construction is in the pipeline within 1–3 miles? Heavy new supply typically softens prices + rents 12–24 months out; constrained supply supports both.
Investment metrics
- 1% rule
- 0.93% ✗
- Cap rate
- 5.73%
- Cash-on-cash
- -2.00%
- DSCR
- 0.91
- GRM
- 9.0
CMA / ARV
No comps found within radius.
Projected returns pro-forma
-3.0% appreciation · 0.21% rent growth · sell at horizon
- IRR
- -23.1%
- Equity multiple
- 0.23×
- Total profit
- $-41,320
- Equity at exit
- $28,479
- IRR
- -29.2%
- Equity multiple
- -0.15×
- Total profit
- $-61,507
- Equity at exit
- $16,514
Cash invested: $53,480 (down + closing). Projections, not guarantees.
Landlord ↔ Tenant lean methodology
- Overall (STATE)
- 90 Strongly Landlord-Friendly
- State South Carolina
- 90 Strongly Landlord-Friendly · R+6
- County
- — inherits STATE
- City
- — inherits STATE
ZIP-level market 29223
- Rents YoY
- 0.2%
- Active inventory
- 341
- Price-to-rent
- 9.0×
Monthly cashflow live
- Estimated rent
- $1,770 high interval (Pro) →
- Mortgage (P&I)
- −$1,002
- Tax est. 1.5%
- −$239 /mo · $2,865/yr
- Insurance
- −$80
- HOA
- −$167
- Vacancy / Maint / Mgmt
- −$372
- Net cashflow
- $-89
Break-even live
UW: 25.0% down · 7.5% · 30yr · 1.5% tax · 5.0% vac · 8.0% maint · 8.0% mgmt
Financing live
Cash to close
- Down payment
- $47,750
- Closing costs
- $5,730
- Reserves months
- —
- Total cash needed
- —
Loan-product check · same deal, 3 products live
Conventional
25% down · 7.5% · 30yr
- Down + closing
- —
- Monthly P&I
- —
- Monthly cashflow
- —
- DSCR
- —
- Eligible?
- —
Personal DTI + credit; lowest rate.
DSCR
20% down · 8.5% · 30yr
- Down + closing
- —
- Monthly P&I
- —
- Monthly cashflow
- —
- DSCR
- —
- Eligible?
- —
No personal income docs; deal must DSCR.
Hard money
10% down · 12.0% · 12mo
- Down + closing
- —
- Monthly P&I
- —
- Monthly cashflow
- —
- DSCR
- —
- Eligible?
- —
Short-term bridge; refi at stabilization.
Rent comps 18 comps
| Address | Beds | Baths | Sqft | Rent | $/sqft | DOM | Units | Dist |
|---|---|---|---|---|---|---|---|---|
| 137 Carr Ln Columbia, SC | 3.0 | 2.5 | 1250 | $1,900 | $1.52 | 3d | 1 | 0.04mi |
| 2058 Mapleton Dr Columbia, SC | 3.0 | 2.5 | 1476 | $1,995 | $1.35 | 21d | 1 | 0.32mi |
| 237 Foxhunt Rd Columbia, SC | 3.0 | 1.5 | 1008 | $1,250 | $1.24 | 14d | 1 | 0.53mi |
| 1659 Legrand Rd Columbia, SC | 2.0–3.0 | 2.0–2.5 | 1450 | $2,500 | $1.72 | 3d | 12 | 0.77mi |
| 125 Charleswood Dr Columbia, SC | 3.0 | 1.0 | 1074 | $1,350 | $1.26 | 23d | 1 | 0.82mi |
| 113 Charleswood Dr Columbia, SC | 4.0 | 1.5 | 1196 | $1,555 | $1.30 | 3d | 1 | 0.84mi |
| 8100 Bayfield Rd Columbia, SC | 3.0 | 1.0–2.0 | 773 | $1,364 | $1.76 | 23d | 1 | 0.84mi |
| 1152 Rabon Pond Dr Columbia, SC | 3.0 | 2.5 | 1522 | $1,799 | $1.18 | 11d | 1 | 0.90mi |
| 381 Valley Heights Ln Columbia, SC | 3.0 | 2.5 | 1471 | $1,719 | $1.17 | 23d | 1 | 0.98mi |
| 712 Blazing Star Trl Columbia, SC | 3.0 | 2.0 | 1100 | $1,699 | $1.54 | 3d | 1 | 1.04mi |
| 207 Weddell St Unit 1D Columbia, SC | 2.0 | 2.0 | 1200 | $1,100 | $0.92 | 3d | 1 | 1.09mi |
| 500 Rockhaven Dr Columbia, SC | 3.0 | 2.0 | 1064 | $1,649 | $1.55 | 23d | 1 | 1.10mi |
| 1728 Springwoods Lake Dr Columbia, SC | 2.0 | 1.5 | 1025 | $1,200 | $1.17 | 3d | 1 | 1.12mi |
| 2250 Hard Scrabble Rd Columbia, SC | 1.0–3.0 | 1.0–2.0 | 1155 | $2,311 | $2.00 | 11d | 18 | 1.15mi |
| 109 Summer Vale Dr Columbia, SC | 4.0 | 2.5 | 1800 | $2,150 | $1.19 | 3d | 1 | 1.21mi |
| 1682 Horseshoe Dr Unit D Columbia, SC | 2.0 | 2.0 | 1000 | $895 | $0.90 | 14d | 1 | 1.23mi |
| 261 Business Park Blvd Columbia, SC | 1.0–3.0 | 1.0–2.0 | 1127 | $1,599 | $1.42 | 11d | 2 | 1.25mi |
| 1718 Horseshoe Dr Apt B Columbia, SC | 2.0 | 1.5 | 1050 | $1,300 | $1.24 | 11d | 1 | 1.31mi |
HOA detail
- Monthly dues
- $167 · $2,004/yr
Listing history 16 events
-
2026-06-18days on market $190,999 Active 56 DOM
-
2026-06-17days on market $190,999 Active 55 DOM
-
2026-06-16days on market $190,999 Active 54 DOM
-
2026-06-15days on market $190,999 Active 53 DOM
-
2026-06-14days on market $190,999 Active 51 DOM
-
2026-06-13days on market $190,999 Active 50 DOM
-
2026-06-10days on market $190,999 Active 48 DOM
-
2026-06-09days on market $190,999 Active 47 DOM
-
2026-06-08days on market $190,999 Active 46 DOM
-
2026-06-07days on market $190,999 Active 45 DOM
-
2026-06-05days on market $190,999 Active 42 DOM
-
2026-06-03days on market $190,999 Active 41 DOM
-
2026-06-03days on market $190,999 Active 40 DOM
-
2026-06-01days on market $190,999 Active 39 DOM
-
2026-05-31days on market $190,999 Active 38 DOM
-
2026-04-21$190,999 Active
ⓘ Source: listings_history table (triggers on properties + properties_extension) + one-shot
backfill from property_details.listing_events for pre-trigger history.
Nearby sold comps map
Loading sold comps map…
Walkable amenities ~0.75 mi
Loading nearby amenities…
Taxation est. · year 1
- Rental income
- $21,235
- − Mortgage interest
- −$10,699
- − Property taxes
- −$2,865
- − Insurance
- −$955
- − Repairs & maintenance
- −$1,699
- − Management
- −$1,699
- − HOA
- −$2,004
- − Depreciation
- −$5,556
- Taxable loss
- −$4,242
- Est. tax savings @ 24.0%
- +$1,018
- After-tax cash flow
- $-50/yr
For passive investors: Depreciation is non-cash, so a rental often shows a tax loss while cash-flowing — sheltering income. Rental losses are passive: they offset passive income freely, and up to $25,000/yr can offset ordinary (W-2) income if you actively participate and your MAGI is under $100k (phasing out to $0 by $150k); unused losses carry forward. On sale, claimed depreciation is recaptured at up to 25%, and gains may owe capital-gains tax (a 1031 exchange can defer both). Figures are a year-1 estimate at your 24.0% rate — not tax advice; consult a CPA.
Condition & rehab AI · 2 photos
This townhome is in good condition with a good condition score of 80. It is move-in ready with minimal cosmetic updates needed to enhance its resale and rental value.
Value-add opportunities
- Both Painting — Fresh paint can enhance curb appeal and interior aesthetics
- Both Landscaping — Enhanced landscaping can improve curb appeal and attract potential buyers
- Both Kitchen appliances — Upgrading appliances can increase the home's appeal and value
- Both Bathroom fixtures — Modernizing bathrooms can improve functionality and attract more buyers
Renovation cost estimate screening
Value-add ROI direction
- Both Painting — Fresh paint can enhance curb appeal and interior aesthetics ↑
- Both Landscaping — Enhanced landscaping can improve curb appeal and attract potential buyers ↑
- Both Kitchen appliances — Upgrading appliances can increase the home's appeal and value ↑
- Both Bathroom fixtures — Modernizing bathrooms can improve functionality and attract more buyers ↑
ⓘ Cost ranges are severity-bucket heuristics (US national rule-of-thumb). Get contractor quotes + a written scope before underwriting a rehab budget.
Schools (NCES district)
- District
- Richland 02
- NCES district ID
- 4503390
- Math proficiency
- 35% ▼ -15.00%
- Reading proficiency
- 47% ▼ -5.00%
- Median HH income
- $59,684
- Composite
- 36.2/100
- National rank
- #4730
- State rank
- #29 of 80 in SC
Livability — Dentsville
- Score
- 71/100
- State rank
- #50
- US rank
- #6940
Category grades
Schools grade is shown separately in the Schools card above.
Census & demographics
- County
- Richland County · 389,530 people
- City population
- 335,994
- Metro
- Columbia, SC
- Population (ZIP)
- 53,074
- Household income
- $62,408
- Rent vs Own
- Severe rent burden
- 2857.0
Population outlook (Richland County) Hauer SSP2
- Today (2025)
- 459,667 people
- By 2030
- 487,524 · +6.1%
- By 2040
- 542,035 · +17.9%
- By 2050
- 595,371 · +29.5%
- By 2075
- 732,998 · +59.5%
- By 2100
- 820,415 · +78.5%
Race, ethnicity, and origin ACS 2023
- Neighborhood character
- Diverse neighborhood (Simpson 0.60)
- Race & ethnicity
- Black 57% White 23% Hispanic / Latino 11% Two or more races 6% Asian 4%
- Hispanic origin (detail)
- Mexican 5% Puerto Rican 2%
- Common ancestry
- Slovak 1% Serbian 1% Italian 1%
- Foreign-born
- 10% · Canada, South Korea
- Languages at home
- 86% English-only · Spanish 8% Other Indo-European 2% Korean 1%
Political lean MEDSL · Richland
- 2024 margin
- Solid D (+34.6) · D 66.4% · R 31.8% · Other 1.8%
- 2008→2024 swing
- +5.7pp toward D · 2008: 28.9pp · 2024: 34.6pp
- All cycles
- 2024: D+34.6 2020: D+38.3 2016: D+32.9 2012: D+33.3 2008: D+28.9
Not yet ingested
- Civics
- —
Market trends
- HPI YoY
- ▼ -135.96%
- Current HPI
- 195.3158
- Rent YoY
- ▲ 0.21%
- Metro
- Columbia, SC
- State GDP YoY
- ▲ 4.51%
- F500 in state
- 2
Industry mix (Fortune 500 HQ in SC)
| Industry | F500 HQs | Revenue |
|---|---|---|
| Packaging | 1 | $7B |
|
||
Price history
1 event — show timeline
- 2026-04-21 Listed $190,999 Consolidated MLS
Cash-flow waterfall
monthlySold comps — $/sqft
last 12 mo · ≤1 miLoading sold comps…