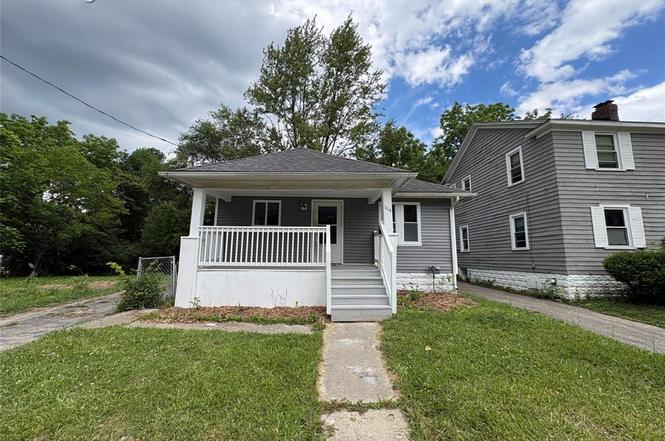
1114 Christopher St · Flint, MI
Flood risk 1/10 · Minimal
- FEMA flood zone
- X (unshaded)
- Chance of flooding over 30 yrs
- 0.0%
- Est. flood insurance / yr
- $473 – $860
Fire risk 1/10 · Minimal
- Est. fire insurance / yr
- $784 – $1,456
Heat risk 2/10 · Minimal
- Hot days now (above 97°F)
- 7 days/yr
- Hot days in 30 yrs
- 15 days/yr
Wind risk 2/10 · Minimal
- Chance of severe wind over 30 yrs
- —
Air-quality risk 3/10 · Minor
- Unhealthy air days now
- 3 days/yr
- Unhealthy air days in 30 yrs
- 4 days/yr
Risk factors via First Street. Map © Google.
Why this score? — see what drove the C grade
The composite is a weighted blend of 9 inputs, each scored 0–100. Each bar is that input's sub-score; the figure is the points it added to the 100-point composite (weight × sub-score).
- Cash flow +28.7/30.0
- DSCR +10.0/10.0
- 1% rule +7.7/10.0
- Rent growth +5.0/5.0
- Livability +3.7/5.0
- Condition / age +2.5/5.0
- Schools +1.1/10.0
- ARV discount +0.0/15.0
- Appreciation +0.0/10.0
$78,500
🖨 Deal sheet 📄 Offer letter ✓ Due diligence
Listing remarks MLS
Two-bedroom, one-bath home located at the end of a quiet dead-end street. Features an unfinished basement offering excellent potential for storage. Conveniently located near Eisenhower Elementary School. With a little vision and updating, this home presents a great opportunity for an investment property or make it your own. Ideal for investors or buyers looking for a project in a peaceful setting.
Key facts
- Fully fenced
- Front porch
- Double lot
Tags
Property features AI
Finance
- Other: Lot size approximately 0.22 acres; Frontage approximately 90 feet; Located in the City of Flint, Becker Heights Add subdivision
Exterior
- Utilities: Public water
- Home design: Residential, single-story home; Built in 1928; Basement entry level
- Construction: Vinyl siding; Basement foundation; Below-grade area listed (832)
- Exterior features: Front porch; Paved street access
Interior
- Bedrooms: Two bedrooms on the entry level (approx. 10 x 11 and 11 x 11)
- Bathrooms: One full bathroom on the entry level
- Heating & cooling: Forced air heating; Natural gas heat
- Interior features: 3 total rooms; Unfinished basement
Neighborhood map
What this means for you Summary
Snapshot
- This is a 2-bed/1.0-bath single-family listed at $78k.
Deal economics
- At list price, monthly cash flow is $261 ($3k/yr) — positive.
- The deal already cash-flows at list — no discount required.
- Meets the 1% rule at list price ($1k rent vs $78k).
Location & tenants
- Location reads 74/100 on livability (#196 in MI, #4,946 nationally) — a middle-class / working-renter tenant base. Strengths: commute A+, cost of living A+, housing A+; Watch: schools F, crime F, employment F.
- Flint School District (urban): math 7% / reading 13% proficiency, ranked #714 of 760 in MI (top 94%) — low school quality limits family demand, transient renter base, plan for 1-2y turnover; 83% free/reduced lunch — lower-income household profile, screen leases tightly.
- Market conditions: Rents rising fast (+12.3%/yr); 135 active listings in the ZIP; 9 comparable units currently listed for rent nearby; rentals at typical pace (median 21d on market — plan ~3-4 weeks tenant-placement turnaround); lower-income renter base — watch delinquency; 419 units permitted in Genesee County in 2024 (68 in 5+ unit buildings).
Forward outlook
- Local home prices are declining (-3.0%/yr); year-one equity from $543 of loan paydown is wiped out by about $2k of value loss. Plan a longer hold.
- Genesee County population projected at -27% by 2050 — secular population decline; favor cash flow + early exit over multi-decade hold.
- At projected returns (-3.0% appreciation + 8.0% rent growth), your $22k cash investment doubles in ~7 years — after that, you're playing with house money.
Negotiation context
- Only 1 days on market — expect competitive offers; lowballing is unlikely to land.
- 10 sale attempts since 26y ago; this cycle's ask is 125% above the opening price — seller raised mid-cycle; expect resistance to lowballs.
- Current owner paid $30k; list at $78k implies a 162% gain — meaningful room to come down on a strong offer.
Risks & watch-outs
- Watch-outs: built in 1928 — expect roof / HVAC / electrical / plumbing capex.
Questions for the listing agent
- Built in 1928 — when were the roof, HVAC, electrical panel, plumbing, and water heater last replaced?
- Is there a deadline driving the sale (1031 exchange, divorce, estate, relocation)? That informs how much negotiation room exists.
- Schools are F-rated, which usually means shorter tenancies and higher turnover. Who's the typical renter profile here, and what's been the actual vacancy rate?
- Crime grade is F in this area — have there been break-ins, vandalism, or insurance claims at this property in the last 3 years? What carrier currently insures it and at what premium?
- What's the average days-on-market for RENTAL listings here right now (not sales)? A rising rental-DOM trend means longer vacancies and softer asking-rent achievability than the comps imply.
- What's the recent tenant-quality profile in this submarket — average credit score on applications, eviction rate, late-payment / NSF rate, and stable-employment percentage? A property-management company in the area should have these aggregated.
- How much new for-sale + rental construction is in the pipeline within 1–3 miles? Heavy new supply typically softens prices + rents 12–24 months out; constrained supply supports both.
Investment metrics
- 1% rule
- 1.27% ✓
- Cap rate
- 10.28%
- Cash-on-cash
- 14.23%
- DSCR
- 1.63
- GRM
- 6.5
CMA / ARV
- ARV (on-the-fly)
- $62,400
- Comps found
- 12
Show comp detail 12 sales within ~0.75 mi
| Address | Dist | Beds/Ba | Sqft | Sold | Price | $/sf | Match |
|---|---|---|---|---|---|---|---|
| 1114 Christopher St | 0.00mi | 2/1.0 | 832 (0%) | 4mo | $30,000 | $36 | 97 |
| 2210 Brown St | 0.29mi | 2/1.0 | 816 (-2%) | 1mo | $49,900 | $61 | 83 |
| 1410 Ida St | 0.20mi | 3/2.0 (+1) | 878 (+6%) | 15mo | $76,900 | $88 | 60 |
| 2641 Brown St | 0.67mi | 2/1.0 | 783 (-6%) | 2mo | $36,500 | $47 | 58 |
| 2429 Brown St | 0.43mi | 2/1.0 | 933 (+12%) | 4mo | $8,500 | $9 | 56 |
| 611 Frank St | 0.62mi | 2/1.0 | 861 (+4%) | 13mo | $68,000 | $79 | 54 |
| 2016 Cumings Ave | 0.19mi | 2/1.0 | 939 (+13%) | 19mo | $62,000 | $66 | 54 |
| 2710 Reynolds St | 0.73mi | 2/1.0 | 751 (-10%) | 5mo | $56,500 | $75 | 45 |
| 1556 Monteray St | 0.66mi | 2/1.0 | 782 (-6%) | 18mo | $95,000 | $121 | 44 |
| 616 Saint Clair Ave | 0.61mi | 2/1.0 | 720 (-14%) | 10mo | $57,500 | $80 | 41 |
| 924 Hammond Ave | 0.72mi | 3/1.0 (+1) | 948 (+14%) | 5mo | $51,000 | $54 | 34 |
| 2725 Chicago Blvd | 0.75mi | 3/1.0 (+1) | 950 (+14%) | 14mo | $95,000 | $100 | 25 |
Match score weights: distance 35% · size 25% · config 20% · recency 20%. Top-matched comps best support the ARV.
Projected returns pro-forma
-3.0% appreciation · 8.0% rent growth · sell at horizon
- IRR
- 10.0%
- Equity multiple
- 1.42×
- Total profit
- $9,173
- Equity at exit
- $11,705
- IRR
- 22.9%
- Equity multiple
- 3.43×
- Total profit
- $53,462
- Equity at exit
- $6,787
Cash invested: $21,980 (down + closing). Projections, not guarantees.
Landlord ↔ Tenant lean methodology
- Overall (STATE)
- 62 Landlord-Friendly
- State Michigan
- 62 Landlord-Friendly · EVEN
- County
- — inherits STATE
- City
- — inherits STATE
ZIP-level market 48503
- Home prices YoY
- -27.7%
- Rents YoY
- 12.3%
- Active inventory
- 135
- Price-to-rent
- 6.5×
Monthly cashflow live
- Estimated rent
- $1,001 high interval (Pro) →
- Mortgage (P&I)
- −$412
- Tax from tax record
- −$86 /mo · $1,029/yr
- Insurance
- −$33
- HOA
- −$0
- Vacancy / Maint / Mgmt
- −$210
- Net cashflow
- $261
Break-even live
UW: 25.0% down · 7.5% · 30yr · 1.5% tax · 5.0% vac · 8.0% maint · 8.0% mgmt
Financing live
Cash to close
- Down payment
- $19,625
- Closing costs
- $2,355
- Reserves months
- —
- Total cash needed
- —
Loan-product check · same deal, 3 products live
Conventional
25% down · 7.5% · 30yr
- Down + closing
- —
- Monthly P&I
- —
- Monthly cashflow
- —
- DSCR
- —
- Eligible?
- —
Personal DTI + credit; lowest rate.
DSCR
20% down · 8.5% · 30yr
- Down + closing
- —
- Monthly P&I
- —
- Monthly cashflow
- —
- DSCR
- —
- Eligible?
- —
No personal income docs; deal must DSCR.
Hard money
10% down · 12.0% · 12mo
- Down + closing
- —
- Monthly P&I
- —
- Monthly cashflow
- —
- DSCR
- —
- Eligible?
- —
Short-term bridge; refi at stabilization.
Rent comps 9 comps
| Address | Beds | Baths | Sqft | Rent | $/sqft | DOM | Units | Dist |
|---|---|---|---|---|---|---|---|---|
| 352 Bradley Ave Unit 343 Sheffield Ave-Apt C Flint, MI | 1.0 | 1.0 | 564 | $900 | $1.60 | 21d | 1 | 0.82mi |
| 343 Sheffield Apt. C Ave heuristic Flint, MI | 1.0 | 1.0 | 564 | $900 | $1.60 | 25d | 1 | 0.91mi |
| 314 Sheffield Ave Flint, MI | 2.0 | 1.0 | 896 | $1,250 | $1.40 | 21d | 1 | 0.94mi |
| 1023 Barrie Ave Flint, MI | 2.0 | 1.0 | 660 | $775 | $1.17 | 21d | 1 | 1.08mi |
| 806 Barney Ave Flint, MI | 2.0 | 1.0 | 1000 | $1,000 | $1.00 | 21d | 1 | 1.11mi |
| 1426 Pettibone Ave Flint, MI | 2.0 | 1.0 | 750 | $900 | $1.20 | 21d | 1 | 1.16mi |
| 3701 Whitney Ave Flint, MI | 2.0 | 1.0 | 850 | $900 | $1.06 | 13d | 1 | 1.30mi |
| 607 E 2nd Ave Unit 803 Flint, MI | 1.0 | 1.0 | 606 | $1,025 | $1.69 | 13d | 1 | 1.33mi |
| 3901 Herrick St Flint, MI | 3.0 | 1.5 | 1100 | $1,300 | $1.18 | 13d | 1 | 1.44mi |
Listing history 3 events
-
2026-06-18status $78,500 Active 1 DOM
-
2026-06-16remarks 699-char remark
-
2026-06-16$78,500 Coming Soon 1 DOM
ⓘ Source: listings_history table (triggers on properties + properties_extension) + one-shot
backfill from property_details.listing_events for pre-trigger history.
Tax reassessment forecast MI · Partial reset (capped growth)
- Current annual tax
- $1,029 · $86/mo
- Projected year-2 tax
- $1,119 · $93/mo
- Expected delta
- +$90/yr (+$8/mo · 8.8%)
ⓘ Screening estimate from a state-policy table — verify with the county assessor before closing.
Climate risk First Street
- Flood 1/10 Low FEMA zone X (unshaded) · 0% chance over 30 yrs
- Wildfire 1/10 Low
- Heat 2/10 Low 7 d/yr ≥97°F today · 15 d/yr by 30 yrs out
- Wind 2/10 Low
- Air quality 3/10 Moderate 3 unhealthy d/yr today · 4 by 30 yrs out
Nearby sold comps map
Loading sold comps map…
Walkable amenities ~0.75 mi
Loading nearby amenities…
Taxation est. · year 1
- Rental income
- $12,010
- − Mortgage interest
- −$4,397
- − Property taxes
- −$1,029
- − Insurance
- −$392
- − Repairs & maintenance
- −$961
- − Management
- −$961
- − Depreciation
- −$2,284
- Taxable income
- $1,987
- Est. tax owed @ 24.0%
- −$477
- After-tax cash flow
- $2,650/yr
For passive investors: Depreciation is non-cash, so a rental often shows a tax loss while cash-flowing — sheltering income. Rental losses are passive: they offset passive income freely, and up to $25,000/yr can offset ordinary (W-2) income if you actively participate and your MAGI is under $100k (phasing out to $0 by $150k); unused losses carry forward. On sale, claimed depreciation is recaptured at up to 25%, and gains may owe capital-gains tax (a 1031 exchange can defer both). Figures are a year-1 estimate at your 24.0% rate — not tax advice; consult a CPA.
Schools (NCES district)
- District
- Flint School District
- NCES district ID
- 2614520
- Math proficiency
- 7% ▬ 0.00%
- Reading proficiency
- 13% ▲ 3.00%
- Median HH income
- $25,954
- Composite
- 10.97/100
- National rank
- #14642
- State rank
- #714 of 760 in MI
Livability — Flint
- Score
- 74/100
- State rank
- #196
- US rank
- #4946
Category grades
Schools grade is shown separately in the Schools card above.
Census & demographics
- Census place
- Flint, MI
- County
- Genesee County · 221,329 people
- City population
- 93,814
- Metro
- Flint, MI
- Population (ZIP)
- 22,347
- Household income
- $44,411
- Rent vs Own
- Severe rent burden
- 1293.0
Population outlook (Genesee County) Hauer SSP2
- Today (2025)
- 381,312 people
- By 2030
- 362,731 · -4.9%
- By 2040
- 321,550 · -15.7%
- By 2050
- 279,212 · -26.8%
- By 2075
- 193,336 · -49.3%
- By 2100
- 128,118 · -66.4%
Race, ethnicity, and origin ACS 2023
- Neighborhood character
- Diverse neighborhood (Simpson 0.56)
- Race & ethnicity
- Black 55% White 36% Two or more races 4% Hispanic / Latino 3%
- Common ancestry
- Romanian 2% Lithuanian 2% Slovak 1%
- Foreign-born
- 5% · China, Canada
- Languages at home
- 93% English-only · Arabic 4% Spanish 1% Chinese 1%
Political lean MEDSL · Genesee
- 2024 margin
- Toss-up / Even · D 51.4% · R 47.2% · Other 1.4%
- 2008→2024 swing
- -28.3pp toward R · 2008: 32.5pp · 2024: 4.2pp
- All cycles
- 2024: D+4.2 2020: D+9.3 2016: D+9.5 2012: D+28.2 2008: D+32.5
Not yet ingested
- Civics
- —
Market trends
- HPI YoY
- ▼ -49.84%
- Current HPI
- 130.1152
- Rent YoY
- ▲ 12.35%
- Metro
- Flint, MI
- State GDP YoY
- ▲ 1.37%
- F500 in state
- 28
Industry mix (Fortune 500 HQ in MI)
| Industry | F500 HQs | Revenue |
|---|---|---|
| Automotive Parts | 3 | $48B |
|
||
| Automotive | 2 | $372B |
|
||
| Chemicals | 1 | $45B |
|
||
| Automotive Retail | 1 | $29B |
|
||
| Healthcare / Medical Devices | 1 | $23B |
|
||
| Automotive Technology | 1 | $20B |
|
||
Price history
+57.3% since first listed26 events — show timeline
- 2026-06-16 Coming Soon $78,500 MiRealSource-MiMLS
- 2026-02-27 Sold (MLS) $30,000 MiRealSource-MiMLS
- 2026-02-27 Sold (MLS) $30,000 REALCOMP
- 2026-02-19 Pending — MiRealSource-MiMLS
- 2026-02-19 Pending — REALCOMP
- 2026-02-02 Relisted — MiRealSource-MiMLS
- 2026-02-02 Relisted — REALCOMP
- 2026-01-28 Pending — MiRealSource-MiMLS
- 2026-01-27 Pending — REALCOMP
- 2026-01-23 Listed $34,900 REALCOMP
- 2026-01-23 Listed $34,900 MiRealSource-MiMLS
- 2012-01-10 Listing Removed — MiRealSource-MiMLS
- 2012-01-10 Listing Removed — REALCOMP
- 2012-01-03 Listed $14,900 MiRealSource-MiMLS
- 2012-01-03 Listed $14,900 REALCOMP
- 2011-12-09 Sold (MLS) $3,500 REALCOMP
- 2011-12-09 Sold (MLS) $3,500 MiRealSource-MiMLS
- 2011-11-02 Listing Removed — MiRealSource-MiMLS
- 2011-10-21 Listed $3,600 REALCOMP
- 2011-10-21 Listed $3,600 MiRealSource-MiMLS
- 2001-06-14 Sold (Public Records) $46,000 Public Records
- 2001-06-11 Sold (MLS) $46,000 REALCOMP
- 2001-06-11 Sold (MLS) $46,000 MiRealSource-MiMLS
- 2001-05-11 Listing Removed — MiRealSource-MiMLS
- 2000-10-12 Listed $49,899 REALCOMP
- 2000-10-12 Listed $49,899 MiRealSource-MiMLS
Property tax history
+2.4%/yrLatest (2025): $1,029 · +1.7% YoY. Source: county tax records.
Cash-flow waterfall
monthlySold comps — $/sqft
last 12 mo · ≤1 miLoading sold comps…