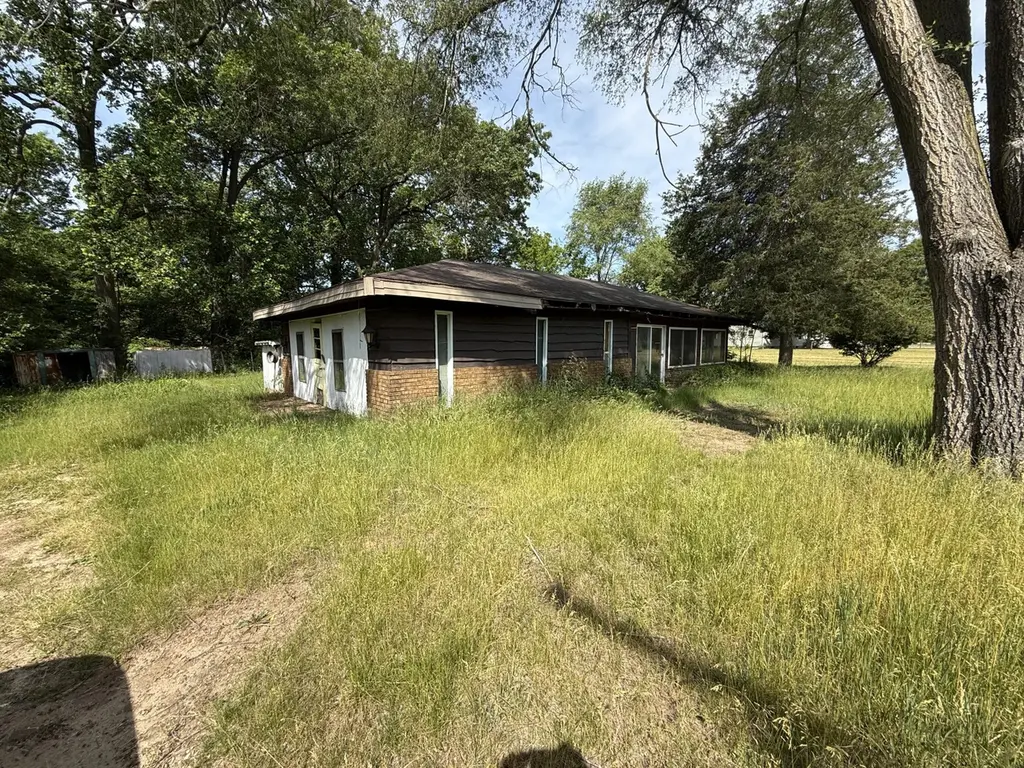
552 19th St · Otsego, MI
Flood risk 1/10 · Minimal
- FEMA flood zone
- X (unshaded)
- Chance of flooding over 30 yrs
- 0.0%
- Est. flood insurance / yr
- $507 – $1,088
Fire risk 1/10 · Minimal
- Est. fire insurance / yr
- $784 – $1,456
Heat risk 2/10 · Minimal
- Hot days now (above 99°F)
- 7 days/yr
- Hot days in 30 yrs
- 16 days/yr
Wind risk 2/10 · Minimal
- Chance of severe wind over 30 yrs
- —
Air-quality risk 2/10 · Minimal
- Unhealthy air days now
- 1 days/yr
- Unhealthy air days in 30 yrs
- 1 days/yr
Risk factors via First Street. Map © Google.
Why this score? — see what drove the B grade
The composite is a weighted blend of 9 inputs, each scored 0–100. Each bar is that input's sub-score; the figure is the points it added to the 100-point composite (weight × sub-score).
- Cash flow +30.0/30.0
- 1% rule +10.0/10.0
- DSCR +10.0/10.0
- ARV discount +7.5/15.0
- Schools +4.1/10.0
- Livability +3.7/5.0
- Rent growth +2.5/5.0
- Condition / age +2.5/5.0
- Appreciation +0.0/10.0
$49,900
🖨 Deal sheet 📄 Offer letter ✓ Due diligence
Listing remarks MLS
3 bed 2 bath home in Otsego that needed major repairs and had a fire in December. This house needs to be completely gutted and rebuilt. Nice . 57 acres lot in Otsego Township just outside the city. Please be careful walking the house.
Key facts
- .57 acres lot
- 0.57 acre lot
- Garage
Tags
Property features AI
Exterior
- Parking: Detached garage (1 car)
- Utilities: Natural gas available and connected; Electricity available; Well water
- Home design: Ranch-style single-family home; One story; Built in 1950
- Construction: Aluminum siding and brick exterior; Composition roof; Slab foundation
- Exterior features: Unimproved road surface; Well water
Interior
- Kitchen: Eat-in kitchen; Pantry
- Bathrooms: 2 full bathrooms
- Heating & cooling: Forced air heating
- Interior features: Eat-in kitchen; Pantry; Fireplace; 6 total rooms
Neighborhood map
What this means for you Summary
Snapshot
- This is a 3-bed/2.0-bath single-family listed at $50k.
Deal economics
- At list price, monthly cash flow is $703 ($8k/yr) — positive.
- The deal already cash-flows at list — no discount required.
- Meets the 1% rule at list price ($1k rent vs $50k).
- Cap rate 23.2% vs local median 1.8% in Otsego — top-decile yield for the area; either an underpriced asset or a hidden risk that comps aren't pricing in. Stress-test before assuming the spread holds.
Location & tenants
- Location reads 73/100 on livability (#216 in MI) — a middle-class / working-renter tenant base. Strengths: cost of living A+, housing A+, schools A-; Watch: employment D+, amenities F, commute F.
- Otsego Public Schools (town): math 39% / reading 57% proficiency, ranked #118 of 540 in MI (top 22%) — families likely to look elsewhere, expect single-tenant / working-renter base with shorter leases.
- Market conditions: 76 active listings in the ZIP; 419 units permitted in Allegan County in 2024 (0 in 5+ unit buildings).
Forward outlook
- Local home prices are declining (-3.0%/yr); year-one equity from $345 of loan paydown is wiped out by about $1k of value loss. Plan a longer hold.
- At projected returns (-3.0% appreciation + 3.0% rent growth), your $14k cash investment doubles in ~2 years — after that, you're playing with house money.
Negotiation context
- Only 10 days on market — expect competitive offers; lowballing is unlikely to land.
- 7 sale attempts; this cycle's ask has dropped $10k (17%) from the opening price — seller is motivated, your offer sets the floor, not the list.
Risks & watch-outs
- Watch-outs: built in 1950 — expect roof / HVAC / electrical / plumbing capex.
Questions for the listing agent
- Built in 1950 — when were the roof, HVAC, electrical panel, plumbing, and water heater last replaced?
- Is there a deadline driving the sale (1031 exchange, divorce, estate, relocation)? That informs how much negotiation room exists.
- Schools are A-rated — typically a magnet for longer-tenancy family renters. What's the average tenant stay here, and is there a school-zone premium baked into asking?
- What's the average days-on-market for RENTAL listings here right now (not sales)? A rising rental-DOM trend means longer vacancies and softer asking-rent achievability than the comps imply.
- What's the recent tenant-quality profile in this submarket — average credit score on applications, eviction rate, late-payment / NSF rate, and stable-employment percentage? A property-management company in the area should have these aggregated.
- How much new for-sale + rental construction is in the pipeline within 1–3 miles? Heavy new supply typically softens prices + rents 12–24 months out; constrained supply supports both.
Investment metrics
- 1% rule
- 2.66% ✓
- Cap rate
- 23.21%
- Cash-on-cash
- 60.42%
- DSCR
- 3.69
- GRM
- 3.1
CMA / ARV
- ARV (on-the-fly)
- $356,608
- Comps found
- 4
Show comp detail 4 sales within ~0.75 mi
| Address | Dist | Beds/Ba | Sqft | Sold | Price | $/sf | Match |
|---|---|---|---|---|---|---|---|
| 544 19th St | 0.07mi | 4/2.0 (+1) | 1,902 (+6%) | 20mo | $329,700 | $173 | 65 |
| 2030 Covault Ln | 0.36mi | 3/2.0 | 1,706 (-5%) | 21mo | $339,900 | $199 | 58 |
| 461 19th St | 0.57mi | 4/2.0 (+1) | 1,576 (-12%) | 10mo | $355,000 | $225 | 40 |
| 526 River Rd | 0.39mi | 3/1.5 | 2,052 (+14%) | 21mo | $350,000 | $171 | 38 |
Match score weights: distance 35% · size 25% · config 20% · recency 20%. Top-matched comps best support the ARV.
Projected returns pro-forma
-3.0% appreciation · 3.0% rent growth · sell at horizon
- IRR
- 59.2%
- Equity multiple
- 3.63×
- Total profit
- $36,740
- Equity at exit
- $7,440
- IRR
- 64.0%
- Equity multiple
- 7.42×
- Total profit
- $89,768
- Equity at exit
- $4,314
Cash invested: $13,972 (down + closing). Projections, not guarantees.
Landlord ↔ Tenant lean methodology
- Overall (STATE)
- 62 Landlord-Friendly
- State Michigan
- 62 Landlord-Friendly · EVEN
- County
- — inherits STATE
- City
- — inherits STATE
ZIP-level market 49078
- Home prices YoY
- -32.7%
- Active inventory
- 76
- Price-to-rent
- 3.1×
Monthly cashflow live
- Estimated rent
- $1,327 medium interval (Pro) →
- Mortgage (P&I)
- −$262
- Tax est. 1.5%
- −$62 /mo · $748/yr
- Insurance
- −$21
- HOA
- −$0
- Vacancy / Maint / Mgmt
- −$279
- Net cashflow
- $703
Break-even live
UW: 25.0% down · 7.5% · 30yr · 1.5% tax · 5.0% vac · 8.0% maint · 8.0% mgmt
Financing live
Cash to close
- Down payment
- $12,475
- Closing costs
- $1,497
- Reserves months
- —
- Total cash needed
- —
Loan-product check · same deal, 3 products live
Conventional
25% down · 7.5% · 30yr
- Down + closing
- —
- Monthly P&I
- —
- Monthly cashflow
- —
- DSCR
- —
- Eligible?
- —
Personal DTI + credit; lowest rate.
DSCR
20% down · 8.5% · 30yr
- Down + closing
- —
- Monthly P&I
- —
- Monthly cashflow
- —
- DSCR
- —
- Eligible?
- —
No personal income docs; deal must DSCR.
Hard money
10% down · 12.0% · 12mo
- Down + closing
- —
- Monthly P&I
- —
- Monthly cashflow
- —
- DSCR
- —
- Eligible?
- —
Short-term bridge; refi at stabilization.
Listing history 10 events
-
2026-06-18days on market $49,900 Active 10 DOM
-
2026-06-17days on market $49,900 Active 9 DOM
-
2026-06-16days on market $49,900 Active 8 DOM
-
2026-06-15price $49,900 Active 7 DOM
-
2026-06-15days on market $59,900 Active 7 DOM
-
2026-06-14days on market $59,900 Active 5 DOM
-
2026-06-13days on market $59,900 Active 4 DOM
-
2026-06-10days on market $59,900 Active 2 DOM
-
2026-06-09remarks 234-char remark
-
2026-06-09$59,900 Active 1 DOM
ⓘ Source: listings_history table (triggers on properties + properties_extension) + one-shot
backfill from property_details.listing_events for pre-trigger history.
Climate risk First Street
- Flood 1/10 Low FEMA zone X (unshaded) · 0% chance over 30 yrs
- Wildfire 1/10 Low
- Heat 2/10 Low 7 d/yr ≥99°F today · 16 d/yr by 30 yrs out
- Wind 2/10 Low
- Air quality 2/10 Low 1 unhealthy d/yr today · 1 by 30 yrs out
Nearby sold comps map
Loading sold comps map…
Walkable amenities ~0.75 mi
Loading nearby amenities…
Taxation est. · year 1
- Rental income
- $15,924
- − Mortgage interest
- −$2,795
- − Property taxes
- −$748
- − Insurance
- −$250
- − Repairs & maintenance
- −$1,274
- − Management
- −$1,274
- − Depreciation
- −$1,452
- Taxable income
- $8,131
- Est. tax owed @ 24.0%
- −$1,952
- After-tax cash flow
- $6,490/yr
For passive investors: Depreciation is non-cash, so a rental often shows a tax loss while cash-flowing — sheltering income. Rental losses are passive: they offset passive income freely, and up to $25,000/yr can offset ordinary (W-2) income if you actively participate and your MAGI is under $100k (phasing out to $0 by $150k); unused losses carry forward. On sale, claimed depreciation is recaptured at up to 25%, and gains may owe capital-gains tax (a 1031 exchange can defer both). Figures are a year-1 estimate at your 24.0% rate — not tax advice; consult a CPA.
Schools (NCES district)
- District
- Otsego Public Schools
- NCES district ID
- 2627060
- Math proficiency
- 39% ▼ -13.00%
- Reading proficiency
- 57% ▼ -10.00%
- Median HH income
- $52,776
- Composite
- 41.32/100
- National rank
- #3507
- State rank
- #118 of 540 in MI
Livability — Otsego
- Score
- 73/100
- State rank
- #216
- US rank
- #5349
Category grades
Schools grade is shown separately in the Schools card above.
Census & demographics
- Population (ZIP)
- 10,469
Population outlook (Allegan County) Hauer SSP2
- Today (2025)
- 120,251 people
- By 2030
- 122,204 · +1.6%
- By 2040
- 123,979 · +3.1%
- By 2050
- 122,340 · +1.7%
- By 2075
- 116,088 · -3.5%
- By 2100
- 98,461 · -18.1%
Race, ethnicity, and origin ACS 2023
- Neighborhood character
- Predominantly White (86%)
- Race & ethnicity
- White 86% Two or more races 6% Hispanic / Latino 4%
- Common ancestry
- Iranian 9% Italian 4% Romanian 4%
- Foreign-born
- 4% · Canada
- Languages at home
- 92% English-only · Spanish 4% Other Indo-European 4%
Political lean MEDSL · Allegan
- 2024 margin
- Strong R (+27.2) · D 35.7% · R 62.9% · Other 1.5%
- 2008→2024 swing
- -16.5pp toward R · 2008: -10.7pp · 2024: -27.2pp
- All cycles
- 2024: R+27.2 2020: R+25.2 2016: R+28.8 2012: R+19.2 2008: R+10.7
Not yet ingested
- Civics
- —
Market trends
- HPI YoY
- ▼ -119.20%
- Current HPI
- 245.4119
- Rent YoY
- —
- Metro
- —
- State GDP YoY
- ▲ 1.37%
- F500 in state
- 28
Industry mix (Fortune 500 HQ in MI)
| Industry | F500 HQs | Revenue |
|---|---|---|
| Automotive Parts | 3 | $48B |
|
||
| Automotive | 2 | $372B |
|
||
| Chemicals | 1 | $45B |
|
||
| Automotive Retail | 1 | $29B |
|
||
| Healthcare / Medical Devices | 1 | $23B |
|
||
| Automotive Technology | 1 | $20B |
|
||
Price history
-64.7% since first listed29 events — show timeline
- 2026-06-08 Listed $59,900 SW Michigan MLS
- 2026-06-08 Listed $59,900 REALCOMP
- 2026-06-08 Listed $59,900 MiRealSource-MiMLS
- 2025-12-22 Listing Removed — MiRealSource-MiMLS
- 2025-11-14 Price Changed $134,900 MiRealSource-MiMLS
- 2025-11-13 Price Changed $134,900 REALCOMP
- 2025-11-13 Price Changed $134,900 SW Michigan MLS
- 2025-11-09 Relisted — MiRealSource-MiMLS
- 2025-11-09 Relisted — REALCOMP
- 2025-10-30 Pending — REALCOMP
- 2025-10-30 Pending — MiRealSource-MiMLS
- 2025-10-30 Listing Removed — REALCOMP
- 2025-10-21 Price Changed $139,900 MiRealSource-MiMLS
- 2025-10-20 Price Changed $139,900 REALCOMP
- 2025-10-20 Price Changed $139,900 SW Michigan MLS
- 2025-10-01 Price Changed $144,900 MiRealSource-MiMLS
- 2025-10-01 Price Changed $144,900 REALCOMP
- 2025-10-01 Price Changed $144,900 SW Michigan MLS
- 2025-09-23 Price Changed $149,900 MiRealSource-MiMLS
- 2025-09-23 Price Changed $149,900 REALCOMP
- 2025-09-23 Price Changed $149,900 SW Michigan MLS
- 2025-09-18 Price Changed $154,900 MiRealSource-MiMLS
- 2025-09-18 Price Changed $154,900 REALCOMP
- 2025-09-18 Price Changed $154,900 SW Michigan MLS
- 2025-09-10 Price Changed $159,900 MiRealSource-MiMLS
- 2025-09-09 Price Changed $159,900 REALCOMP
- 2025-09-09 Price Changed $159,900 SW Michigan MLS
- 2025-09-02 Listed $169,900 REALCOMP
- 2025-09-02 Listed $169,900 MiRealSource-MiMLS
Cash-flow waterfall
monthlySold comps — $/sqft
last 12 mo · ≤1 miLoading sold comps…