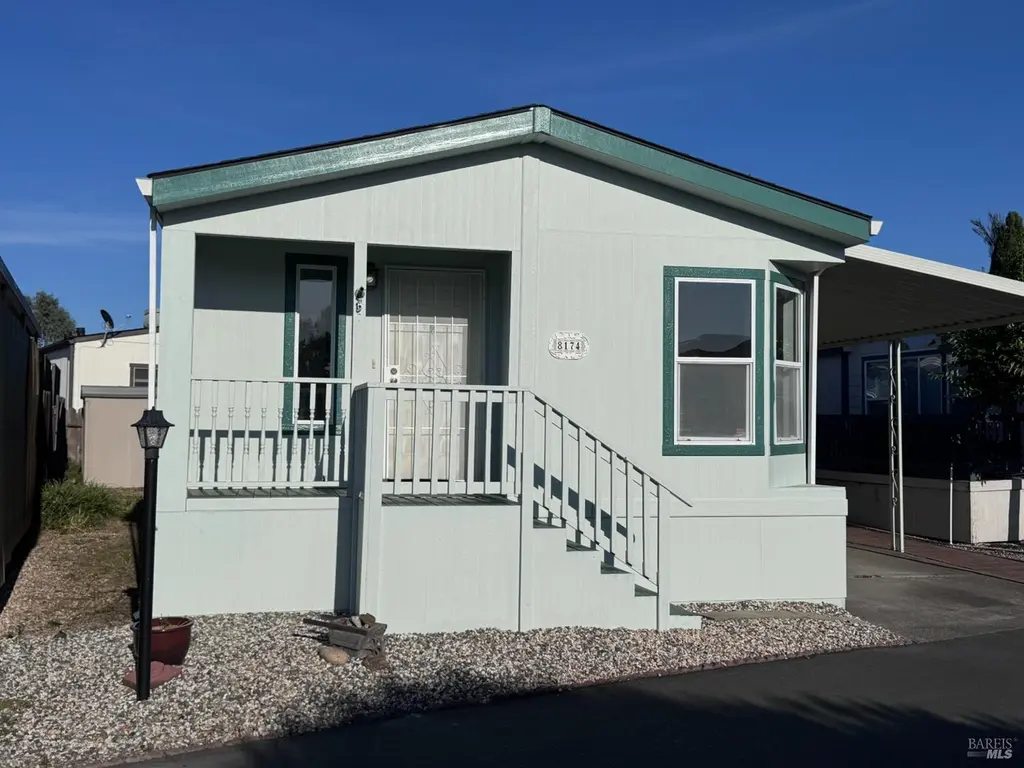
8174 Birch St · Windsor, CA
Flood risk 6/10 · Moderate
- FEMA flood zone
- X (unshaded)
- Chance of flooding over 30 yrs
- 0.68%
- Est. flood insurance / yr
- $507 – $1,088
Fire risk 5/10 · Moderate
- Est. fire insurance / yr
- $659 – $1,223
Heat risk 4/10 · Minor
- Hot days now (above 92°F)
- 7 days/yr
- Hot days in 30 yrs
- 16 days/yr
Wind risk 1/10 · Minimal
- Chance of severe wind over 30 yrs
- —
Air-quality risk 9/10 · Severe
- Unhealthy air days now
- 18 days/yr
- Unhealthy air days in 30 yrs
- 20 days/yr
Risk factors via First Street. Map © Google.
Why this score? — see what drove the C+ grade
The composite is a weighted blend of 9 inputs, each scored 0–100. Each bar is that input's sub-score; the figure is the points it added to the 100-point composite (weight × sub-score).
- Cash flow +30.0/30.0
- 1% rule +10.0/10.0
- DSCR +10.0/10.0
- Livability +3.6/5.0
- Rent growth +2.5/5.0
- Schools +2.5/10.0
- Condition / age +2.5/5.0
- ARV discount +0.0/15.0
- Appreciation +0.0/10.0
$175,000
🖨 Deal sheet 📄 Offer letter ✓ Due diligence
Listing remarks
Come see this well maintained 2-bed 2-bathroom home in Windsor Mobile Country Club Senior 55+ Park. Built in 2002, this home just received a fresh coat of Interior paint, and brand-new carpet in the living room and bedrooms. Both bedrooms have walk in closets for extra storage. The Kitchen features a standalone gas range and oven, microwave, dishwasher and refrigerator. Outside there is a small area in the back for gardening in between two storage sheds. Windsor Mobile Country Club is an active senior community with organized events, two dog parks, and a swimming pool. Great Windsor location, close to the popular Windsor town green, Bowling Alley, Russian River Brewery. Just a few minutes t
Key facts
- Swimming pool
- Gardening area
- Standalone gas range
Tags
Property features AI
Finance
- Other: Located in Windsor mobile home community (Windsor Mobile Country Club); Land lease: Yes
- Financial info: Land lease (monthly land lease amount applies)
- HOA & community: No homeowners association; Senior community
Exterior
- Parking: Covered parking; Guest parking available; 1 parking space
- Security: Carbon monoxide detector; Smoke detector; Double-strapped water heater
- Utilities: Individual electric meter; Individual gas meter; Natural gas connected; Underground utilities; Public sewer
- Home design: Manufactured in park; Double wide
- Construction: Composition roof; Wood skirt; Manufactured by Champion Home Builders Company (Southwood NT)
- Exterior features: Covered patio; Shed(s) / storage
Interior
- Kitchen: Dishwasher; Free-standing gas oven and range; Free-standing refrigerator; Microwave; Disposal
- Bedrooms: 2 bedrooms
- Flooring: Carpet; Laminate
- Bathrooms: 2 full bathrooms; Tub with shower over
- Heating & cooling: Central heating; Ceiling fan(s)
- Interior features: Dishwasher; Disposal; Free-standing gas oven and range; Free-standing refrigerator; Gas water heater; Microwave; Carbon monoxide detector; Double-strapped water heater; Smoke detector
- Laundry & utility: Laundry room (inside)
Neighborhood map
What this means for you Summary
Snapshot
- This is a 2-bed/2.0-bath manufactured listed at $175k.
Deal economics
- At list price, monthly cash flow is $1k ($15k/yr) — positive.
- The deal already cash-flows at list — no discount required.
- Meets the 1% rule at list price ($3k rent vs $175k).
- Recommended offer: $172k (1.5% below list) — sets the bar for market timing.
- Cap rate 14.7% vs local median 3.0% in Windsor — top-decile yield for the area; either an underpriced asset or a hidden risk that comps aren't pricing in. Stress-test before assuming the spread holds.
Location & tenants
- Location reads 71/100 on livability (#210 in CA) — a middle-class / working-renter tenant base. Strengths: employment A+, housing A+, health & safety A+; Watch: schools C-, amenities F, commute F.
- Windsor Unified (suburban): math 25% / reading 25% proficiency, ranked #362 of 517 in CA (top 70%) — low school quality limits family demand, transient renter base, plan for 1-2y turnover.
- Market conditions: 107 active listings in the ZIP; 10 comparable units currently listed for rent nearby; rentals lingering (median 44d on market — plan ~5-8 weeks vacancy on turnover, expect pricing pressure); 50% of comp listings sitting > 30 days — soft ceiling on asking rent; high-income renter base; 1,039 units permitted in Sonoma County in 2024 (185 in 5+ unit buildings).
Forward outlook
- Local home prices are declining (-3.0%/yr); year-one equity from $1k of loan paydown is wiped out by about $5k of value loss. Plan a longer hold.
- Sonoma County population projected at +8% by 2050 — modest demand growth; plan on rents tracking national, not racing it.
- At projected returns (-3.0% appreciation + 3.0% rent growth), your $49k cash investment doubles in ~5 years — after that, you're playing with house money.
Negotiation context
- It's been on market 29 days — a 2% lower offer ($172k) is reasonable based on typical stale-listing flexibility.
Risks & watch-outs
- Climate carrying-cost: major flood risk; moderate wildfire risk — expect insurance premiums to compound above CPI over the hold.
Questions for the listing agent
- Is there a deadline driving the sale (1031 exchange, divorce, estate, relocation)? That informs how much negotiation room exists.
- What's the average days-on-market for RENTAL listings here right now (not sales)? A rising rental-DOM trend means longer vacancies and softer asking-rent achievability than the comps imply.
- What's the recent tenant-quality profile in this submarket — average credit score on applications, eviction rate, late-payment / NSF rate, and stable-employment percentage? A property-management company in the area should have these aggregated.
- How much new for-sale + rental construction is in the pipeline within 1–3 miles? Heavy new supply typically softens prices + rents 12–24 months out; constrained supply supports both.
Investment metrics
- 1% rule
- 1.63% ✓
- Cap rate
- 14.70%
- Cash-on-cash
- 30.04%
- DSCR
- 2.34
- GRM
- 5.1
CMA / ARV
- ARV (on-the-fly)
- $147,680
- Comps found
- 11
Show comp detail 11 sales within ~0.75 mi
| Address | Dist | Beds/Ba | Sqft | Sold | Price | $/sf | Match |
|---|---|---|---|---|---|---|---|
| 1036 Maple Dr | 0.15mi | 2/1.5 | 1,056 (+2%) | 3mo | $150,000 | $142 | 86 |
| 8133 C St | 0.09mi | 2/2.0 | 1,040 (0%) | 12mo | $195,000 | $188 | 86 |
| 8155 Willow St | 0.02mi | 2/2.0 | 1,120 (+8%) | 5mo | $145,000 | $129 | 82 |
| 8132 Willow St | 0.05mi | 2/2.0 | 1,040 (0%) | 22mo | $135,000 | $130 | 79 |
| 8114 B St | 0.09mi | 2/2.0 | 1,000 (-4%) | 16mo | $261,500 | $262 | 76 |
| 8167 Willow St | 0.07mi | 2/2.0 | 1,100 (+6%) | 13mo | $155,000 | $141 | 76 |
| 8109 B St | 0.09mi | 2/2.0 | 1,152 (+11%) | 3mo | $199,000 | $173 | 76 |
| 8184 E St | 0.11mi | 2/2.0 | 1,056 (+2%) | 24mo | $78,000 | $74 | 72 |
| 708 Sequoia Dr | 0.09mi | 2/2.0 | 1,152 (+11%) | 20mo | $155,000 | $135 | 61 |
| 8095 A St | 0.10mi | 3/2.0 (+1) | 1,133 (+9%) | 24mo | $195,000 | $172 | 55 |
| 219 N Heidi Ct #79 | 0.75mi | 2/2.0 | 1,120 (+8%) | 4mo | $180,000 | $161 | 49 |
Match score weights: distance 35% · size 25% · config 20% · recency 20%. Top-matched comps best support the ARV.
Projected returns pro-forma
-3.0% appreciation · 3.0% rent growth · sell at horizon
- IRR
- 24.6%
- Equity multiple
- 2.01×
- Total profit
- $49,687
- Equity at exit
- $26,093
- IRR
- 32.4%
- Equity multiple
- 3.93×
- Total profit
- $143,564
- Equity at exit
- $15,131
Cash invested: $49,000 (down + closing). Projections, not guarantees.
Landlord ↔ Tenant lean methodology
- Overall (STATE)
- 18 Strongly Tenant-Friendly
- State California
- 18 Strongly Tenant-Friendly · D+13
- County
- — inherits STATE
- City
- — inherits STATE
ZIP-level market 95492
- Active inventory
- 107
- Price-to-rent
- 5.1×
Monthly cashflow live
- Estimated rent
- $2,849 high interval (Pro) →
- Mortgage (P&I)
- −$918
- Tax from tax record
- −$33 /mo · $402/yr
- Insurance
- −$73
- HOA
- −$0
- Vacancy / Maint / Mgmt
- −$598
- Net cashflow
- $1,226
Break-even live
UW: 25.0% down · 7.5% · 30yr · 1.5% tax · 5.0% vac · 8.0% maint · 8.0% mgmt
Financing live
Cash to close
- Down payment
- $43,750
- Closing costs
- $5,250
- Reserves months
- —
- Total cash needed
- —
Loan-product check · same deal, 3 products live
Conventional
25% down · 7.5% · 30yr
- Down + closing
- —
- Monthly P&I
- —
- Monthly cashflow
- —
- DSCR
- —
- Eligible?
- —
Personal DTI + credit; lowest rate.
DSCR
20% down · 8.5% · 30yr
- Down + closing
- —
- Monthly P&I
- —
- Monthly cashflow
- —
- DSCR
- —
- Eligible?
- —
No personal income docs; deal must DSCR.
Hard money
10% down · 12.0% · 12mo
- Down + closing
- —
- Monthly P&I
- —
- Monthly cashflow
- —
- DSCR
- —
- Eligible?
- —
Short-term bridge; refi at stabilization.
Rent comps 10 comps
| Address | Beds | Baths | Sqft | Rent | $/sqft | DOM | Units | Dist |
|---|---|---|---|---|---|---|---|---|
| 208 Courtyards E Windsor, CA | 2.0 | 2.0 | 980 | $2,300 | $2.35 | 13d | 1 | 0.18mi |
| 172 Courtyards E Windsor, CA | 2.0 | 2.0 | 980 | $2,650 | $2.70 | 13d | 1 | 0.25mi |
| 10 3rd St Unit 10 Windsor, CA | 2.0 | 1.5 | 1000 | $2,395 | $2.40 | 43d | 1 | 0.40mi |
| 7924 Ferrari Way Windsor, CA | 3.0 | 2.0 | 1476 | $3,400 | $2.30 | 43d | 1 | 0.62mi |
| 776 McClelland Dr Windsor, CA | 2.0 | 2.5 | 1344 | $2,900 | $2.16 | 43d | 1 | 0.76mi |
| 1145 Shiloh Rd Windsor, CA | 3.0 | 1.0–2.0 | 776 | $3,828 | $4.93 | 7d | 14 | 0.99mi |
| 9631 Old Redwood Hwy Unit 9631 Windsor, CA | 2.0 | 1.0 | 1047 | $2,375 | $2.27 | 21d | 1 | 1.19mi |
| 1011 Ventana Dr Windsor, CA | 3.0 | 2.0 | 1100 | $3,400 | $3.09 | 43d | 1 | 1.24mi |
| 1130 Windsor River Rd Windsor, CA | 1.0 | 1.0 | 700 | $2,200 | $3.14 | 43d | 1 | 1.45mi |
| 211 Shiloh Rd Windsor, CA | 2.0 | 1.0 | 814 | $3,095 | $3.80 | 13d | 1 | 1.47mi |
Listing history 17 events
-
2026-06-18days on market $175,000 Active 29 DOM
-
2026-06-17days on market $175,000 Active 28 DOM
-
2026-06-16days on market $175,000 Active 27 DOM
-
2026-06-15days on market $175,000 Active 26 DOM
-
2026-06-14days on market $175,000 Active 24 DOM
-
2026-06-13days on market $175,000 Active 23 DOM
-
2026-06-10days on market $175,000 Active 21 DOM
-
2026-06-09days on market $175,000 Active 20 DOM
-
2026-06-08days on market $175,000 Active 19 DOM
-
2026-06-07days on market $175,000 Active 18 DOM
-
2026-06-05days on market $175,000 Active 15 DOM
-
2026-06-03days on market $175,000 Active 14 DOM
-
2026-06-02days on market $175,000 Active 13 DOM
-
2026-06-01days on market $175,000 Active 12 DOM
-
2026-05-31days on market $175,000 Active 11 DOM
-
2026-05-30days on market $175,000 Active 10 DOM
-
2026-05-20$175,000 Active
ⓘ Source: listings_history table (triggers on properties + properties_extension) + one-shot
backfill from property_details.listing_events for pre-trigger history.
Tax reassessment forecast CA · Resets to sale price
- Current annual tax
- $402 · $33/mo
- Projected year-2 tax
- $1,330 · $111/mo
- Expected delta
- +$928/yr (+$77/mo · 231.2%)
ⓘ Screening estimate from a state-policy table — verify with the county assessor before closing.
Climate risk First Street
- Flood 6/10 Major FEMA zone X (unshaded) · 68% chance over 30 yrs
- Wildfire 5/10 Major
- Heat 4/10 Moderate 7 d/yr ≥92°F today · 16 d/yr by 30 yrs out
- Wind 1/10 Low
- Air quality 9/10 Extreme 18 unhealthy d/yr today · 20 by 30 yrs out
Nearby sold comps map
Loading sold comps map…
Walkable amenities ~0.75 mi
Loading nearby amenities…
Taxation est. · year 1
- Rental income
- $34,186
- − Mortgage interest
- −$9,803
- − Property taxes
- −$402
- − Insurance
- −$875
- − Repairs & maintenance
- −$2,735
- − Management
- −$2,735
- − Depreciation
- −$5,091
- Taxable income
- $12,546
- Est. tax owed @ 24.0%
- −$3,011
- After-tax cash flow
- $11,707/yr
For passive investors: Depreciation is non-cash, so a rental often shows a tax loss while cash-flowing — sheltering income. Rental losses are passive: they offset passive income freely, and up to $25,000/yr can offset ordinary (W-2) income if you actively participate and your MAGI is under $100k (phasing out to $0 by $150k); unused losses carry forward. On sale, claimed depreciation is recaptured at up to 25%, and gains may owe capital-gains tax (a 1031 exchange can defer both). Figures are a year-1 estimate at your 24.0% rate — not tax advice; consult a CPA.
Schools (NCES district)
- District
- Windsor Unified
- NCES district ID
- 0600034
- Math proficiency
- 25% ▼ -10.00%
- Reading proficiency
- 25% ▼ -22.00%
- Median HH income
- $81,297
- Composite
- 25.06/100
- National rank
- #7541
- State rank
- #362 of 517 in CA
Livability — Windsor
- Score
- 71/100
- State rank
- #210
- US rank
- #6671
Category grades
Schools grade is shown separately in the Schools card above.
Census & demographics
- Census place
- Windsor, CA
- County
- Sonoma County · 449,805 people
- City population
- 27,429
- Metro
- Santa Rosa-Petaluma, CA
- Population (ZIP)
- 27,429
- Household income
- $134,211
- Rent vs Own
- Severe rent burden
- 628.0
Population outlook (Sonoma County) Hauer SSP2
- Today (2025)
- 539,935 people
- By 2030
- 554,870 · +2.8%
- By 2040
- 573,262 · +6.2%
- By 2050
- 580,715 · +7.6%
- By 2075
- 579,229 · +7.3%
- By 2100
- 547,835 · +1.5%
Race, ethnicity, and origin ACS 2023
- Neighborhood character
- Majority White (59%)
- Race & ethnicity
- White 59% Hispanic / Latino 33% Two or more races 13% Native American 4% Asian 2% Black 1%
- Hispanic origin (detail)
- Mexican 28%
- Common ancestry
- Italian 4% Slovak 3% Lithuanian 2%
- Foreign-born
- 14% · Canada
- Languages at home
- 72% English-only · Spanish 25% French/Haitian/Cajun 1% Vietnamese 1%
Political lean MEDSL · Sonoma
- 2024 margin
- Solid D (+46.2) · D 71.4% · R 25.2% · Other 3.3%
- 2008→2024 swing
- -3.4pp toward R · 2008: 49.6pp · 2024: 46.2pp
- All cycles
- 2024: D+46.2 2020: D+51.5 2016: D+47.9 2012: D+44.9 2008: D+49.6
Not yet ingested
- Civics
- —
Market trends
- HPI YoY
- ▼ -348.03%
- Current HPI
- 249.6052
- Rent YoY
- —
- Metro
- Santa Rosa-Petaluma, CA
- State GDP YoY
- ▲ 3.21%
- F500 in state
- 116
Industry mix (Fortune 500 HQ in CA)
| Industry | F500 HQs | Revenue |
|---|---|---|
| Technology | 27 | $1,492B |
|
||
| Financial Services | 3 | $174B |
|
||
| Retail | 3 | $44B |
|
||
| Insurance | 3 | $26B |
|
||
| Media / Entertainment | 2 | $115B |
|
||
| Pharmaceuticals / Biotech | 2 | $62B |
|
||
Price history
1 event — show timeline
- 2026-05-20 Listed $175,000 BAREIS
Property tax history
-1.9%/yrLatest (2025): $402 · +0.3% YoY. Source: county tax records.
Cash-flow waterfall
monthlySold comps — $/sqft
last 12 mo · ≤1 miLoading sold comps…