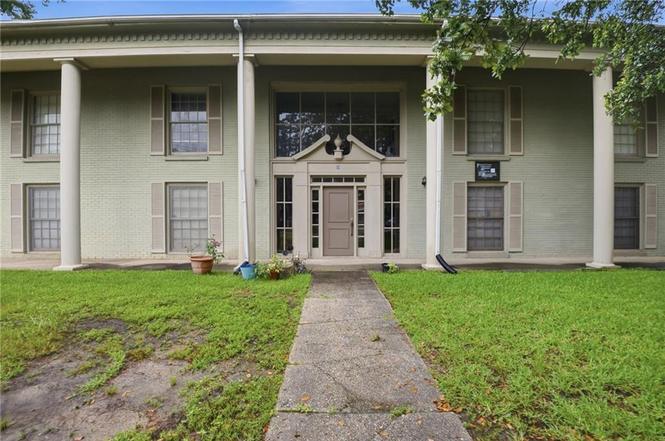
18 S Catherine St #19 · Mobile, AL
Flood risk 1/10 · Minimal
- FEMA flood zone
- X (unshaded)
- Chance of flooding over 30 yrs
- 0.0%
- Est. flood insurance / yr
- $507 – $1,088
Fire risk 1/10 · Minimal
- Est. fire insurance / yr
- $916 – $1,700
Heat risk 9/10 · Severe
- Hot days now (above 105°F)
- 7 days/yr
- Hot days in 30 yrs
- 21 days/yr
Wind risk 9/10 · Severe
- Chance of severe wind over 30 yrs
- 99.0%
Air-quality risk 2/10 · Minimal
- Unhealthy air days now
- 1 days/yr
- Unhealthy air days in 30 yrs
- 1 days/yr
Risk factors via First Street. Map © Google.
Why this score? — see what drove the D grade
The composite is a weighted blend of 9 inputs, each scored 0–100. Each bar is that input's sub-score; the figure is the points it added to the 100-point composite (weight × sub-score).
- Cash flow +14.9/30.0
- ARV discount +7.5/15.0
- 1% rule +5.8/10.0
- DSCR +4.5/10.0
- Livability +3.8/5.0
- Rent growth +3.4/5.0
- Condition / age +2.5/5.0
- Schools +2.3/10.0
- Appreciation +0.0/10.0
$95,000
🖨 Deal sheet (PDF) 📄 Offer letter ✓ Due diligence
Listing remarks MLS
**CALLING ALL INVESTORS**Nice upstairs unit featuring 2 bedrooms and one bath. Comes with an electric stove, dishwasher and refrigerator. Currently has a tenant paying $550 who has rented since 1992!!!. Features tile and carpet floors. If interested in buying multiple units, there are 10. Monthly condo dues are $175 and cover trash, termite, common area maintenance, building insurance, water, sewer. Buyer to verify all information. Seller makes no representation as to accuracy. Owner wants to sell all units at the same time. Listing agent is related to the seller. There is a one-time assessment for $500 in Feb 2024 and then an assessment for $500 in July 2024. This is help cover the cost for roof repairs, parking lot repairs or resurfacing and any other repairs that are needed. Interior pictures are from when the unit was advertised/rented. *LISTING BROKER MAKES NO REPRESENTATION TO SQUARE FOOTAGE ACCURACY. BUYER TO VERIFY.*
Key facts
- 2 parking spots
- Built 1973
Property features AI
Finance
- Other: No land lease
- HOA & community: Association fee applies
Exterior
- Parking: Assigned parking for 2 vehicles
- Utilities: Cable available; Electricity available; Natural gas available; Public sewer; Water available
- Home design: Condominium (residential); Built in 1973; Shingle roof
- Construction: Brick on all sides construction; No listed foundation details
- Exterior features: Awnings; Fenced yard; Open view
Interior
- Kitchen: Electric oven; Electric range; Microwave; Refrigerator; Breakfast room / Eat-in kitchen; Laminate counters
- Bedrooms: 2 bedrooms
- Flooring: Carpet; Vinyl
- Bathrooms: 1 full bathroom
- Heating & cooling: Central heating (electric); No cooling
- Interior features: Other interior features; Brick fireplace
Neighborhood map
What this means for you Summary
Snapshot
- This is a 2-bed/1.0-bath condo listed at $95k.
Deal economics
- At list price, monthly cash flow is $27 ($324/yr) — positive.
- The deal already cash-flows at list — no discount required.
- Meets the 1% rule at list price ($1k rent vs $95k).
- Cap rate 6.6% vs local median 4.9% in Mobile — top-decile yield for the area; either an underpriced asset or a hidden risk that comps aren't pricing in. Stress-test before assuming the spread holds.
Location & tenants
- Location reads 75/100 on livability (#20 in AL, #4,262 nationally) — a middle-class / working-renter tenant base. Strengths: commute A+, cost of living A+, housing A+; Watch: crime F, employment D-.
- Mobile County (urban): math 15% / reading 39% proficiency, ranked #81 of 129 in AL (top 63%) — low school quality limits family demand, transient renter base, plan for 1-2y turnover; 67% free/reduced lunch — lower-income household profile, screen leases tightly.
- Zoned schools: Leinkauf Elementary School (math 8% / reading 26%, grade F, #499 of 627 statewide, top 80%, 538 students, 91% FRL); Murphy High School (math 10% / reading 19%, grade F, #220 of 305 statewide, top 77%, 1,254 students, 66% FRL).
- Market conditions: Rents rising (+3.8%/yr); 93 active listings in the ZIP; 20 comparable units currently listed for rent nearby; rentals lingering (median 45d on market — plan ~5-8 weeks vacancy on turnover, expect pricing pressure); 55% of comp listings sitting > 30 days — soft ceiling on asking rent; 1,678 units permitted in Mobile County in 2024 (264 in 5+ unit buildings).
Forward outlook
- Local home prices are declining (-3.0%/yr); year-one equity from $657 of loan paydown is wiped out by about $3k of value loss. Plan a longer hold.
- Mobile County population projected to shrink 8% by 2050 — rents likely to lag national; underwrite the cash flow, not the appreciation.
Negotiation context
- Only 1 days on market — expect competitive offers; lowballing is unlikely to land.
- 3 sale attempts since 3y ago with the ask held roughly flat each time — persistent listings suggest the price (not the market) is what's stuck; bring a comps-based counter.
- Current owner paid $70k; 36% above their basis — modest negotiation headroom, anchor on the comps not their cost.
Risks & watch-outs
- Climate carrying-cost: severe wind risk, 99% chance of damaging wind over 30y; extreme-heat days projected 7→21/yr by 2055 (HVAC capex compounding) — expect insurance premiums to compound above CPI over the hold.
Questions for the listing agent
- Built in 1973 — when were the roof, HVAC, electrical panel, plumbing, and water heater last replaced?
- What does the HOA fee cover, when was the last increase, and are there any pending special assessments or reserve-fund shortfalls?
- Any open or pending special assessments — roof, HVAC, plumbing, elevator, façade? What's the per-unit balance and payoff schedule, and is the seller paying it off at close or rolling it to the buyer?
- Is there a deadline driving the sale (1031 exchange, divorce, estate, relocation)? That informs how much negotiation room exists.
- Schools are D-rated, which usually means shorter tenancies and higher turnover. Who's the typical renter profile here, and what's been the actual vacancy rate?
- Crime grade is F in this area — have there been break-ins, vandalism, or insurance claims at this property in the last 3 years? What carrier currently insures it and at what premium?
- The area grade is low — what's the realistic commute time and amenity access for the typical tenant pool here? Any planned neighborhood developments (good or bad) we should know about?
- What's the average days-on-market for RENTAL listings here right now (not sales)? A rising rental-DOM trend means longer vacancies and softer asking-rent achievability than the comps imply.
- What's the recent tenant-quality profile in this submarket — average credit score on applications, eviction rate, late-payment / NSF rate, and stable-employment percentage? A property-management company in the area should have these aggregated.
- How much new apartment / multifamily construction is in the pipeline within 1–3 miles? Heavy new supply (>2% of stock underway) typically softens rents 12–24 months out; light construction supports rent growth.
Investment metrics
- 1% rule
- 1.08% ✓
- Cap rate
- 6.63%
- Cash-on-cash
- 1.22%
- DSCR
- 1.05
- GRM
- 7.7
CMA / ARV
No comps found within radius.
Projected returns pro-forma
-3.0% appreciation · 3.78% rent growth · sell at horizon
- IRR
- -13.2%
- Equity multiple
- 0.52×
- Total profit
- $-12,765
- Equity at exit
- $14,165
- IRR
- -2.7%
- Equity multiple
- 0.81×
- Total profit
- $-5,128
- Equity at exit
- $8,214
Cash invested: $26,600 (down + closing). Projections, not guarantees.
Landlord ↔ Tenant lean methodology
- Overall (STATE)
- 90 Strongly Landlord-Friendly
- State Alabama
- 90 Strongly Landlord-Friendly · R+15
- County
- — inherits STATE
- City
- — inherits STATE
ZIP-level market 36604
- Rents YoY
- 3.8%
- Active inventory
- 93
- Price-to-rent
- 7.7×
Monthly cashflow live
- Estimated rent
- $1,028 high interval (Pro) →
- Mortgage (P&I)
- −$498
- Tax from tax record
- −$72 /mo · $864/yr
- Insurance
- −$40
- HOA est. from 6 same-building comps
- −$175
- Vacancy / Maint / Mgmt
- −$216
- Net cashflow
- $27
Break-even live
Sensitivity live
| Price | -10% $81 | -5% $54 | +0% $27 | +5% $0 | +10% $-27 |
|---|---|---|---|---|---|
| Rent | -10% $-54 | -5% $-14 | +0% $27 | +5% $68 | +10% $108 |
| Rate | -1.0pp $75 | -0.5pp $51 | base $27 | +0.5pp $2 | +1.0pp $-23 |
UW: 25.0% down · 7.5% · 30yr · 1.5% tax · 5.0% vac · 8.0% maint · 8.0% mgmt
Financing live
Cash to close
- Down payment
- $23,750
- Closing costs
- $2,850
- Reserves months
- —
- Total cash needed
- —
Loan-product check · same deal, 3 products live
Conventional
25% down · 7.5% · 30yr
- Down + closing
- —
- Monthly P&I
- —
- Monthly cashflow
- —
- DSCR
- —
- Eligible?
- —
Personal DTI + credit; lowest rate.
DSCR
20% down · 8.5% · 30yr
- Down + closing
- —
- Monthly P&I
- —
- Monthly cashflow
- —
- DSCR
- —
- Eligible?
- —
No personal income docs; deal must DSCR.
Hard money
10% down · 12.0% · 12mo
- Down + closing
- —
- Monthly P&I
- —
- Monthly cashflow
- —
- DSCR
- —
- Eligible?
- —
Short-term bridge; refi at stabilization.
Rent comps 20 comps
| Address | Beds | Baths | Sqft | Rent | $/sqft | DOM | Units | Dist |
|---|---|---|---|---|---|---|---|---|
| 12 S Catherine St Unit 2 Mobile, AL | 1.0 | 1.0 | 700 | $725 | $1.04 | 22d | 1 | 0.02mi |
| 111 S Catherine St Mobile, AL | 2.0 | 1.0 | 891 | $899 | $1.01 | 44d | 1 | 0.18mi |
| 57 N Ann St Unit 1043453P Mobile, AL | 2.0 | 2.0 | 1065 | $2,015 | $1.89 | 22d | 1 | 0.55mi |
| 1417 Monroe St Mobile, AL | 2.0 | 1.0 | 1064 | $1,350 | $1.27 | 44d | 1 | 0.56mi |
| 207 Michigan Ave Unit 3 Mobile, AL | 1.0 | 1.0 | 1000 | $795 | $0.80 | 22d | 1 | 0.56mi |
| 207 Michigan Ave Unit 3 Mobile, AL | 1.0 | 1.0 | 1000 | $795 | $0.80 | 44d | 1 | 0.56mi |
| 250 Tuttle Ave Unit B Mobile, AL | 1.0 | 1.0 | 928 | $1,100 | $1.19 | 44d | 1 | 0.56mi |
| 1254 Old Shell Rd Mobile, AL | 1.0–2.0 | 1.0 | 660 | $975 | $1.48 | 14d | 4 | 0.69mi |
| 186 Stanton Rd Mobile, AL | 1.0–3.0 | 1.0–2.5 | 1263 | $2,062 | $1.63 | 44d | 1 | 1.00mi |
| 1013 Elmira St Unit A Mobile, AL | 2.0 | 1.0 | 1000 | $995 | $0.99 | 22d | 1 | 1.10mi |
| 1013 Elmira St Unit B Mobile, AL | 1.0 | 1.0 | 547 | $745 | $1.36 | 22d | 1 | 1.10mi |
| 2161 Homewood St Unit B Mobile, AL | 1.0 | 1.0 | 600 | $1,295 | $2.16 | 22d | 1 | 1.11mi |
| 957 Savannah St Mobile, AL | 2.0 | 1.5 | 1054 | $1,400 | $1.33 | 22d | 1 | 1.16mi |
| 350 Stanton Rd Unit D25 Mobile, AL | 1.0 | 1.0 | 588 | $895 | $1.52 | 44d | 1 | 1.21mi |
| 104 Ellinor St Mobile, AL | 2.0 | 1.0 | 896 | $1,275 | $1.42 | 22d | 1 | 1.26mi |
| 1009 Miami St Mobile, AL | 3.0 | 1.0 | 768 | $1,150 | $1.50 | 44d | 1 | 1.37mi |
| 711 Marine St Mobile, AL | 2.0 | 1.0 | 1100 | $1,150 | $1.05 | 44d | 1 | 1.41mi |
| 400 Westwood St Mobile, AL | 1.0–2.0 | 1.0 | 750 | $1,005 | $1.34 | 44d | 1 | 1.45mi |
| 562 Clarke St Mobile, AL | 2.0 | 1.0 | 1061 | $1,025 | $0.97 | 44d | 1 | 1.46mi |
| 2500 Taylor Ave Mobile, AL | 2.0 | 1.0 | 840 | $1,195 | $1.42 | 44d | 1 | 1.49mi |
HOA detail condo
- Monthly dues
- $0 · $0/yr
- Likely covers
- watersewertrashelectricroofinsurance
- Assessments
- None detected in remarks — confirm with the listing agent.
Listing history 2 events
-
2026-06-18remarks 455-char remark
-
2026-06-18$95,000 Active 1 DOM
ⓘ Source: listings_history table (triggers on properties + properties_extension) + one-shot
backfill from property_details.listing_events for pre-trigger history.
Tax reassessment forecast AL · Resets to sale price
- Current annual tax
- $864 · $72/mo
- Projected year-2 tax
- $864 · $72/mo
- Expected delta
- $0/yr ($0/mo · 0.0%)
ⓘ Screening estimate from a state-policy table — verify with the county assessor before closing.
Climate risk First Street
- Flood 1/10 Low FEMA zone X (unshaded) · 0% chance over 30 yrs
- Wildfire 1/10 Low
- Heat 9/10 Extreme 7 d/yr ≥105°F today · 21 d/yr by 30 yrs out
- Wind 9/10 Extreme 99% chance of damaging wind over 30 yrs
- Air quality 2/10 Low 1 unhealthy d/yr today · 1 by 30 yrs out
Nearby sold comps map
Loading sold comps map…
Walkable amenities ~0.75 mi
Loading nearby amenities…
Taxation est. · year 1
- Rental income
- $12,331
- − Mortgage interest
- −$5,321
- − Property taxes
- −$864
- − Insurance
- −$475
- − Repairs & maintenance
- −$986
- − Management
- −$986
- − HOA
- −$2,100
- − Depreciation
- −$2,764
- Taxable loss
- −$1,166
- Est. tax savings @ 24.0%
- +$280
- After-tax cash flow
- $604/yr
For passive investors: Depreciation is non-cash, so a rental often shows a tax loss while cash-flowing — sheltering income. Rental losses are passive: they offset passive income freely, and up to $25,000/yr can offset ordinary (W-2) income if you actively participate and your MAGI is under $100k (phasing out to $0 by $150k); unused losses carry forward. On sale, claimed depreciation is recaptured at up to 25%, and gains may owe capital-gains tax (a 1031 exchange can defer both). Figures are a year-1 estimate at your 24.0% rate — not tax advice; consult a CPA.
Schools (NCES district)
- District
- Mobile County
- NCES district ID
- 0102370
- Math proficiency
- 15% ▼ -28.00%
- Reading proficiency
- 39% ▬ 0.00%
- Median HH income
- $42,455
- Composite
- 22.9/100
- National rank
- #8002
- State rank
- #81 of 129 in AL
Livability — Mobile
- Score
- 75/100
- State rank
- #20
- US rank
- #4262
Category grades
Schools grade is shown separately in the Schools card above.
Census & demographics
- Census place
- Mobile, AL
- County
- Mobile County · 246,577 people
- City population
- 205,729
- Metro
- Mobile, AL
- Population (ZIP)
- 8,836
- Household income
- $66,357
- Rent vs Own
- Severe rent burden
- 452.0
Population outlook (Mobile County) Hauer SSP2
- Today (2025)
- 415,303 people
- By 2030
- 411,755 · -0.9%
- By 2040
- 399,670 · -3.8%
- By 2050
- 382,616 · -7.9%
- By 2075
- 337,353 · -18.8%
- By 2100
- 283,391 · -31.8%
Race, ethnicity, and origin ACS 2023
- Neighborhood character
- Diverse neighborhood (Simpson 0.56)
- Race & ethnicity
- White 51% Black 42% Two or more races 3% Hispanic / Latino 2%
- Common ancestry
- Lithuanian 4% Serbian 2% Slovak 2%
- Foreign-born
- 2% · Canada, China
- Languages at home
- 97% English-only · Spanish 2%
Political lean MEDSL · Mobile
- 2024 margin
- R (+16.4) · D 41.3% · R 57.7%
- 2008→2024 swing
- -7.7pp toward R · 2008: -8.7pp · 2024: -16.4pp
- All cycles
- 2024: R+16.4 2020: R+11.9 2016: R+13.9 2012: R+9.3 2008: R+8.7
Not yet ingested
- Civics
- —
Market trends
- HPI YoY
- ▼ -143.27%
- Current HPI
- 205.7241
- Rent YoY
- ▲ 3.78%
- Metro
- Mobile, AL
- State GDP YoY
- ▲ 2.94%
- F500 in state
- 4
Industry mix (Fortune 500 HQ in AL)
| Industry | F500 HQs | Revenue |
|---|---|---|
| Financial Services | 1 | $8B |
|
||
| Healthcare | 1 | $5B |
|
||
Price history
+35.7% since first listed7 events — show timeline
- 2026-06-18 Listed $95,000 GCMLS AL
- 2023-11-09 Sold (MLS) $70,000 BCAR
- 2023-11-09 Sold (MLS) $70,000 GCMLS AL
- 2023-09-27 Pending — BCAR
- 2023-09-27 Pending — GCMLS AL
- 2023-09-19 Listed $70,000 GCMLS AL
- 2023-09-18 Listed $70,000 BCAR
Property tax history
+9.7%/yrLatest (2025): $864 · +112.5% YoY. Source: county tax records.
Cash-flow waterfall
monthlySold comps — $/sqft
last 12 mo · ≤1 miLoading sold comps…