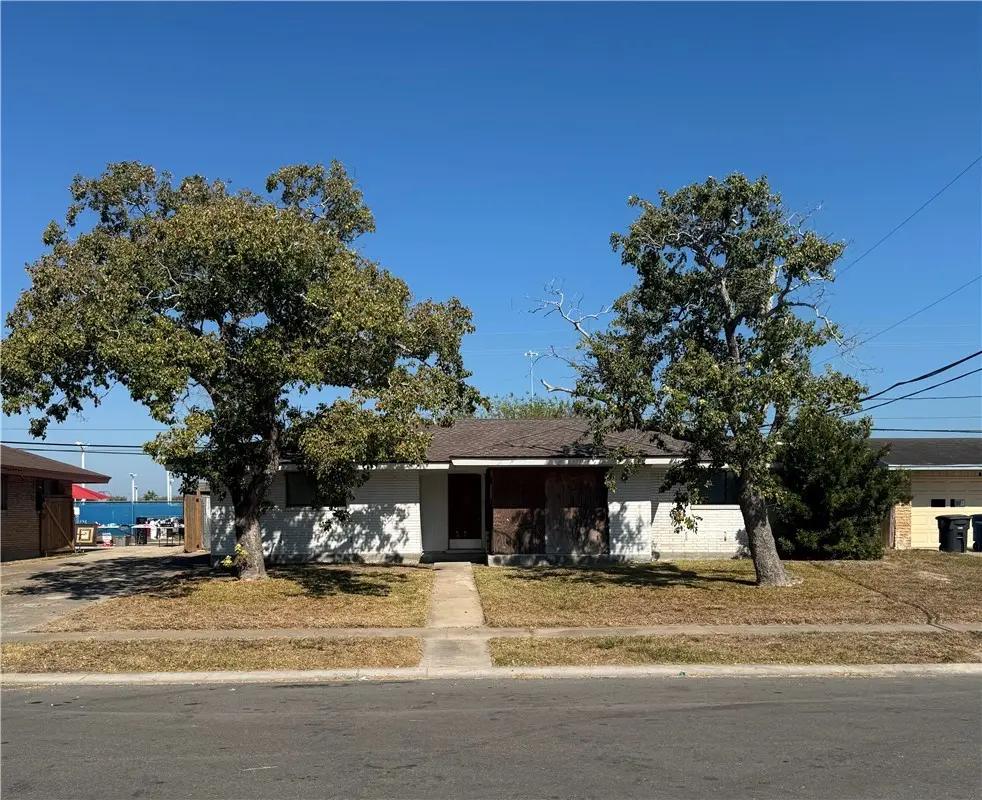
3734 Brushwood · Corpus Christi, TX
Flood risk 1/10 · Minimal
- FEMA flood zone
- X (unshaded)
- Chance of flooding over 30 yrs
- 0.0%
- Est. flood insurance / yr
- $507 – $1,088
Fire risk 1/10 · Minimal
- Est. fire insurance / yr
- $1,222 – $2,270
Heat risk 10/10 · Severe
- Hot days now (above 107°F)
- 7 days/yr
- Hot days in 30 yrs
- 24 days/yr
Wind risk 9/10 · Severe
- Chance of severe wind over 30 yrs
- 99.0%
Air-quality risk 1/10 · Minimal
- Unhealthy air days now
- 0 days/yr
- Unhealthy air days in 30 yrs
- 0 days/yr
Risk factors via First Street. Map © Google.
Why this score? — see what drove the B+ grade
The composite is a weighted blend of 9 inputs, each scored 0–100. Each bar is that input's sub-score; the figure is the points it added to the 100-point composite (weight × sub-score).
- Cash flow +30.0/30.0
- ARV discount +15.0/15.0
- 1% rule +10.0/10.0
- DSCR +10.0/10.0
- Livability +3.9/5.0
- Rent growth +3.1/5.0
- Schools +2.8/10.0
- Condition / age +2.5/5.0
- Appreciation +0.0/10.0
$129,000
🖨 Deal sheet (PDF) 📄 Offer letter ✓ Due diligence
Listing remarks MLS
If you’re ready to roll your sleeves up, this investor special is right for you. Good bones, good layout, good size and good location, this house is ready for someone to finish out and make their mark. (Being sold as is, with repairs and remodel needed. )
Key facts
- 6,826 sq ft lot
- Built 1965
- Listed 91 days
Neighborhood map
What this means for you Summary
Snapshot
- This is a 4-bed/3.0-bath single-family listed at $129k.
Deal economics
- At list price, monthly cash flow is $644 ($8k/yr) — positive.
- The deal already cash-flows at list — no discount required.
- Meets the 1% rule at list price ($2k rent vs $129k).
- Recommended offer: $117k (9.0% below list) — sets the bar for market timing.
- Cap rate 12.3% vs local median 3.6% in Corpus Christi — top-decile yield for the area; either an underpriced asset or a hidden risk that comps aren't pricing in. Stress-test before assuming the spread holds.
Location & tenants
- Location reads 78/100 on livability (#66 in TX, #2,404 nationally) — a middle-class / working-renter tenant base. Strengths: commute A+, cost of living A+, housing A+; Watch: crime F.
- Corpus Christi ISD (urban): math 31% / reading 35% proficiency, ranked #562 of 826 in TX (top 68%) — families likely to look elsewhere, expect single-tenant / working-renter base with shorter leases; 63% free/reduced lunch — lower-income household profile, screen leases tightly.
- Market conditions: Rents rising (+2.3%/yr); 417 active listings in the ZIP; 17 comparable units currently listed for rent nearby; rentals at typical pace (median 14d on market — plan ~3-4 weeks tenant-placement turnaround); 1,397 units permitted in Nueces County in 2024 (47 in 5+ unit buildings).
- At $2,112/mo this rent would consume 46% of the median local household income ($55k/yr) (locally 1730% of renters already pay >50% of income on rent) — very limited rent-growth headroom before tenants either downsize or default.
Forward outlook
- Local home prices are declining (-3.0%/yr); year-one equity from $892 of loan paydown is wiped out by about $4k of value loss. Plan a longer hold.
- Nueces County population projected at +36% by 2050 — long-run rental-demand tailwind backs the buy-and-hold thesis.
- At projected returns (-3.0% appreciation + 2.3% rent growth), your $36k cash investment doubles in ~6 years — after that, you're playing with house money.
Negotiation context
- It's been on market 91 days — a 9% lower offer ($117k) is reasonable based on typical stale-listing flexibility.
- 2 sale attempts since 2y ago; this cycle's ask has dropped $10k (7%) from the opening price — seller is motivated, your offer sets the floor, not the list.
Risks & watch-outs
- Watch-outs: property tax is 2.7% of price.
- Climate carrying-cost: severe wind risk, 99% chance of damaging wind over 30y; extreme-heat days projected 7→24/yr by 2055 (HVAC capex compounding) — expect insurance premiums to compound above CPI over the hold.
Questions for the listing agent
- It's been on market 91 days. Have you received any prior offers? Is the seller open to a 9% concession, seller financing, or rate buy-down credit?
- Built in 1965 — when were the roof, HVAC, electrical panel, plumbing, and water heater last replaced?
- Property tax is high relative to price — has the assessment been appealed recently, and will the sale trigger a re-assessment?
- Why hasn't it sold? Are there any deal-killer items the seller is aware of (foundation, flood, title, zoning, code violations)?
- Is there a deadline driving the sale (1031 exchange, divorce, estate, relocation)? That informs how much negotiation room exists.
- Crime grade is F in this area — have there been break-ins, vandalism, or insurance claims at this property in the last 3 years? What carrier currently insures it and at what premium?
- What's the average days-on-market for RENTAL listings here right now (not sales)? A rising rental-DOM trend means longer vacancies and softer asking-rent achievability than the comps imply.
- What's the recent tenant-quality profile in this submarket — average credit score on applications, eviction rate, late-payment / NSF rate, and stable-employment percentage? A property-management company in the area should have these aggregated.
- How much new for-sale + rental construction is in the pipeline within 1–3 miles? Heavy new supply typically softens prices + rents 12–24 months out; constrained supply supports both.
Investment metrics
- 1% rule
- 1.64% ✓
- Cap rate
- 12.28%
- Cash-on-cash
- 21.38%
- DSCR
- 1.95
- GRM
- 5.1
CMA / ARV
- ARV (median comp)
- $210,992
- List price
- $129,000
- Delta
- -38.86%
- Verdict
- UNDERPRICED
- Comps
- 20 within 1.0 mi
Show comp detail 12 sales within ~0.75 mi
| Address | Dist | Beds/Ba | Sqft | Sold | Price | $/sf | Match |
|---|---|---|---|---|---|---|---|
| 5226 Honeysuckle | 0.23mi | 3/2.0 (-1) | 1,855 (+5%) | 8mo | $224,000 | $121 | 65 |
| 5320 Hitching Post | 0.61mi | 4/3.0 | 1,723 (-2%) | 4mo | $211,000 | $122 | 64 |
| 4033 Key West Dr | 0.51mi | 3/3.0 (-1) | 1,690 (-4%) | 2mo | $225,900 | $134 | 63 |
| 4914 Nell St | 0.52mi | 4/3.0 | 1,655 (-6%) | 4mo | $249,500 | $151 | 62 |
| 3502 Tiger Ln | 0.35mi | 4/2.0 | 1,981 (+12%) | 2mo | $249,500 | $126 | 57 |
| 3609 Capri Dr | 0.51mi | 3/2.0 (-1) | 1,689 (-4%) | 10mo | $239,900 | $142 | 52 |
| 3809 Capri Dr | 0.46mi | 3/2.0 (-1) | 1,570 (-11%) | 4mo | $247,900 | $158 | 48 |
| 4802 Kasper St | 0.52mi | 3/2.5 (-1) | 1,996 (+13%) | 3mo | $185,000 | $93 | 44 |
| 5406 Fresno Dr | 0.60mi | 3/2.0 (-1) | 1,640 (-7%) | 12mo | $199,900 | $122 | 42 |
| 4938 Mable St | 0.73mi | 3/3.0 (-1) | 1,595 (-10%) | 6mo | $255,000 | $160 | 40 |
| 3917 Pyle Dr | 0.75mi | 5/2.0 (+1) | 1,952 (+11%) | 3mo | $209,900 | $108 | 36 |
| 4821 Kosarek Dr | 0.54mi | 3/2.0 (-1) | 2,011 (+14%) | 8mo | $229,900 | $114 | 36 |
Match score weights: distance 35% · size 25% · config 20% · recency 20%. Top-matched comps best support the ARV.
Projected returns pro-forma
-3.0% appreciation · 2.32% rent growth · sell at horizon
- IRR
- 13.1%
- Equity multiple
- 1.52×
- Total profit
- $18,769
- Equity at exit
- $19,234
- IRR
- 21.5%
- Equity multiple
- 2.77×
- Total profit
- $63,782
- Equity at exit
- $11,154
Cash invested: $36,120 (down + closing). Projections, not guarantees.
Landlord ↔ Tenant lean methodology
- Overall (STATE)
- 87 Strongly Landlord-Friendly
- State Texas
- 87 Strongly Landlord-Friendly · R+5
- County
- — inherits STATE
- City
- — inherits STATE
ZIP-level market 78415
- Rents YoY
- 2.3%
- Active inventory
- 417
- Price-to-rent
- 5.1×
Monthly cashflow live
- Estimated rent
- $2,112 high interval (Pro) →
- Mortgage (P&I)
- −$676
- Tax from tax record
- −$294 /mo · $3,533/yr
- Insurance
- −$54
- HOA
- −$0
- Vacancy / Maint / Mgmt
- −$443
- Net cashflow
- $644
Break-even live
Sensitivity live
| Price | -10% $717 | -5% $680 | +0% $644 | +5% $607 | +10% $571 |
|---|---|---|---|---|---|
| Rent | -10% $477 | -5% $560 | +0% $644 | +5% $727 | +10% $810 |
| Rate | -1.0pp $709 | -0.5pp $676 | base $644 | +0.5pp $610 | +1.0pp $576 |
UW: 25.0% down · 7.5% · 30yr · 1.5% tax · 5.0% vac · 8.0% maint · 8.0% mgmt
Financing live
Cash to close
- Down payment
- $32,250
- Closing costs
- $3,870
- Reserves months
- —
- Total cash needed
- —
Loan-product check · same deal, 3 products live
Conventional
25% down · 7.5% · 30yr
- Down + closing
- —
- Monthly P&I
- —
- Monthly cashflow
- —
- DSCR
- —
- Eligible?
- —
Personal DTI + credit; lowest rate.
DSCR
20% down · 8.5% · 30yr
- Down + closing
- —
- Monthly P&I
- —
- Monthly cashflow
- —
- DSCR
- —
- Eligible?
- —
No personal income docs; deal must DSCR.
Hard money
10% down · 12.0% · 12mo
- Down + closing
- —
- Monthly P&I
- —
- Monthly cashflow
- —
- DSCR
- —
- Eligible?
- —
Short-term bridge; refi at stabilization.
Rent comps 17 comps
| Address | Beds | Baths | Sqft | Rent | $/sqft | DOM | Units | Dist |
|---|---|---|---|---|---|---|---|---|
| 4845 Concord St Corpus Christi, TX | 4.0 | 2.0 | 1437 | $1,750 | $1.22 | 14d | 1 | 0.41mi |
| 4006 Panama Dr Corpus Christi, TX | 3.0 | 2.0 | 1816 | $1,949 | $1.07 | 21d | 1 | 0.44mi |
| 4013 Kingston Dr Corpus Christi, TX | 3.0 | 2.0 | 1451 | $2,500 | $1.72 | 44d | 1 | 0.51mi |
| 4117 Monaco Dr Corpus Christi, TX | 5.0 | 2.0 | 1483 | $2,100 | $1.42 | 14d | 1 | 0.67mi |
| 4634 Weir Dr Corpus Christi, TX | 3.0 | 2.0 | 1540 | $1,800 | $1.17 | 44d | 1 | 0.68mi |
| 4717 Edith St Unit 1268436P Corpus Christi, TX | 4.0 | 2.0 | 1496 | $4,708 | $3.15 | 44d | 1 | 0.81mi |
| 4402 Sutton Ln Corpus Christi, TX | 4.0 | 2.0 | 1850 | $2,100 | $1.14 | 14d | 1 | 0.91mi |
| 4830 French Dr Corpus Christi, TX | 3.0 | 2.0 | 1299 | $1,700 | $1.31 | 14d | 1 | 0.95mi |
| 4114 Cork Dr Corpus Christi, TX | 3.0 | 2.0 | 1296 | $1,595 | $1.23 | 14d | 1 | 1.05mi |
| 4009 Donaho Dr Corpus Christi, TX | 3.0 | 2.0 | 2187 | $2,400 | $1.10 | 44d | 1 | 1.24mi |
| 4406 Donegal Dr Corpus Christi, TX | 3.0 | 2.0 | 1338 | $1,800 | $1.35 | 14d | 1 | 1.27mi |
| 6210 Brewton Dr Corpus Christi, TX | 3.0 | 2.0 | 1618 | $1,900 | $1.17 | 45d | 1 | 1.29mi |
| 5541 Candace St Corpus Christi, TX | 3.0 | 2.0 | 1484 | $1,795 | $1.21 | 14d | 1 | 1.30mi |
| 4438 Donegal Dr Corpus Christi, TX | 3.0 | 2.0 | 1628 | $1,900 | $1.17 | 14d | 1 | 1.36mi |
| 2930 Water Lily Dr Unit 1268443P Corpus Christi, TX | 3.0 | 2.0 | 2540 | $4,994 | $1.97 | 44d | 1 | 1.39mi |
| 3802 Saratoga Blvd Corpus Christi, TX | 1.0–3.0 | 1.0–2.0 | 1258 | $2,319 | $1.84 | 14d | 1 | 1.49mi |
| 4610 Donegal Dr Corpus Christi, TX | 4.0 | 2.0 | 2162 | $2,150 | $0.99 | 14d | 1 | 1.50mi |
Listing history 18 events
-
2026-06-18days on market $129,000 Active 91 DOM
-
2026-06-17days on market $129,000 Active 90 DOM
-
2026-06-16days on market $129,000 Active 89 DOM
-
2026-06-15days on market $129,000 Active 88 DOM
-
2026-06-14days on market $129,000 Active 86 DOM
-
2026-06-10days on market $129,000 Active 83 DOM
-
2026-06-09days on market $129,000 Active 82 DOM
-
2026-06-08days on market $129,000 Active 81 DOM
-
2026-06-07days on market $129,000 Active 80 DOM
-
2026-06-05days on market $129,000 Active 77 DOM
-
2026-06-03days on market $129,000 Active 76 DOM
-
2026-06-02days on market $129,000 Active 75 DOM
-
2026-06-01days on market $129,000 Active 74 DOM
-
2026-05-31days on market $129,000 Active 73 DOM
-
2026-05-30days on market $129,000 Active 72 DOM
-
2026-03-19$139,000 Active 261-char remark
Show marketing remark (261 chars)
If you’re ready to roll your sleeves up, this investor special is right for you. Good bones, good layout, good size and good location, this house is ready for someone to finish out and make their mark. (Being sold as is, with repairs and remodel needed. )
-
2024-06-07$129,000 Active
-
2021-03-16soldstatus
ⓘ Source: listings_history table (triggers on properties + properties_extension) + one-shot
backfill from property_details.listing_events for pre-trigger history.
Tax reassessment forecast TX · Resets to sale price
- Current annual tax
- $3,533 · $294/mo
- Projected year-2 tax
- $3,533 · $294/mo
- Expected delta
- $0/yr ($0/mo · 0.0%)
ⓘ Screening estimate from a state-policy table — verify with the county assessor before closing.
Climate risk First Street
- Flood 1/10 Low FEMA zone X (unshaded) · 0% chance over 30 yrs
- Wildfire 1/10 Low
- Heat 10/10 Extreme 7 d/yr ≥107°F today · 24 d/yr by 30 yrs out
- Wind 9/10 Extreme 99% chance of damaging wind over 30 yrs
- Air quality 1/10 Low 0 unhealthy d/yr today · 0 by 30 yrs out
Nearby sold comps map
Loading sold comps map…
Walkable amenities ~0.75 mi
Loading nearby amenities…
Taxation est. · year 1
- Rental income
- $25,341
- − Mortgage interest
- −$7,226
- − Property taxes
- −$3,533
- − Insurance
- −$645
- − Repairs & maintenance
- −$2,027
- − Management
- −$2,027
- − Depreciation
- −$3,753
- Taxable income
- $6,130
- Est. tax owed @ 24.0%
- −$1,471
- After-tax cash flow
- $6,252/yr
For passive investors: Depreciation is non-cash, so a rental often shows a tax loss while cash-flowing — sheltering income. Rental losses are passive: they offset passive income freely, and up to $25,000/yr can offset ordinary (W-2) income if you actively participate and your MAGI is under $100k (phasing out to $0 by $150k); unused losses carry forward. On sale, claimed depreciation is recaptured at up to 25%, and gains may owe capital-gains tax (a 1031 exchange can defer both). Figures are a year-1 estimate at your 24.0% rate — not tax advice; consult a CPA.
Schools (NCES district)
- District
- Corpus Christi ISD
- NCES district ID
- 4815270
- Math proficiency
- 31% ▼ -18.00%
- Reading proficiency
- 35% ▼ -7.00%
- Median HH income
- $45,672
- Composite
- 28.27/100
- National rank
- #6793
- State rank
- #562 of 826 in TX
Livability — Corpus Christi
- Score
- 78/100
- State rank
- #66
- US rank
- #2404
Category grades
Schools grade is shown separately in the Schools card above.
Census & demographics
- Census place
- Corpus Christi, TX
- County
- Nueces County · 296,836 people
- City population
- 296,836
- Metro
- Corpus Christi, TX
- Population (ZIP)
- 43,080
- Household income
- $54,990
- Rent vs Own
- Severe rent burden
- 1730.0
Population outlook (Nueces County) Hauer SSP2
- Today (2025)
- 418,037 people
- By 2030
- 447,123 · +7.0%
- By 2040
- 505,911 · +21.0%
- By 2050
- 567,522 · +35.8%
- By 2075
- 729,686 · +74.6%
- By 2100
- 847,087 · +102.6%
Race, ethnicity, and origin ACS 2023
- Neighborhood character
- Predominantly Hispanic (83%)
- Race & ethnicity
- Hispanic / Latino 83% Two or more races 41% White 12% Black 3%
- Hispanic origin (detail)
- Mexican 75%
- Foreign-born
- 9% · Canada
- Languages at home
- 59% English-only · Spanish 40%
Political lean MEDSL · Nueces
- 2024 margin
- R (+11.5) · D 43.8% · R 55.3%
- 2008→2024 swing
- -7.1pp toward R · 2008: -4.4pp · 2024: -11.5pp
- All cycles
- 2024: R+11.5 2020: R+2.9 2016: R+1.5 2012: R+3.2 2008: R+4.4
Not yet ingested
- Civics
- —
Market trends
- HPI YoY
- ▼ -173.20%
- Current HPI
- 158.011
- Rent YoY
- ▲ 2.32%
- Metro
- Corpus Christi, TX
- State GDP YoY
- ▲ 3.95%
- F500 in state
- 110
Industry mix (Fortune 500 HQ in TX)
| Industry | F500 HQs | Revenue |
|---|---|---|
| Energy | 16 | $1,198B |
|
||
| Technology | 5 | $198B |
|
||
| Engineering / Construction | 4 | $72B |
|
||
| Energy Services | 3 | $60B |
|
||
| Utilities | 3 | $41B |
|
||
| Healthcare | 2 | $330B |
|
||
Price history
+7.8% since first listed3 events — show timeline
- 2026-03-19 Listed $139,000 CBMLS
- 2024-06-07 Listed $129,000 CBMLS
- 2021-03-16 Sold (Public Records) — Public Records
Property tax history
+2.0%/yrLatest (2025): $3,533 · +3.3% YoY. Source: county tax records.
Cash-flow waterfall
monthlySold comps — $/sqft
last 12 mo · ≤1 miLoading sold comps…