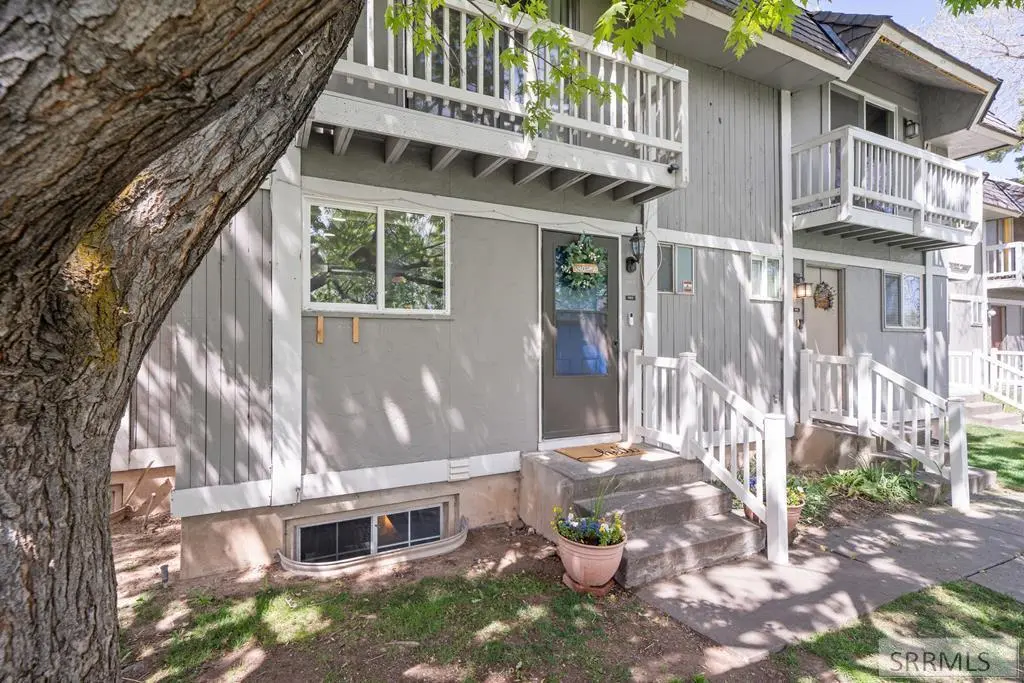
1460 S Falcon Dr · Ammon, ID
Flood risk 6/10 · Moderate
- FEMA flood zone
- X
- Chance of flooding over 30 yrs
- 0.8%
- Est. flood insurance / yr
- $473 – $860
Fire risk 1/10 · Minimal
- Est. fire insurance / yr
- $584 – $1,086
Heat risk 3/10 · Minor
- Hot days now (above 91°F)
- 7 days/yr
- Hot days in 30 yrs
- 17 days/yr
Wind risk 1/10 · Minimal
- Chance of severe wind over 30 yrs
- —
Air-quality risk 4/10 · Minor
- Unhealthy air days now
- 5 days/yr
- Unhealthy air days in 30 yrs
- 6 days/yr
Risk factors via First Street. Map © Google.
Why this score? — see what drove the F grade
The composite is a weighted blend of 9 inputs, each scored 0–100. Each bar is that input's sub-score; the figure is the points it added to the 100-point composite (weight × sub-score).
- ARV discount +7.5/15.0
- Cash flow +7.3/30.0
- Schools +4.2/10.0
- Livability +4.0/5.0
- Rent growth +3.4/5.0
- Condition / age +2.5/5.0
- 1% rule +2.1/10.0
- DSCR +1.5/10.0
- Appreciation +0.0/10.0
$230,000
🖨 Deal sheet 📄 Offer letter ✓ Due diligence
Listing remarks MLS
Great Investment Condo in Pheasant Estates! Central location, near College of Eastern Idaho. Updated paint, doors, flooring and bathrooms. Private BBQ area patio. This condo is move in ready! Make the call to set up a showing today!
Key facts
- Private patio
- Low-traffic street
- Prime location
Tags
Property features AI
Finance
- HOA & community: Homeowners association with a $225 monthly fee
Exterior
- Parking: Asphalt parking
- Utilities: Public water; Public sewer; Natural gas available
- Home design: Single family residence; Two levels (2 stories)
- Construction: Frame construction; Wood siding
- Exterior features: Rubber roof; Shed(s)
Interior
- Kitchen: Dishwasher; Refrigerator
- Flooring: Carpet; Laminate; Vinyl
- Bathrooms: 2 full bathrooms; 1 half bathroom
- Heating & cooling: Natural gas heating; Central air; Ceiling fan(s)
- Interior features: Pantry; Laminate counters; Water softener; Finished basement; Fireplace
- Laundry & utility: Washer; Dryer; Laundry in basement
Neighborhood map
What this means for you Summary
Snapshot
- This is a 3-bed/2.5-bath condo listed at $230k.
Deal economics
- At list price, monthly cash flow is $-304 ($-4k/yr) — negative.
- To cash-flow at today's rent, offer at most $176k (23.4% below list).
- To meet the 1% rule (rent ≥ 1% of price), the offer needs to be $164k (28.9% below list).
- Recommended offer: $164k (28.9% below list) — sets the bar for 1% rule.
Location & tenants
- Location reads 81/100 on livability (#12 in ID, #1,423 nationally) — a professional / high-income tenant draw. Strengths: housing A+, health & safety A+, crime A; Watch: amenities F, commute F.
- Bonneville Joint District (suburban): math 41% / reading 57% proficiency, ranked #30 of 92 in ID (top 33%) — families likely to look elsewhere, expect single-tenant / working-renter base with shorter leases.
- Zoned schools: Hillcrest High School (math 36% / reading 67%, grade D+, #37 of 169 statewide, top 21%, 1,161 students, 17% FRL).
- Market conditions: Rents rising (+3.5%/yr); 300 active listings in the ZIP; 18 comparable units currently listed for rent nearby; rentals at typical pace (median 21d on market — plan ~3-4 weeks tenant-placement turnaround); solid renter incomes; 2,253 units permitted in Bonneville County in 2024 (1,051 in 5+ unit buildings).
Forward outlook
- Local home prices are declining (-3.0%/yr); year-one equity from $2k of loan paydown is wiped out by about $7k of value loss. Plan a longer hold.
- Bonneville County population projected at +18% by 2050 — long-run rental-demand tailwind backs the buy-and-hold thesis.
Negotiation context
- It's been on market 38 days — a 3% lower offer ($223k) is reasonable based on typical stale-listing flexibility.
- 2 sale attempts since 7y ago; this cycle's ask has dropped $20k (8%) from the opening price — seller is motivated, your offer sets the floor, not the list.
Risks & watch-outs
- Climate carrying-cost: major flood risk — expect insurance premiums to compound above CPI over the hold.
Questions for the listing agent
- What do current leases actually rent for vs. the listed asking? Can we see a recent rent roll and the last 12 months of T-12 income?
- It's been on market 38 days. Have you received any prior offers? Is the seller open to a 29% concession, seller financing, or rate buy-down credit?
- Built in 1978 — when were the roof, HVAC, electrical panel, plumbing, and water heater last replaced?
- What does the HOA fee cover, when was the last increase, and are there any pending special assessments or reserve-fund shortfalls?
- Any open or pending special assessments — roof, HVAC, plumbing, elevator, façade? What's the per-unit balance and payoff schedule, and is the seller paying it off at close or rolling it to the buyer?
- Is there a deadline driving the sale (1031 exchange, divorce, estate, relocation)? That informs how much negotiation room exists.
- The area grade is low — what's the realistic commute time and amenity access for the typical tenant pool here? Any planned neighborhood developments (good or bad) we should know about?
- What's the average days-on-market for RENTAL listings here right now (not sales)? A rising rental-DOM trend means longer vacancies and softer asking-rent achievability than the comps imply.
- What's the recent tenant-quality profile in this submarket — average credit score on applications, eviction rate, late-payment / NSF rate, and stable-employment percentage? A property-management company in the area should have these aggregated.
- How much new apartment / multifamily construction is in the pipeline within 1–3 miles? Heavy new supply (>2% of stock underway) typically softens rents 12–24 months out; light construction supports rent growth.
Investment metrics
- 1% rule
- 0.71% ✗
- Cap rate
- 4.71%
- Cash-on-cash
- -5.67%
- DSCR
- 0.75
- GRM
- 11.7
CMA / ARV
No comps found within radius.
Projected returns pro-forma
-3.0% appreciation · 3.46% rent growth · sell at horizon
- IRR
- -25.5%
- Equity multiple
- 0.13×
- Total profit
- $-55,864
- Equity at exit
- $34,294
- IRR
- -20.4%
- Equity multiple
- -0.09×
- Total profit
- $-70,337
- Equity at exit
- $19,886
Cash invested: $64,400 (down + closing). Projections, not guarantees.
Landlord ↔ Tenant lean methodology
- Overall (STATE)
- 91 Strongly Landlord-Friendly
- State Idaho
- 91 Strongly Landlord-Friendly · R+18
- County
- — inherits STATE
- City
- — inherits STATE
ZIP-level market 83406
- Home prices YoY
- -20.1%
- Rents YoY
- 3.5%
- Active inventory
- 300
- Price-to-rent
- 11.7×
Monthly cashflow live
- Estimated rent
- $1,636 high interval (Pro) →
- Mortgage (P&I)
- −$1,206
- Tax from tax record
- −$70 /mo · $835/yr
- Insurance
- −$96
- HOA
- −$225
- Vacancy / Maint / Mgmt
- −$343
- Net cashflow
- $-304
Break-even live
UW: 25.0% down · 7.5% · 30yr · 1.5% tax · 5.0% vac · 8.0% maint · 8.0% mgmt
Financing live
Cash to close
- Down payment
- $57,500
- Closing costs
- $6,900
- Reserves months
- —
- Total cash needed
- —
Loan-product check · same deal, 3 products live
Conventional
25% down · 7.5% · 30yr
- Down + closing
- —
- Monthly P&I
- —
- Monthly cashflow
- —
- DSCR
- —
- Eligible?
- —
Personal DTI + credit; lowest rate.
DSCR
20% down · 8.5% · 30yr
- Down + closing
- —
- Monthly P&I
- —
- Monthly cashflow
- —
- DSCR
- —
- Eligible?
- —
No personal income docs; deal must DSCR.
Hard money
10% down · 12.0% · 12mo
- Down + closing
- —
- Monthly P&I
- —
- Monthly cashflow
- —
- DSCR
- —
- Eligible?
- —
Short-term bridge; refi at stabilization.
Rent comps 18 comps
| Address | Beds | Baths | Sqft | Rent | $/sqft | DOM | Units | Dist |
|---|---|---|---|---|---|---|---|---|
| 1451 Falcon Dr Ammon, ID | 2.0 | 1.0 | 956 | $1,235 | $1.29 | 13d | 1 | 0.08mi |
| 3050 E Chasewood Dr Unit NA Ammon, ID | 3.0 | 2.5 | 1600 | $1,650 | $1.03 | 21d | 1 | 0.32mi |
| 2135 Alan St Idaho Falls, ID | 2.0–3.0 | 1.0 | 1063 | $11,100 | $10.44 | 21d | 9 | 0.41mi |
| 1385 Remington Trl Ammon, ID | 3.0 | 2.5 | 1774 | $1,750 | $0.99 | 13d | 1 | 0.45mi |
| 3050 Chasewood Dr Ammon, ID | 3.0 | 2.5 | 1600 | $1,650 | $1.03 | 21d | 1 | 0.49mi |
| 1115 Hoopes Ave Idaho Falls, ID | 2.0 | 2.0 | 1150 | $1,399 | $1.22 | 21d | 1 | 0.56mi |
| 1900 Parkwood St Idaho Falls, ID | 1.0–2.0 | 1.0–2.0 | 824 | $1,955 | $2.37 | 21d | 1 | 0.75mi |
| 777 Hoopes Ave Idaho Falls, ID | 1.0–2.0 | 1.0–2.0 | 894 | $2,195 | $2.46 | 21d | 1 | 0.77mi |
| 2785 Eagle Dr Ammon, ID | 1.0–3.0 | 1.0–2.0 | 1119 | $1,868 | $1.67 | 13d | 18 | 0.78mi |
| 3500 Valencia Dr Idaho Falls, ID | 1.0–2.0 | 1.0 | 808 | $1,399 | $1.73 | 13d | 5 | 0.79mi |
| 1830 Balboa Dr Unit K Idaho Falls, ID | 2.0 | 1.0 | 1476 | $1,500 | $1.02 | 13d | 1 | 0.80mi |
| 1830 S Ammon Rd #1 Ammon, ID | 2.0 | 1.0 | 910 | $1,075 | $1.18 | 21d | 1 | 0.95mi |
| 1500 Big Sky Way Idaho Falls, ID | 1.0–2.0 | 1.0 | 761 | $1,399 | $1.84 | 13d | 3 | 1.06mi |
| 1414 E 17th St #1 Idaho Falls, ID | 2.0 | 1.0 | 1000 | $1,390 | $1.39 | 21d | 1 | 1.15mi |
| 2475 S Ammon Rd Ammon, ID | 2.0–3.0 | 1.0–2.0 | 991 | $1,626 | $1.64 | 13d | 7 | 1.15mi |
| 2775 Saint Clair Rd Idaho Falls, ID | 1.0–3.0 | 1.0–2.0 | 880 | $1,785 | $2.03 | 13d | 1 | 1.26mi |
| 1590 Bower Dr Idaho Falls, ID | 1.0–2.0 | 1.0–2.0 | 880 | $1,530 | $1.74 | 21d | 8 | 1.35mi |
| 2746 Judy St Ammon, ID | 2.0–3.0 | 1.0–2.0 | 1154 | $1,700 | $1.47 | 13d | 8 | 1.49mi |
HOA detail condo
- Monthly dues
- $225 · $2,700/yr
- Assessments
- None detected in remarks — confirm with the listing agent.
Listing history 21 events
-
2026-06-19days on market $230,000 Active 38 DOM
-
2026-06-18days on market $230,000 Active 37 DOM
-
2026-06-17days on market $230,000 Active 36 DOM
-
2026-06-16days on market $230,000 Active 35 DOM
-
2026-06-15price $230,000 Active 34 DOM
-
2026-06-15days on market $240,000 Active 34 DOM
-
2026-06-14days on market $240,000 Active 32 DOM
-
2026-06-13days on market $240,000 Active 31 DOM
-
2026-06-10days on market $240,000 Active 29 DOM
-
2026-06-09days on market $240,000 Active 28 DOM
-
2026-06-08days on market $240,000 Active 27 DOM
-
2026-06-07days on market $240,000 Active 26 DOM
-
2026-06-02days on market $240,000 Active 21 DOM
-
2026-06-01days on market $240,000 Active 20 DOM
-
2026-05-31days on market $240,000 Active 19 DOM
-
2026-05-30days on market $240,000 Active 18 DOM
-
2026-05-12$250,000 Active
-
2020-01-03soldstatus 232-char remark
Show marketing remark (232 chars)
Great Investment Condo in Pheasant Estates! Central location, near College of Eastern Idaho. Updated paint, doors, flooring and bathrooms. Private BBQ area patio. This condo is move in ready! Make the call to set up a showing today!
-
2020-01-03soldstatus
Show marketing remark (232 chars)
Great Investment Condo in Pheasant Estates! Central location, near College of Eastern Idaho. Updated paint, doors, flooring and bathrooms. Private BBQ area patio. This condo is move in ready! Make the call to set up a showing today!
-
2019-12-06$112,000 232-char remark
Show marketing remark (232 chars)
Great Investment Condo in Pheasant Estates! Central location, near College of Eastern Idaho. Updated paint, doors, flooring and bathrooms. Private BBQ area patio. This condo is move in ready! Make the call to set up a showing today!
-
2017-01-03soldstatus
ⓘ Source: listings_history table (triggers on properties + properties_extension) + one-shot
backfill from property_details.listing_events for pre-trigger history.
Tax reassessment forecast ID · Resets to sale price
- Current annual tax
- $835 · $70/mo
- Projected year-2 tax
- $1,587 · $132/mo
- Expected delta
- +$752/yr (+$63/mo · 90.1%)
ⓘ Screening estimate from a state-policy table — verify with the county assessor before closing.
Climate risk First Street
- Flood 6/10 Major FEMA zone X · 80% chance over 30 yrs
- Wildfire 1/10 Low
- Heat 3/10 Moderate 7 d/yr ≥91°F today · 17 d/yr by 30 yrs out
- Wind 1/10 Low
- Air quality 4/10 Moderate 5 unhealthy d/yr today · 6 by 30 yrs out
Nearby sold comps map
Loading sold comps map…
Walkable amenities ~0.75 mi
Loading nearby amenities…
Taxation est. · year 1
- Rental income
- $19,628
- − Mortgage interest
- −$12,884
- − Property taxes
- −$835
- − Insurance
- −$1,150
- − Repairs & maintenance
- −$1,570
- − Management
- −$1,570
- − HOA
- −$2,700
- − Depreciation
- −$6,691
- Taxable loss
- −$7,771
- Est. tax savings @ 24.0%
- +$1,865
- After-tax cash flow
- $-1,787/yr
For passive investors: Depreciation is non-cash, so a rental often shows a tax loss while cash-flowing — sheltering income. Rental losses are passive: they offset passive income freely, and up to $25,000/yr can offset ordinary (W-2) income if you actively participate and your MAGI is under $100k (phasing out to $0 by $150k); unused losses carry forward. On sale, claimed depreciation is recaptured at up to 25%, and gains may owe capital-gains tax (a 1031 exchange can defer both). Figures are a year-1 estimate at your 24.0% rate — not tax advice; consult a CPA.
Schools (NCES district)
- District
- Bonneville Joint District
- NCES district ID
- 1600930
- Math proficiency
- 41% ▼ -2.00%
- Reading proficiency
- 57% ▲ 1.00%
- Median HH income
- $55,775
- Composite
- 42.45/100
- National rank
- #3219
- State rank
- #30 of 92 in ID
Livability — Ammon
- Score
- 81/100
- State rank
- #12
- US rank
- #1423
Category grades
Schools grade is shown separately in the Schools card above.
Census & demographics
- Census place
- Ammon, ID
- County
- Bonneville County · 125,162 people
- City population
- 19,696
- Metro
- Idaho Falls, ID
- Population (ZIP)
- 19,696
- Household income
- $86,991
- Rent vs Own
- Severe rent burden
- 320.0
Population outlook (Bonneville County) Hauer SSP2
- Today (2025)
- 120,170 people
- By 2030
- 124,993 · +4.0%
- By 2040
- 134,091 · +11.6%
- By 2050
- 142,122 · +18.3%
- By 2075
- 157,767 · +31.3%
- By 2100
- 160,316 · +33.4%
Race, ethnicity, and origin ACS 2023
- Neighborhood character
- Predominantly White (85%)
- Race & ethnicity
- White 85% Hispanic / Latino 11% Two or more races 7% Asian 1%
- Hispanic origin (detail)
- Mexican 11%
- Common ancestry
- Portuguese 5% Slovak 4% Italian 2%
- Foreign-born
- 4% · Canada, China
- Languages at home
- 91% English-only · Spanish 7%
Political lean MEDSL · Bonneville
- 2024 margin
- Solid R (+45.4) · D 25.6% · R 71.0% · Other 3.4%
- 2008→2024 swing
- -2.4pp toward R · 2008: -43.0pp · 2024: -45.4pp
- All cycles
- 2024: R+45.4 2020: R+43.6 2016: R+40.2 2012: R+51.8 2008: R+43.0
Not yet ingested
- Civics
- —
Market trends
- HPI YoY
- ▼ -88.98%
- Current HPI
- 354.0195
- Rent YoY
- ▲ 3.46%
- Metro
- Idaho Falls, ID
- State GDP YoY
- ▲ 4.51%
- F500 in state
- 6
Industry mix (Fortune 500 HQ in ID)
| Industry | F500 HQs | Revenue |
|---|---|---|
| Retail | 1 | $79B |
|
||
| Technology | 1 | $25B |
|
||
| Food / Agriculture | 1 | $6B |
|
||
Price history
+123.2% since first listed5 events — show timeline
- 2026-05-12 Listed $250,000 SRMLS
- 2020-01-03 Sold (Public Records) — Public Records
- 2020-01-03 Sold (MLS) — SRMLS
- 2019-12-06 Listed $112,000 SRMLS
- 2017-01-03 Sold (Public Records) — Public Records
Property tax history
-1.5%/yrLatest (2025): $835 · +5.3% YoY. Source: county tax records.
Cash-flow waterfall
monthlySold comps — $/sqft
last 12 mo · ≤1 miLoading sold comps…