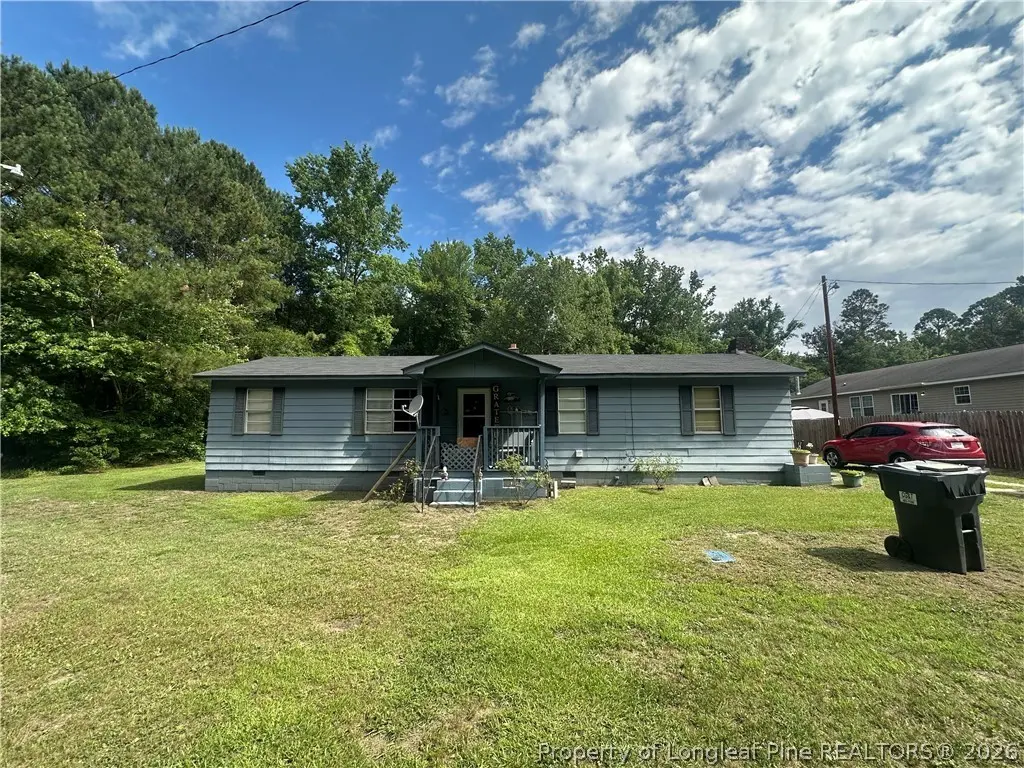
4835 Pine St · Linden, NC
Flood risk 3/10 · Minor
- FEMA flood zone
- X (unshaded)
- Chance of flooding over 30 yrs
- 0.2%
- Est. flood insurance / yr
- $507 – $1,088
Fire risk 7/10 · Major
- Est. fire insurance / yr
- $906 – $1,684
Heat risk 7/10 · Major
- Hot days now (above 107°F)
- 7 days/yr
- Hot days in 30 yrs
- 16 days/yr
Wind risk 6/10 · Moderate
- Chance of severe wind over 30 yrs
- 74.0%
Air-quality risk 1/10 · Minimal
- Unhealthy air days now
- 0 days/yr
- Unhealthy air days in 30 yrs
- 0 days/yr
Risk factors via First Street. Map © Google.
Why this score? — see what drove the B+ grade
The composite is a weighted blend of 9 inputs, each scored 0–100. Each bar is that input's sub-score; the figure is the points it added to the 100-point composite (weight × sub-score).
- Cash flow +30.0/30.0
- 1% rule +10.0/10.0
- DSCR +10.0/10.0
- Appreciation +10.0/10.0
- ARV discount +7.5/15.0
- Livability +3.2/5.0
- Schools +3.1/10.0
- Rent growth +2.5/5.0
- Condition / age +2.5/5.0
$79,999
🖨 Deal sheet 📄 Offer letter ✓ Due diligence
Listing remarks
INVESTOR SPECIAL - Welcome to 4835 Pine St — a prime fix & flip or buy-and-hold rental opportunity in Linden, NC! This 3 bedroom, 1 bathroom home offers 1,100 square feet of upside on a quiet lot just 15 minutes from downtown Fayetteville and all major amenities. FIX & FLIP NUMBERS: Medium rehab required with an ARV of $215,000 — priced at just 46% of ARV, leaving substantial margin for serious investors. BUY & HOLD NUMBERS: This deal comfortably surpasses the 1% rule, making it an ideal addition to any long-term rental portfolio. Whether you’re an experienced rehabber, a buy-and-hold investor, or a creative finance operator looking for cash flow with bui
Key facts
- 0.5 acre lot
- Built 1974
- Listed 14 days
Property features AI
Finance
- Other: Listed by Longleaf Pine Realtors / LPT REALTY LLC
Exterior
- Utilities: Public water; Public sewer
- Home design: Single-family residence; One level; Zoned RR (Rural Residential)
- Exterior features: Subdivision: LINDEN; Use GPS for directions
Interior
- Kitchen: Range; Refrigerator
- Bedrooms: 7 total rooms (includes bedrooms and living spaces)
- Flooring: Hardwood; Laminate
- Bathrooms: 1 full bathroom
- Heating & cooling: Heating present; Window unit(s); Whole house fan
- Interior features: Eat-in kitchen; Crawl space basement
- Laundry & utility: Washer hookup
Neighborhood map
What this means for you Summary
Snapshot
- This is a 3-bed/1.0-bath single-family listed at $80k.
Deal economics
- At list price, monthly cash flow is $907 ($11k/yr) — positive.
- The deal already cash-flows at list — no discount required.
- Meets the 1% rule at list price ($2k rent vs $80k).
Location & tenants
- Location reads 64/100 on livability (#344 in NC) — a middle-class / working-renter tenant base. Strengths: cost of living A+, housing A+, health & safety A+; Watch: crime D-, amenities F, commute F.
- Cumberland County Schools (urban): math 32% / reading 41% proficiency, ranked #126 of 178 in NC (top 71%) — families likely to look elsewhere, expect single-tenant / working-renter base with shorter leases.
- Zoned schools: Pine Forest Middle (math 38% / reading 49%, grade D, #182 of 475 statewide, top 40%, 738 students, 56% FRL); Pine Forest High (math 73% / reading 51%, grade B-, #184 of 535 statewide, top 37%, 1,572 students, 62% FRL) — zoned schools at 59% FRL track the district average.
- Zoned-school proficiency averages 53% at this address vs 36% district-wide (+16 pts) — the actual schools serving this property are materially stronger than the Cumberland County Schools average implies; a family-tenant draw the district grade alone would hide.
- Market conditions: 59 active listings in the ZIP; 1,125 units permitted in Cumberland County in 2024 (104 in 5+ unit buildings).
Forward outlook
- In year one you build about $9k of equity ($553 loan paydown + $8k appreciation (10.0% local appreciation)).
- At projected returns (10.0% appreciation + 3.0% rent growth), your $22k cash investment doubles in ~2 years — after that, you're playing with house money.
- By year 4, paydown + projected appreciation supports a ~$30k cash-out refi (75% LTV) — recoverable capital for the next deal without selling this one.
Negotiation context
- Only 14 days on market — expect competitive offers; lowballing is unlikely to land.
Risks & watch-outs
- Climate carrying-cost: major wind risk, 74% chance of damaging wind over 30y; major wildfire risk; extreme-heat days projected 7→16/yr by 2055 (HVAC capex compounding) — expect insurance premiums to compound above CPI over the hold.
Questions for the listing agent
- Built in 1974 — when were the roof, HVAC, electrical panel, plumbing, and water heater last replaced?
- Is there a deadline driving the sale (1031 exchange, divorce, estate, relocation)? That informs how much negotiation room exists.
- Schools are F-rated, which usually means shorter tenancies and higher turnover. Who's the typical renter profile here, and what's been the actual vacancy rate?
- Crime grade is D in this area — have there been break-ins, vandalism, or insurance claims at this property in the last 3 years? What carrier currently insures it and at what premium?
- What's the average days-on-market for RENTAL listings here right now (not sales)? A rising rental-DOM trend means longer vacancies and softer asking-rent achievability than the comps imply.
- What's the recent tenant-quality profile in this submarket — average credit score on applications, eviction rate, late-payment / NSF rate, and stable-employment percentage? A property-management company in the area should have these aggregated.
- How much new for-sale + rental construction is in the pipeline within 1–3 miles? Heavy new supply typically softens prices + rents 12–24 months out; constrained supply supports both.
Investment metrics
- 1% rule
- 2.31% ✓
- Cap rate
- 19.90%
- Cash-on-cash
- 48.60%
- DSCR
- 3.16
- GRM
- 3.6
CMA / ARV
No comps found within radius.
Projected returns pro-forma
10.0% appreciation · 3.0% rent growth · sell at horizon
- IRR
- 62.4%
- Equity multiple
- 5.53×
- Total profit
- $101,379
- Equity at exit
- $72,069
- IRR
- 56.0%
- Equity multiple
- 12.30×
- Total profit
- $253,160
- Equity at exit
- $155,420
Cash invested: $22,400 (down + closing). Projections, not guarantees.
Landlord ↔ Tenant lean methodology
- Overall (STATE)
- 85 Strongly Landlord-Friendly
- State North Carolina
- 85 Strongly Landlord-Friendly · R+3
- County
- — inherits STATE
- City
- — inherits STATE
ZIP-level market 28356
- Home prices YoY
- 16.1%
- Active inventory
- 59
- Price-to-rent
- 3.6×
Monthly cashflow live
- Estimated rent
- $1,848 medium interval (Pro) →
- Mortgage (P&I)
- −$420
- Tax from tax record
- −$100 /mo · $1,196/yr
- Insurance
- −$33
- HOA
- −$0
- Vacancy / Maint / Mgmt
- −$388
- Net cashflow
- $907
Break-even live
UW: 25.0% down · 7.5% · 30yr · 1.5% tax · 5.0% vac · 8.0% maint · 8.0% mgmt
Financing live
Cash to close
- Down payment
- $20,000
- Closing costs
- $2,400
- Reserves months
- —
- Total cash needed
- —
Loan-product check · same deal, 3 products live
Conventional
25% down · 7.5% · 30yr
- Down + closing
- —
- Monthly P&I
- —
- Monthly cashflow
- —
- DSCR
- —
- Eligible?
- —
Personal DTI + credit; lowest rate.
DSCR
20% down · 8.5% · 30yr
- Down + closing
- —
- Monthly P&I
- —
- Monthly cashflow
- —
- DSCR
- —
- Eligible?
- —
No personal income docs; deal must DSCR.
Hard money
10% down · 12.0% · 12mo
- Down + closing
- —
- Monthly P&I
- —
- Monthly cashflow
- —
- DSCR
- —
- Eligible?
- —
Short-term bridge; refi at stabilization.
Listing history 12 events
-
2026-06-18days on market $79,999 Active 14 DOM
-
2026-06-17price $79,999 Active 13 DOM
-
2026-06-17days on market $89,999 Active 13 DOM
-
2026-06-16days on market $89,999 Active 12 DOM
-
2026-06-15days on market $89,999 Active 11 DOM
-
2026-06-14days on market $89,999 Active 9 DOM
-
2026-06-13pricedays on market $89,999 Active 8 DOM
-
2026-06-10days on market $99,999 Active 6 DOM
-
2026-06-09days on market $99,999 Active 5 DOM
-
2026-06-08days on market $99,999 Active 4 DOM
-
2026-06-07remarks 669-char remark
-
2026-06-07$99,999 Active 3 DOM
ⓘ Source: listings_history table (triggers on properties + properties_extension) + one-shot
backfill from property_details.listing_events for pre-trigger history.
Tax reassessment forecast NC · Resets to sale price
- Current annual tax
- $1,196 · $100/mo
- Projected year-2 tax
- $1,196 · $100/mo
- Expected delta
- $0/yr ($0/mo · 0.0%)
ⓘ Screening estimate from a state-policy table — verify with the county assessor before closing.
Climate risk First Street
- Flood 3/10 Moderate FEMA zone X (unshaded) · 20% chance over 30 yrs
- Wildfire 7/10 Severe
- Heat 7/10 Severe 7 d/yr ≥107°F today · 16 d/yr by 30 yrs out
- Wind 6/10 Major 74% chance of damaging wind over 30 yrs
- Air quality 1/10 Low 0 unhealthy d/yr today · 0 by 30 yrs out
Nearby sold comps map
Loading sold comps map…
Walkable amenities ~0.75 mi
Loading nearby amenities…
Taxation est. · year 1
- Rental income
- $22,173
- − Mortgage interest
- −$4,481
- − Property taxes
- −$1,196
- − Insurance
- −$400
- − Repairs & maintenance
- −$1,774
- − Management
- −$1,774
- − Depreciation
- −$2,327
- Taxable income
- $10,221
- Est. tax owed @ 24.0%
- −$2,453
- After-tax cash flow
- $8,434/yr
For passive investors: Depreciation is non-cash, so a rental often shows a tax loss while cash-flowing — sheltering income. Rental losses are passive: they offset passive income freely, and up to $25,000/yr can offset ordinary (W-2) income if you actively participate and your MAGI is under $100k (phasing out to $0 by $150k); unused losses carry forward. On sale, claimed depreciation is recaptured at up to 25%, and gains may owe capital-gains tax (a 1031 exchange can defer both). Figures are a year-1 estimate at your 24.0% rate — not tax advice; consult a CPA.
Schools (NCES district)
- District
- Cumberland County Schools
- NCES district ID
- 3700011
- Math proficiency
- 32% ▼ -2.00%
- Reading proficiency
- 41% ▼ -1.00%
- Median HH income
- $44,168
- Composite
- 31.0/100
- National rank
- #6096
- State rank
- #126 of 178 in NC
Livability — Linden
- Score
- 64/100
- State rank
- #344
- US rank
- #13788
Category grades
Schools grade is shown separately in the Schools card above.
Census & demographics
- Population (ZIP)
- 5,747
Population outlook (Cumberland County) Hauer SSP2
- Today (2025)
- 330,855 people
- By 2030
- 333,523 · +0.8%
- By 2040
- 335,583 · +1.4%
- By 2050
- 335,325 · +1.4%
- By 2075
- 342,853 · +3.6%
- By 2100
- 340,698 · +3.0%
Race, ethnicity, and origin ACS 2023
- Neighborhood character
- Majority White (64%)
- Race & ethnicity
- White 64% Black 19% Hispanic / Latino 11% Two or more races 7% Native American 1% Asian 1%
- Hispanic origin (detail)
- Mexican 2% Puerto Rican 4%
- Common ancestry
- Lithuanian 3% Italian 2% Serbian 2%
- Foreign-born
- 3% · Canada, Jamaica
- Languages at home
- 90% English-only · Spanish 7% Other Indo-European 1% Russian/Polish/Slavic 1%
Political lean MEDSL · Cumberland
- 2024 margin
- D (+13.4) · D 56.1% · R 42.7% · Other 1.2%
- 2008→2024 swing
- -4.3pp toward R · 2008: 17.7pp · 2024: 13.4pp
- All cycles
- 2024: D+13.4 2020: D+16.6 2016: D+16.0 2012: D+19.7 2008: D+17.7
Not yet ingested
- Civics
- —
Market trends
- HPI YoY
- ▲ 40.02%
- Current HPI
- 289.2973
- Rent YoY
- —
- Metro
- —
- State GDP YoY
- ▲ 3.28%
- F500 in state
- 26
Industry mix (Fortune 500 HQ in NC)
| Industry | F500 HQs | Revenue |
|---|---|---|
| Financial Services | 2 | $213B |
|
||
| Retail | 2 | $95B |
|
||
| Industrial Conglomerate | 1 | $38B |
|
||
| Metals / Steel | 1 | $35B |
|
||
| Utilities | 1 | $30B |
|
||
| Industrial Machinery | 1 | $19B |
|
||
Price history
1 event — show timeline
- 2026-06-04 Listed $99,999 LPRMLS
Property tax history
+6.0%/yrLatest (2025): $1,196 · +86.7% YoY. Source: county tax records.
Cash-flow waterfall
monthlySold comps — $/sqft
last 12 mo · ≤1 miLoading sold comps…