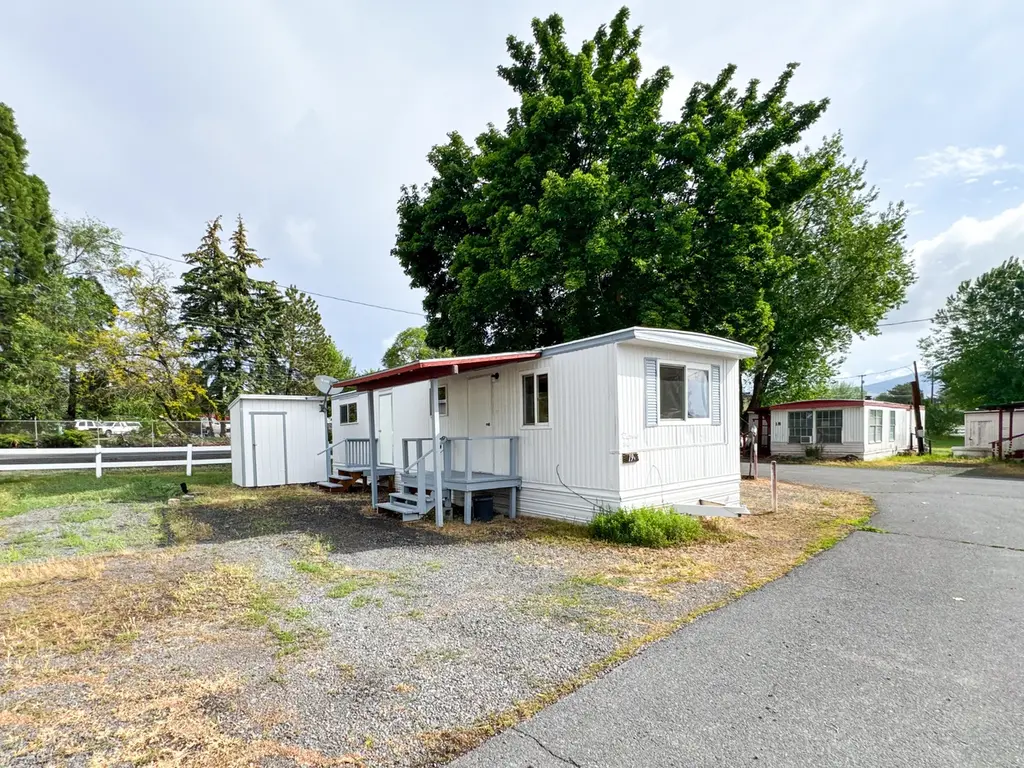
2055 Greensprings Dr Unit 19A · Klamath Falls, OR
Flood risk 1/10 · Minimal
- FEMA flood zone
- X
- Chance of flooding over 30 yrs
- 0.0%
- Est. flood insurance / yr
- $507 – $1,088
Fire risk 5/10 · Moderate
- Est. fire insurance / yr
- $498 – $926
Heat risk 3/10 · Minor
- Hot days now (above 91°F)
- 7 days/yr
- Hot days in 30 yrs
- 16 days/yr
Wind risk 1/10 · Minimal
- Chance of severe wind over 30 yrs
- —
Air-quality risk 10/10 · Severe
- Unhealthy air days now
- 29 days/yr
- Unhealthy air days in 30 yrs
- 31 days/yr
Risk factors via First Street. Map © Google.
Why this score? — see what drove the B grade
The composite is a weighted blend of 9 inputs, each scored 0–100. Each bar is that input's sub-score; the figure is the points it added to the 100-point composite (weight × sub-score).
- Cash flow +30.0/30.0
- 1% rule +10.0/10.0
- DSCR +10.0/10.0
- ARV discount +7.5/15.0
- Livability +3.9/5.0
- Condition / age +3.8/5.0
- Rent growth +3.3/5.0
- Schools +2.7/10.0
- Appreciation +0.0/10.0
$25,500
🖨 Deal sheet 📄 Offer letter ✓ Due diligence
Listing remarks
Affordable, updated, and move in ready! This adorable 1 bedroom, 1 bathroom home features fresh interior and exterior paint, beautiful new vinyl flooring, and a recently updated membrane roof for added peace of mind. With 480 sq ft of comfortable, low maintenance living space, this home offers simplicity, convenience, and value all in one. Located in a park setting and priced at just $25,500, this is a fantastic opportunity for affordable homeownership!
Key facts
- Park setting
- Fresh interior paint
- Fresh exterior paint
Tags
Property features AI
Finance
- Other: Not currently rented; No audio or video surveillance on premises; Short-term rentals not permitted
- Financial info: Monthly land lease: $460
- HOA & community: CC&R's apply
Exterior
- Parking: Gravel parking
- Utilities: Public water; Public sewer; Electricity connected
- Home design: Mobile home (single wide) located in a park; One level; May remain in park; Situated on leased land
- Construction: Built in 1972; Pillar/post/pier foundation; Manufactured by Fleetwood
- Exterior features: Membrane roof
Interior
- Bedrooms: 1 bedroom
- Flooring: Vinyl flooring
- Bathrooms: 1 full bathroom
- Heating & cooling: Electric heating; No cooling
- Interior features: Shower/tub combo; Living room
Neighborhood map
What this means for you Summary
Snapshot
- This is a 1-bed/1.0-bath manufactured listed at $26k. Condition is rated good.
Deal economics
- At list price, monthly cash flow is $576 ($7k/yr) — positive.
- The deal already cash-flows at list — no discount required.
- Meets the 1% rule at list price ($952 rent vs $26k).
- Recommended offer: $25k (1.5% below list) — sets the bar for market timing.
- Cap rate 33.4% vs local median 3.4% in Klamath Falls — top-decile yield for the area; either an underpriced asset or a hidden risk that comps aren't pricing in. Stress-test before assuming the spread holds.
Location & tenants
- Location reads 78/100 on livability (#67 in OR, #2,703 nationally) — a middle-class / working-renter tenant base. Strengths: commute A+, cost of living A+, housing A+; Watch: crime F, employment F.
- Klamath Falls City Schools (town): math 26% / reading 40% proficiency, ranked #36 of 58 in OR (top 62%) — families likely to look elsewhere, expect single-tenant / working-renter base with shorter leases; 62% free/reduced lunch — lower-income household profile, screen leases tightly.
- Zoned schools: Mills Elementary School (math 15% / reading 15%, grade F, #392 of 412 statewide, top 96%, 312 students, 90% FRL); Ponderosa Middle School (math 27% / reading 41%, grade F, #71 of 128 statewide, top 56%, 565 students, 88% FRL); Klamath Union High School (math 15% / reading 64%, grade F, #69 of 143 statewide, top 54%, 645 students, 89% FRL) — zoned schools average 89% FRL vs 62% district-wide (28 pts higher); higher-poverty schools than district average — tighter screening recommended.
- Market conditions: Rents rising (+3.1%/yr); 493 active listings in the ZIP; 232 units permitted in Klamath County in 2024 (72 in 5+ unit buildings).
Forward outlook
- Local home prices are declining (-3.0%/yr); year-one equity from $176 of loan paydown is wiped out by about $765 of value loss. Plan a longer hold.
- Klamath County population projected at -12% by 2050 — secular population decline; favor cash flow + early exit over multi-decade hold.
- At projected returns (-3.0% appreciation + 3.1% rent growth), your $7k cash investment doubles in ~2 years — after that, you're playing with house money.
Negotiation context
- It's been on market 22 days — a 2% lower offer ($25k) is reasonable based on typical stale-listing flexibility.
Risks & watch-outs
- Climate carrying-cost: moderate wildfire risk — expect insurance premiums to compound above CPI over the hold.
Questions for the listing agent
- Built in 1972 — when were the roof, HVAC, electrical panel, plumbing, and water heater last replaced?
- Is there a deadline driving the sale (1031 exchange, divorce, estate, relocation)? That informs how much negotiation room exists.
- Schools are D-rated, which usually means shorter tenancies and higher turnover. Who's the typical renter profile here, and what's been the actual vacancy rate?
- Crime grade is F in this area — have there been break-ins, vandalism, or insurance claims at this property in the last 3 years? What carrier currently insures it and at what premium?
- What's the average days-on-market for RENTAL listings here right now (not sales)? A rising rental-DOM trend means longer vacancies and softer asking-rent achievability than the comps imply.
- What's the recent tenant-quality profile in this submarket — average credit score on applications, eviction rate, late-payment / NSF rate, and stable-employment percentage? A property-management company in the area should have these aggregated.
- How much new for-sale + rental construction is in the pipeline within 1–3 miles? Heavy new supply typically softens prices + rents 12–24 months out; constrained supply supports both.
Investment metrics
- 1% rule
- 3.73% ✓
- Cap rate
- 33.40%
- Cash-on-cash
- 96.82%
- DSCR
- 5.31
- GRM
- 2.2
CMA / ARV
No comps found within radius.
Projected returns pro-forma
-3.0% appreciation · 3.12% rent growth · sell at horizon
- IRR
- 97.9%
- Equity multiple
- 5.58×
- Total profit
- $32,688
- Equity at exit
- $3,802
- IRR
- —
- Equity multiple
- 11.68×
- Total profit
- $76,241
- Equity at exit
- $2,205
Cash invested: $7,140 (down + closing). Projections, not guarantees.
Landlord ↔ Tenant lean methodology
- Overall (STATE)
- 28 Tenant-Leaning
- State Oregon
- 28 Tenant-Leaning · D+6
- County
- — inherits STATE
- City
- — inherits STATE
ZIP-level market 97601
- Home prices YoY
- -3.7%
- Rents YoY
- 3.1%
- Active inventory
- 493
- Price-to-rent
- 2.2×
Monthly cashflow live
- Estimated rent
- $952 medium interval (Pro) →
- Mortgage (P&I)
- −$134
- Tax est. 1.5%
- −$32 /mo · $382/yr
- Insurance
- −$11
- HOA
- −$0
- Vacancy / Maint / Mgmt
- −$200
- Net cashflow
- $576
Break-even live
UW: 25.0% down · 7.5% · 30yr · 1.5% tax · 5.0% vac · 8.0% maint · 8.0% mgmt
Financing live
Cash to close
- Down payment
- $6,375
- Closing costs
- $765
- Reserves months
- —
- Total cash needed
- —
Loan-product check · same deal, 3 products live
Conventional
25% down · 7.5% · 30yr
- Down + closing
- —
- Monthly P&I
- —
- Monthly cashflow
- —
- DSCR
- —
- Eligible?
- —
Personal DTI + credit; lowest rate.
DSCR
20% down · 8.5% · 30yr
- Down + closing
- —
- Monthly P&I
- —
- Monthly cashflow
- —
- DSCR
- —
- Eligible?
- —
No personal income docs; deal must DSCR.
Hard money
10% down · 12.0% · 12mo
- Down + closing
- —
- Monthly P&I
- —
- Monthly cashflow
- —
- DSCR
- —
- Eligible?
- —
Short-term bridge; refi at stabilization.
Listing history 17 events
-
2026-06-19days on market $25,500 Active 22 DOM
-
2026-06-18days on market $25,500 Active 21 DOM
-
2026-06-17days on market $25,500 Active 20 DOM
-
2026-06-16days on market $25,500 Active 19 DOM
-
2026-06-15days on market $25,500 Active 18 DOM
-
2026-06-14days on market $25,500 Active 16 DOM
-
2026-06-12days on market $25,500 Active 15 DOM
-
2026-06-09days on market $25,500 Active 12 DOM
-
2026-06-08days on market $25,500 Active 11 DOM
-
2026-06-07days on market $25,500 Active 10 DOM
-
2026-06-05days on market $25,500 Active 7 DOM
-
2026-06-03days on market $25,500 Active 6 DOM
-
2026-06-02days on market $25,500 Active 5 DOM
-
2026-06-01days on market $25,500 Active 4 DOM
-
2026-05-31days on market $25,500 Active 3 DOM
-
2026-05-30days on market $25,500 Active 2 DOM
-
2026-05-28$25,500 Active
ⓘ Source: listings_history table (triggers on properties + properties_extension) + one-shot
backfill from property_details.listing_events for pre-trigger history.
Climate risk First Street
- Flood 1/10 Low FEMA zone X · 0% chance over 30 yrs
- Wildfire 5/10 Major
- Heat 3/10 Moderate 7 d/yr ≥91°F today · 16 d/yr by 30 yrs out
- Wind 1/10 Low
- Air quality 10/10 Extreme 29 unhealthy d/yr today · 31 by 30 yrs out
Nearby sold comps map
Loading sold comps map…
Walkable amenities ~0.75 mi
Loading nearby amenities…
Taxation est. · year 1
- Rental income
- $11,427
- − Mortgage interest
- −$1,428
- − Property taxes
- −$382
- − Insurance
- −$128
- − Repairs & maintenance
- −$914
- − Management
- −$914
- − Depreciation
- −$742
- Taxable income
- $6,919
- Est. tax owed @ 24.0%
- −$1,661
- After-tax cash flow
- $5,252/yr
For passive investors: Depreciation is non-cash, so a rental often shows a tax loss while cash-flowing — sheltering income. Rental losses are passive: they offset passive income freely, and up to $25,000/yr can offset ordinary (W-2) income if you actively participate and your MAGI is under $100k (phasing out to $0 by $150k); unused losses carry forward. On sale, claimed depreciation is recaptured at up to 25%, and gains may owe capital-gains tax (a 1031 exchange can defer both). Figures are a year-1 estimate at your 24.0% rate — not tax advice; consult a CPA.
Condition & rehab AI · 12 photos
This move-in ready manufactured home offers a good condition with fresh updates and low maintenance living space.
Value-add opportunities
- Resale paint exterior — enhances curb appeal
- Rental replace shower curtain — improves bathroom aesthetics
Renovation cost estimate screening
Value-add ROI direction
- Resale paint exterior — enhances curb appeal ↑
- Rental replace shower curtain — improves bathroom aesthetics ↑
ⓘ Cost ranges are severity-bucket heuristics (US national rule-of-thumb). Get contractor quotes + a written scope before underwriting a rehab budget.
Schools (NCES district)
- District
- Klamath Falls City Schools
- NCES district ID
- 4107080
- Math proficiency
- 26% ▼ -6.00%
- Reading proficiency
- 40% ▼ -3.00%
- Median HH income
- $34,329
- Composite
- 27.14/100
- National rank
- #7033
- State rank
- #36 of 58 in OR
Livability — Klamath Falls
- Score
- 78/100
- State rank
- #67
- US rank
- #2703
Category grades
Schools grade is shown separately in the Schools card above.
Census & demographics
- County
- Klamath County · 56,186 people
- City population
- 56,186
- Metro
- Klamath Falls, OR
- Population (ZIP)
- 22,964
- Household income
- $51,780
- Rent vs Own
- Severe rent burden
- 1323.0
Population outlook (Klamath County) Hauer SSP2
- Today (2025)
- 63,870 people
- By 2030
- 62,279 · -2.5%
- By 2040
- 58,891 · -7.8%
- By 2050
- 56,207 · -12.0%
- By 2075
- 51,239 · -19.8%
- By 2100
- 46,526 · -27.2%
Race, ethnicity, and origin ACS 2023
- Neighborhood character
- Predominantly White (76%)
- Race & ethnicity
- White 76% Hispanic / Latino 12% Two or more races 10% Native American 3% Asian 2%
- Hispanic origin (detail)
- Mexican 9%
- Common ancestry
- Lithuanian 4% Slovak 3% Portuguese 2%
- Foreign-born
- 4% · Canada
- Languages at home
- 92% English-only · Spanish 6%
Political lean MEDSL · Klamath
- 2024 margin
- Solid R (+41.9) · D 27.9% · R 69.8% · Other 2.4%
- 2008→2024 swing
- -8.8pp toward R · 2008: -33.1pp · 2024: -41.9pp
- All cycles
- 2024: R+41.9 2020: R+40.6 2016: R+44.8 2012: R+38.2 2008: R+33.1
Not yet ingested
- Civics
- —
Market trends
- HPI YoY
- ▼ -14.37%
- Current HPI
- 372.5418
- Rent YoY
- ▲ 3.12%
- Metro
- Klamath Falls, OR
- State GDP YoY
- ▲ 2.05%
- F500 in state
- 2
Industry mix (Fortune 500 HQ in OR)
| Industry | F500 HQs | Revenue |
|---|---|---|
| Consumer Goods | 1 | $51B |
|
||
Price history
1 event — show timeline
- 2026-05-28 Listed $25,500 MLSCO
Cash-flow waterfall
monthlySold comps — $/sqft
last 12 mo · ≤1 miLoading sold comps…