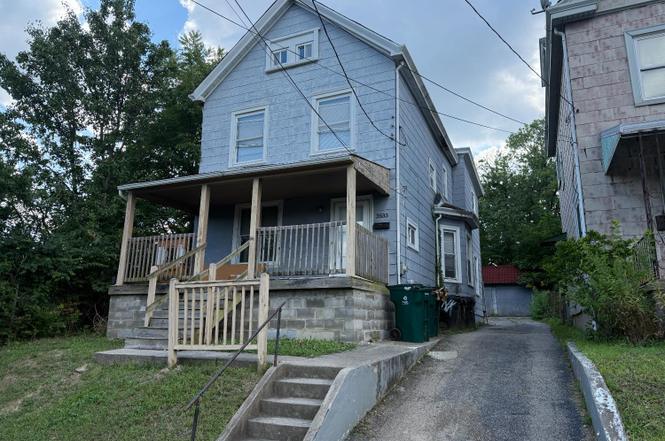
3533 Evanston Ave · Cincinnati, OH
Flood risk 1/10 · Minimal
- FEMA flood zone
- X (unshaded)
- Chance of flooding over 30 yrs
- 0.0%
- Est. flood insurance / yr
- $473 – $860
Fire risk 1/10 · Minimal
- Est. fire insurance / yr
- $713 – $1,323
Heat risk 4/10 · Minor
- Hot days now (above 103°F)
- 7 days/yr
- Hot days in 30 yrs
- 19 days/yr
Wind risk 2/10 · Minimal
- Chance of severe wind over 30 yrs
- 1.0%
Air-quality risk 3/10 · Minor
- Unhealthy air days now
- 2 days/yr
- Unhealthy air days in 30 yrs
- 3 days/yr
Risk factors via First Street. Map © Google.
Why this score? — see what drove the B- grade
The composite is a weighted blend of 9 inputs, each scored 0–100. Each bar is that input's sub-score; the figure is the points it added to the 100-point composite (weight × sub-score).
- Cash flow +29.4/30.0
- DSCR +10.0/10.0
- 1% rule +8.2/10.0
- ARV discount +7.5/15.0
- Livability +4.0/5.0
- Rent growth +2.5/5.0
- Schools +2.5/10.0
- Condition / age +2.5/5.0
- Appreciation +0.0/10.0
$170,000
🖨 Deal sheet 📄 Offer letter ✓ Due diligence
Listing remarks MLS
Welcome to 3533 Evanston AveA Prime Opportunity in a Rapidly Rising Neighborhood This spacious 4-bedroom, 1-bath home is ready for a full renovation and packed with potential. Located in the heart of Evanston, where revitalization is happening block by block, this property is a golden opportunity for investors and visionaries alike. With homes being transformed throughout the area and values steadily climbing, 3533 Evanston Ave offers the chance to create something truly special. Whether you're looking to flip, rent, or restore, this is one you don't want to miss.
Key facts
- 4,530 sq ft lot
- 3 garage spots
- Built 1900
Property features AI
Finance
- Financial info: Lease not considered
- HOA & community: No HOA
Exterior
- Parking: 3 garage spaces; Rear access with detached carport
- Utilities: Public water; Public sewer; Natural gas service
- Home design: Traditional single-family home; Three or more levels; Second floor area: 768 (unit not listed)
- Construction: Foundation: block and poured; Construction materials listed as 'Other'
- Exterior features: Shingle roof; Vinyl and wood windows; Residential zoning
Interior
- Kitchen: Separate dining room (level 1); Living room on level 1
- Bedrooms: 4 bedrooms (all on level 2); Primary bedroom with additional features listed as 'Other'
- Bathrooms: 1 full bathroom (located on level 2)
- Heating & cooling: Forced air heating (gas); Gas water heating
- Interior features: Partial basement; Total of 8 rooms
Neighborhood map
What this means for you Summary
Snapshot
- This is a 4-bed/1.5-bath single-family listed at $170k.
Deal economics
- At list price, monthly cash flow is $602 ($7k/yr) — positive.
- The deal already cash-flows at list — no discount required.
- Meets the 1% rule at list price ($2k rent vs $170k).
- Recommended offer: $155k (9.0% below list) — sets the bar for market timing.
- Cap rate 10.5% vs local median 3.9% in Cincinnati — top-decile yield for the area; either an underpriced asset or a hidden risk that comps aren't pricing in. Stress-test before assuming the spread holds.
Location & tenants
- Location reads 80/100 on livability (#130 in OH, #1,856 nationally) — a professional / high-income tenant draw. Strengths: amenities A+, commute A+, cost of living A+; Watch: employment D, crime F.
- Cincinnati Public Schools (urban): math 25% / reading 36% proficiency, ranked #581 of 656 in OH (top 89%) — families likely to look elsewhere, expect single-tenant / working-renter base with shorter leases; 70% free/reduced lunch — lower-income household profile, screen leases tightly.
- Market conditions: 51 active listings in the ZIP; 28 comparable units currently listed for rent nearby; rentals at typical pace (median 20d on market — plan ~3-4 weeks tenant-placement turnaround); 801 units permitted in Hamilton County in 2024 (190 in 5+ unit buildings).
- At $2,241/mo this rent would consume 54% of the median local household income ($50k/yr) (locally 422% of renters already pay >50% of income on rent) — very limited rent-growth headroom before tenants either downsize or default.
Forward outlook
- Local home prices are declining (-3.0%/yr); year-one equity from $1k of loan paydown is wiped out by about $5k of value loss. Plan a longer hold.
- At projected returns (-3.0% appreciation + 3.0% rent growth), your $48k cash investment doubles in ~8 years — after that, you're playing with house money.
Negotiation context
- It's been on market 120 days — a 9% lower offer ($155k) is reasonable based on typical stale-listing flexibility.
- 11 sale attempts since 26y ago with the ask held roughly flat each time — persistent listings suggest the price (not the market) is what's stuck; bring a comps-based counter.
- Current owner paid $52k; list at $170k implies a 227% gain — meaningful room to come down on a strong offer.
Risks & watch-outs
- Watch-outs: built in 1900 — expect roof / HVAC / electrical / plumbing capex.
Questions for the listing agent
- It's been on market 120 days. Have you received any prior offers? Is the seller open to a 9% concession, seller financing, or rate buy-down credit?
- Built in 1900 — when were the roof, HVAC, electrical panel, plumbing, and water heater last replaced?
- Why hasn't it sold? Are there any deal-killer items the seller is aware of (foundation, flood, title, zoning, code violations)?
- Is there a deadline driving the sale (1031 exchange, divorce, estate, relocation)? That informs how much negotiation room exists.
- Schools are B-rated — typically a magnet for longer-tenancy family renters. What's the average tenant stay here, and is there a school-zone premium baked into asking?
- Crime grade is F in this area — have there been break-ins, vandalism, or insurance claims at this property in the last 3 years? What carrier currently insures it and at what premium?
- What's the average days-on-market for RENTAL listings here right now (not sales)? A rising rental-DOM trend means longer vacancies and softer asking-rent achievability than the comps imply.
- What's the recent tenant-quality profile in this submarket — average credit score on applications, eviction rate, late-payment / NSF rate, and stable-employment percentage? A property-management company in the area should have these aggregated.
- How much new for-sale + rental construction is in the pipeline within 1–3 miles? Heavy new supply typically softens prices + rents 12–24 months out; constrained supply supports both.
Investment metrics
- 1% rule
- 1.32% ✓
- Cap rate
- 10.54%
- Cash-on-cash
- 15.17%
- DSCR
- 1.68
- GRM
- 6.3
CMA / ARV
- ARV (on-the-fly)
- $346,248
- Comps found
- 12
Show comp detail 12 sales within ~0.75 mi
| Address | Dist | Beds/Ba | Sqft | Sold | Price | $/sf | Match |
|---|---|---|---|---|---|---|---|
| 3766 Floral Ave | 0.45mi | 5/1.5 (+1) | 1,813 (-1%) | 1mo | $325,000 | $179 | 72 |
| 3743 Spencer Ave | 0.34mi | 3/2.5 (-1) | 1,750 (-4%) | 1mo | $360,000 | $206 | 67 |
| 3314 Wabash Ave | 0.40mi | 4/1.5 | 1,614 (-12%) | 1mo | $168,000 | $104 | 60 |
| 3923 S Madison Ave | 0.74mi | 4/1.5 | 1,901 (+4%) | 2mo | $360,000 | $189 | 58 |
| 3732 Elsmere Ave | 0.36mi | 3/2.0 (-1) | 1,634 (-11%) | 1mo | $325,000 | $199 | 57 |
| 3443 Woodburn Ave | 0.69mi | 5/2.0 (+1) | 1,810 (-1%) | 2mo | $125,000 | $69 | 57 |
| 3600 Tamarack Ave | 0.49mi | 3/3.0 (-1) | 1,940 (+6%) | 1mo | $356,400 | $184 | 56 |
| 2497 Downing Dr | 0.62mi | 3/2.0 (-1) | 1,711 (-7%) | 1mo | $505,000 | $295 | 52 |
| 1608 Brewster Ave | 0.59mi | 4/1.0 | 1,576 (-14%) | 2mo | $147,500 | $94 | 46 |
| 3423 Algona Pl | 0.65mi | 4/2.5 | 1,613 (-12%) | 0mo | $336,000 | $208 | 45 |
| 1606 Brewster Ave | 0.60mi | 3/2.0 (-1) | 1,600 (-13%) | 2mo | $150,000 | $94 | 42 |
| 4009 Forest Ave | 0.74mi | 3/1.5 (-1) | 1,647 (-10%) | 2mo | $329,500 | $200 | 42 |
Match score weights: distance 35% · size 25% · config 20% · recency 20%. Top-matched comps best support the ARV.
Projected returns pro-forma
-3.0% appreciation · 3.0% rent growth · sell at horizon
- IRR
- 5.8%
- Equity multiple
- 1.23×
- Total profit
- $10,813
- Equity at exit
- $25,348
- IRR
- 15.3%
- Equity multiple
- 2.24×
- Total profit
- $58,892
- Equity at exit
- $14,698
Cash invested: $47,600 (down + closing). Projections, not guarantees.
Landlord ↔ Tenant lean methodology
- Overall (STATE)
- 73 Landlord-Friendly
- State Ohio
- 73 Landlord-Friendly · R+6
- County
- — inherits STATE
- City
- — inherits STATE
ZIP-level market 45207
- Home prices YoY
- -34.6%
- Active inventory
- 51
- Price-to-rent
- 6.3×
Monthly cashflow live
- Estimated rent
- $2,241 high interval (Pro) →
- Mortgage (P&I)
- −$891
- Tax from tax record
- −$206 /mo · $2,471/yr
- Insurance
- −$71
- HOA
- −$0
- Vacancy / Maint / Mgmt
- −$471
- Net cashflow
- $602
Break-even live
UW: 25.0% down · 7.5% · 30yr · 1.5% tax · 5.0% vac · 8.0% maint · 8.0% mgmt
Financing live
Cash to close
- Down payment
- $42,500
- Closing costs
- $5,100
- Reserves months
- —
- Total cash needed
- —
Loan-product check · same deal, 3 products live
Conventional
25% down · 7.5% · 30yr
- Down + closing
- —
- Monthly P&I
- —
- Monthly cashflow
- —
- DSCR
- —
- Eligible?
- —
Personal DTI + credit; lowest rate.
DSCR
20% down · 8.5% · 30yr
- Down + closing
- —
- Monthly P&I
- —
- Monthly cashflow
- —
- DSCR
- —
- Eligible?
- —
No personal income docs; deal must DSCR.
Hard money
10% down · 12.0% · 12mo
- Down + closing
- —
- Monthly P&I
- —
- Monthly cashflow
- —
- DSCR
- —
- Eligible?
- —
Short-term bridge; refi at stabilization.
Rent comps 28 comps
| Address | Beds | Baths | Sqft | Rent | $/sqft | DOM | Units | Dist |
|---|---|---|---|---|---|---|---|---|
| 3508 Bevis Ave Cincinnati, OH | 5.0 | 2.0 | 1744 | $2,400 | $1.38 | 1d | 1 | 0.13mi |
| 1725 Cleneay Ave Norwood, OH | 1.0–5.0 | 1.0–5.0 | 1060 | $2,827 | $2.67 | 1d | 46 | 0.47mi |
| 3901 Elsmere Ave Cincinnati, OH | 3.0 | 2.0 | 1415 | $1,995 | $1.41 | 2d | 1 | 0.52mi |
| 3921 Spencer Ave Apt 2 Norwood, OH | 4.0 | 1.0 | 1636 | $2,400 | $1.47 | 17d | 1 | 0.54mi |
| 3915 Lindley Ave Unit 2 Norwood, OH | 4.0 | 2.0 | 1500 | $1,950 | $1.30 | 43d | 1 | 0.54mi |
| 2365 Madison Rd Cincinnati, OH | 1.0–3.0 | 1.0–2.0 | 1100 | $1,600 | $1.45 | 23d | 1 | 0.57mi |
| 3326 Fairfield Ave Cincinnati, OH | 3.0 | 2.0 | 1566 | $1,600 | $1.02 | 10d | 1 | 0.57mi |
| 3550 Woodburn Ave Cincinnati, OH | 3.0 | 1.0 | 1308 | $2,000 | $1.53 | 14d | 1 | 0.62mi |
| 1710 Fairfax Ave Unit 1710 Cincinnati, OH | 5.0 | 2.0 | 1500 | $2,000 | $1.33 | 23d | 1 | 0.77mi |
| 1931 Delaware Ave Unit 2 Norwood, OH | 3.0 | 2.0 | 1650 | $1,810 | $1.10 | 43d | 1 | 0.78mi |
| 2123 Cameron Ave Cincinnati, OH | 4.0 | 2.5 | 2165 | $4,500 | $2.08 | 43d | 1 | 0.81mi |
| 1718 Dexter Ave Cincinnati, OH | 4.0 | 2.0 | 2539 | $2,100 | $0.83 | 23d | 1 | 0.83mi |
| 1524 Ruth Ave Unit 2 Cincinnati, OH | 4.0 | 1.0 | 1971 | $1,595 | $0.81 | 23d | 1 | 0.85mi |
| 3538 Burch Ave #2 Cincinnati, OH | 3.0 | 1.0 | 1485 | $2,250 | $1.52 | 1d | 1 | 0.88mi |
| 3131 Harvard Ave Cincinnati, OH | 3.0 | 1.0 | 1264 | $1,645 | $1.30 | 23d | 1 | 0.91mi |
| 3209 Gilbert Ave Unit 2 Cincinnati, OH | 4.0 | 2.0 | 1548 | $1,395 | $0.90 | 2d | 1 | 0.92mi |
| 3113 Harvard Ave Cincinnati, OH | 4.0 | 3.0 | 1895 | $2,700 | $1.42 | 14d | 1 | 0.94mi |
| 3139 Gaff Ave Cincinnati, OH | 3.0 | 2.0 | 1711 | $1,795 | $1.05 | 16d | 1 | 1.13mi |
| 979 Burton Ave Cincinnati, OH | 3.0 | 1.0 | 1725 | $1,595 | $0.92 | 2d | 1 | 1.17mi |
| 1607 Asmann Ave Cincinnati, OH | 1.0–4.0 | 1.0–1.5 | 1069 | $1,695 | $1.58 | 12d | 6 | 1.19mi |
| 870 Rockdale Ave Cincinnati, OH | 4.0 | 2.0 | 1749 | $1,800 | $1.03 | 23d | 1 | 1.27mi |
| 1709 Sherman Ave Unit 2 Cincinnati, OH | 4.0 | 2.0 | 1500 | $2,300 | $1.53 | 1d | 1 | 1.28mi |
| 3028 Gilbert Ave Cincinnati, OH | 5.0 | 1.5 | 1936 | $1,700 | $0.88 | 20d | 1 | 1.30mi |
| 2320 Kenilworth Ave Cincinnati, OH | 3.0 | 2.5 | 1660 | $2,300 | $1.39 | 20d | 1 | 1.32mi |
| 2607 Robertson Ave Unit 2 ROBERTSON 2607 Cincinnati, OH | 3.0 | 1.0 | 1399 | $1,895 | $1.35 | 43d | 1 | 1.36mi |
| 2533 Woodburn Ave Cincinnati, OH | 3.0 | 1.0–3.0 | 912 | $3,320 | $3.64 | 1d | 39 | 1.46mi |
| 2846 Observatory Ave Cincinnati, OH | 4.0 | 1.0 | 1357 | $3,000 | $2.21 | 23d | 1 | 1.48mi |
| 3439 Duncan Ave Cincinnati, OH | 4.0 | 1.5 | 1809 | $3,500 | $1.93 | 23d | 1 | 1.49mi |
Listing history 38 events
-
2026-06-18days on market $170,000 Active 120 DOM
-
2026-06-17days on market $170,000 Active 119 DOM
-
2026-06-16days on market $170,000 Active 118 DOM
-
2026-06-15days on market $170,000 Active 117 DOM
-
2026-06-13days on market $170,000 Active 115 DOM
-
2026-06-13days on market $170,000 Active 114 DOM
-
2026-06-09days on market $170,000 Active 111 DOM
-
2026-06-08days on market $170,000 Active 110 DOM
-
2026-06-07days on market $170,000 Active 109 DOM
-
2026-06-03days on market $170,000 Active 105 DOM
-
2026-06-02days on market $170,000 Active 104 DOM
-
2026-06-01days on market $170,000 Active 103 DOM
-
2026-05-31days on market $170,000 Active 102 DOM
-
2026-04-24status Active
-
2026-04-22historical
-
2026-02-16$170,000 Active
-
2025-12-31historical 573-char remark
Show marketing remark (573 chars)
Welcome to 3533 Evanston AveA Prime Opportunity in a Rapidly Rising Neighborhood This spacious 4-bedroom, 1-bath home is ready for a full renovation and packed with potential. Located in the heart of Evanston, where revitalization is happening block by block, this property is a golden opportunity for investors and visionaries alike. With homes being transformed throughout the area and values steadily climbing, 3533 Evanston Ave offers the chance to create something truly special. Whether you're looking to flip, rent, or restore, this is one you don't want to miss.
-
2025-11-12$180,000 Active 573-char remark
Show marketing remark (573 chars)
Welcome to 3533 Evanston AveA Prime Opportunity in a Rapidly Rising Neighborhood This spacious 4-bedroom, 1-bath home is ready for a full renovation and packed with potential. Located in the heart of Evanston, where revitalization is happening block by block, this property is a golden opportunity for investors and visionaries alike. With homes being transformed throughout the area and values steadily climbing, 3533 Evanston Ave offers the chance to create something truly special. Whether you're looking to flip, rent, or restore, this is one you don't want to miss.
-
2025-09-29historical 573-char remark
Show marketing remark (573 chars)
Welcome to 3533 Evanston AveA Prime Opportunity in a Rapidly Rising Neighborhood This spacious 4-bedroom, 1-bath home is ready for a full renovation and packed with potential. Located in the heart of Evanston, where revitalization is happening block by block, this property is a golden opportunity for investors and visionaries alike. With homes being transformed throughout the area and values steadily climbing, 3533 Evanston Ave offers the chance to create something truly special. Whether you're looking to flip, rent, or restore, this is one you don't want to miss.
-
2025-09-04status Active 573-char remark
Show marketing remark (573 chars)
Welcome to 3533 Evanston AveA Prime Opportunity in a Rapidly Rising Neighborhood This spacious 4-bedroom, 1-bath home is ready for a full renovation and packed with potential. Located in the heart of Evanston, where revitalization is happening block by block, this property is a golden opportunity for investors and visionaries alike. With homes being transformed throughout the area and values steadily climbing, 3533 Evanston Ave offers the chance to create something truly special. Whether you're looking to flip, rent, or restore, this is one you don't want to miss.
-
2025-08-29historical Contingency Pending 573-char remark
Show marketing remark (573 chars)
Welcome to 3533 Evanston AveA Prime Opportunity in a Rapidly Rising Neighborhood This spacious 4-bedroom, 1-bath home is ready for a full renovation and packed with potential. Located in the heart of Evanston, where revitalization is happening block by block, this property is a golden opportunity for investors and visionaries alike. With homes being transformed throughout the area and values steadily climbing, 3533 Evanston Ave offers the chance to create something truly special. Whether you're looking to flip, rent, or restore, this is one you don't want to miss.
-
2025-08-09$185,000 Active 573-char remark
Show marketing remark (573 chars)
Welcome to 3533 Evanston AveA Prime Opportunity in a Rapidly Rising Neighborhood This spacious 4-bedroom, 1-bath home is ready for a full renovation and packed with potential. Located in the heart of Evanston, where revitalization is happening block by block, this property is a golden opportunity for investors and visionaries alike. With homes being transformed throughout the area and values steadily climbing, 3533 Evanston Ave offers the chance to create something truly special. Whether you're looking to flip, rent, or restore, this is one you don't want to miss.
-
2019-01-30soldstatus $52,000
-
2019-01-23historical Accept Backup Offers
-
2019-01-23soldstatus $52,000 Sold
-
2018-12-07$65,900 Active
-
2014-12-16historical
-
2014-06-18$68,500
-
2010-03-23historical
-
2009-11-12$89,900
-
2009-01-09soldstatus $11,000
-
2007-09-26soldstatus $7,000
-
2007-09-03$14,900
-
2007-08-26historical
-
2007-05-25$29,900
-
2000-09-25soldstatus $69,900
-
2000-08-31soldstatus $69,900
-
2000-06-17$69,900
ⓘ Source: listings_history table (triggers on properties + properties_extension) + one-shot
backfill from property_details.listing_events for pre-trigger history.
Tax reassessment forecast OH · Partial reset (capped growth)
- Current annual tax
- $2,471 · $206/mo
- Projected year-2 tax
- $2,561 · $213/mo
- Expected delta
- +$91/yr (+$8/mo · 3.7%)
ⓘ Screening estimate from a state-policy table — verify with the county assessor before closing.
Climate risk First Street
- Flood 1/10 Low FEMA zone X (unshaded) · 0% chance over 30 yrs
- Wildfire 1/10 Low
- Heat 4/10 Moderate 7 d/yr ≥103°F today · 19 d/yr by 30 yrs out
- Wind 2/10 Low 100% chance of damaging wind over 30 yrs
- Air quality 3/10 Moderate 2 unhealthy d/yr today · 3 by 30 yrs out
Nearby sold comps map
Loading sold comps map…
Walkable amenities ~0.75 mi
Loading nearby amenities…
Taxation est. · year 1
- Rental income
- $26,886
- − Mortgage interest
- −$9,523
- − Property taxes
- −$2,471
- − Insurance
- −$850
- − Repairs & maintenance
- −$2,151
- − Management
- −$2,151
- − Depreciation
- −$4,945
- Taxable income
- $4,796
- Est. tax owed @ 24.0%
- −$1,151
- After-tax cash flow
- $6,071/yr
For passive investors: Depreciation is non-cash, so a rental often shows a tax loss while cash-flowing — sheltering income. Rental losses are passive: they offset passive income freely, and up to $25,000/yr can offset ordinary (W-2) income if you actively participate and your MAGI is under $100k (phasing out to $0 by $150k); unused losses carry forward. On sale, claimed depreciation is recaptured at up to 25%, and gains may owe capital-gains tax (a 1031 exchange can defer both). Figures are a year-1 estimate at your 24.0% rate — not tax advice; consult a CPA.
Schools (NCES district)
- District
- Cincinnati Public Schools
- NCES district ID
- 3904375
- Math proficiency
- 25% ▼ -19.00%
- Reading proficiency
- 36% ▼ -14.00%
- Median HH income
- $35,743
- Composite
- 25.21/100
- National rank
- #7508
- State rank
- #581 of 656 in OH
Livability — Cincinnati
- Score
- 80/100
- State rank
- #130
- US rank
- #1856
Category grades
Schools grade is shown separately in the Schools card above.
Census & demographics
- Census place
- Cincinnati, OH
- County
- Hamilton County · 701,295 people
- City population
- 505,555
- Metro
- Cincinnati, OH-KY-IN
- Population (ZIP)
- 6,983
- Household income
- $49,801
- Rent vs Own
- Severe rent burden
- 422.0
Population outlook (Hamilton County) Hauer SSP2
- Today (2025)
- 826,054 people
- By 2030
- 830,947 · +0.6%
- By 2040
- 832,319 · +0.8%
- By 2050
- 822,428 · -0.4%
- By 2075
- 788,688 · -4.5%
- By 2100
- 710,674 · -14.0%
Race, ethnicity, and origin ACS 2023
- Neighborhood character
- Diverse neighborhood (Simpson 0.58)
- Race & ethnicity
- Black 51% White 39% Hispanic / Latino 6% Two or more races 4% Asian 2%
- Hispanic origin (detail)
- Mexican 3%
- Common ancestry
- Portuguese 1% Serbian 1% Romanian 1%
- Foreign-born
- 8% · Canada, China, South Korea
- Languages at home
- 88% English-only · Spanish 5% French/Haitian/Cajun 4% Chinese 1%
Political lean MEDSL · Hamilton
- 2024 margin
- D (+14.9) · D 57.0% · R 42.1%
- 2008→2024 swing
- +7.9pp toward D · 2008: 7.0pp · 2024: 14.9pp
- All cycles
- 2024: D+14.9 2020: D+15.9 2016: D+9.5 2012: D+4.9 2008: D+7.0
Not yet ingested
- Civics
- —
Market trends
- HPI YoY
- ▼ -144.98%
- Current HPI
- 273.9444
- Rent YoY
- —
- Metro
- Cincinnati, OH-KY-IN
- State GDP YoY
- ▲ 1.98%
- F500 in state
- 48
Industry mix (Fortune 500 HQ in OH)
| Industry | F500 HQs | Revenue |
|---|---|---|
| Insurance | 3 | $145B |
|
||
| Industrial Machinery | 3 | $49B |
|
||
| Financial Services | 3 | $24B |
|
||
| Consumer Goods | 2 | $93B |
|
||
| Aerospace / Defense | 2 | $47B |
|
||
| Utilities | 2 | $33B |
|
||
Price history
+143.2% since first listed25 events — show timeline
- 2026-04-24 Relisted — Cincy MLS
- 2026-04-22 Listing Removed — Cincy MLS
- 2026-02-16 Listed $170,000 Cincy MLS
- 2025-12-31 Listing Removed — Cincy MLS
- 2025-11-12 Listed $180,000 Cincy MLS
- 2025-09-29 Listing Removed — Cincy MLS
- 2025-09-04 Relisted — Cincy MLS
- 2025-08-29 Contingent — Cincy MLS
- 2025-08-09 Listed $185,000 Cincy MLS
- 2019-01-30 Sold (Public Records) $52,000 Public Records
- 2019-01-23 Contingent — Cincy MLS
- 2019-01-23 Sold (MLS) $52,000 Cincy MLS
- 2018-12-07 Listed $65,900 Cincy MLS
- 2014-12-16 Listing Removed — Cincy MLS
- 2014-06-18 Listed $68,500 Cincy MLS
- 2010-03-23 Listing Removed — Cincy MLS
- 2009-11-12 Listed $89,900 Cincy MLS
- 2009-01-09 Sold (Public Records) $11,000 Public Records
- 2007-09-26 Sold (MLS) $7,000 Cincy MLS
- 2007-09-03 Listed $14,900 Cincy MLS
- 2007-08-26 Listing Removed — Cincy MLS
- 2007-05-25 Listed $29,900 Cincy MLS
- 2000-09-25 Sold (Public Records) $69,900 Public Records
- 2000-08-31 Sold (MLS) $69,900 Cincy MLS
- 2000-06-17 Listed $69,900 Cincy MLS
Property tax history
+6.5%/yrLatest (2025): $2,471 · +0.1% YoY. Source: county tax records.
Cash-flow waterfall
monthlySold comps — $/sqft
last 12 mo · ≤1 miLoading sold comps…