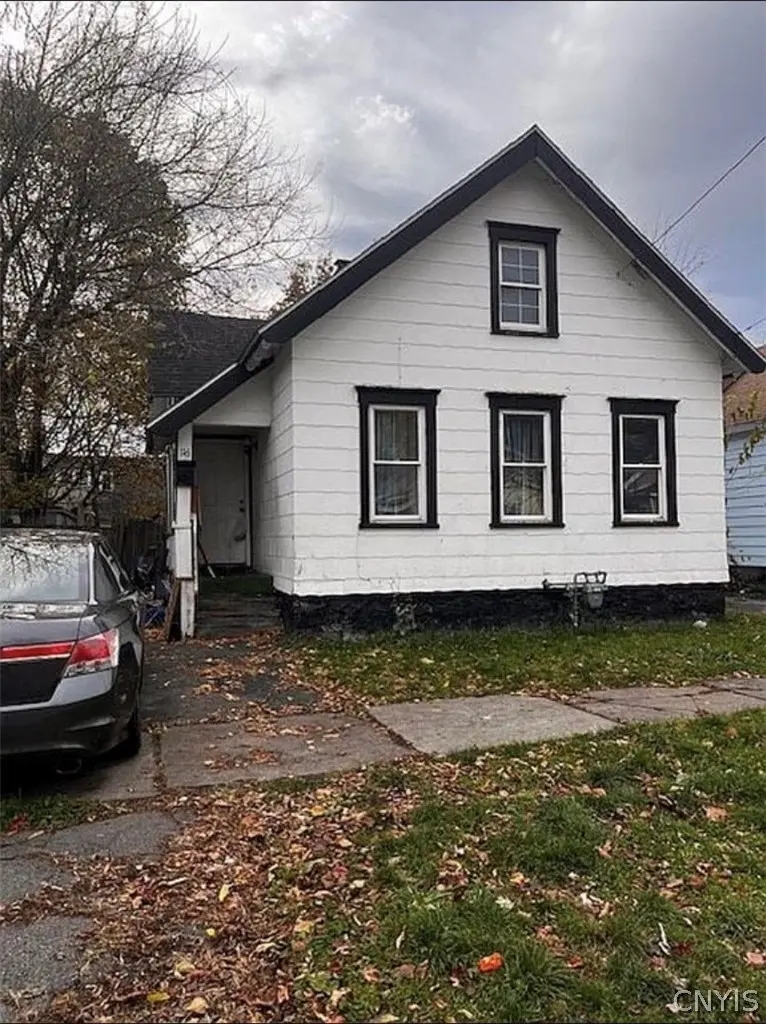
116 Knaul St · Syracuse, NY
Flood risk 7/10 · Major
- FEMA flood zone
- X (unshaded)
- Chance of flooding over 30 yrs
- 0.96%
- Est. flood insurance / yr
- $473 – $860
Fire risk 1/10 · Minimal
- Est. fire insurance / yr
- $691 – $1,283
Heat risk 3/10 · Minor
- Hot days now (above 95°F)
- 7 days/yr
- Hot days in 30 yrs
- 16 days/yr
Wind risk 1/10 · Minimal
- Chance of severe wind over 30 yrs
- 0.0%
Air-quality risk 2/10 · Minimal
- Unhealthy air days now
- 0 days/yr
- Unhealthy air days in 30 yrs
- 1 days/yr
Risk factors via First Street. Map © Google.
Why this score? — see what drove the B grade
The composite is a weighted blend of 9 inputs, each scored 0–100. Each bar is that input's sub-score; the figure is the points it added to the 100-point composite (weight × sub-score).
- Cash flow +30.0/30.0
- 1% rule +10.0/10.0
- DSCR +10.0/10.0
- ARV discount +7.5/15.0
- Rent growth +4.6/5.0
- Livability +3.9/5.0
- Condition / age +2.5/5.0
- Schools +1.8/10.0
- Appreciation +0.0/10.0
$80,000
🖨 Deal sheet 📄 Offer letter ✓ Due diligence
Listing remarks MLS
Great opportunity to own a home with tons of potential in a highly convenient location! This property offers a solid layout and is ready for your personal touch and updates. Perfect for investors or buyers looking to build equity, the home needs some work but has strong upside value. Ideally situated near schools, hospitals, and public transportation, making daily living easy and accessible. Whether you’re looking for your next renovation project or a long-term investment, this property is full of possibilities.
Key facts
- 2,805 sq ft lot
- Built 1909
- Listed 6 days
Property features AI
Exterior
- Parking: No garage
- Utilities: Public water connected; Sewer connected
- Home design: Single-story property (1 story); Resale condition
- Construction: Vinyl siding; Block foundation; Existing construction
- Exterior features: Blacktop driveway; Near public transit; Rectangular residential lot; City street frontage; Lot dimensions approximately 39 x 71
Interior
- Bedrooms: Two main-level bedrooms; One second-level bedroom; One lower-level bedroom
- Flooring: Carpet; Vinyl; Varied flooring
- Bathrooms: Two full bathrooms; One main-level bathroom
- Heating & cooling: Gas forced-air heating
- Interior features: Attic; Separate/formal dining room; Bedroom on main level; Crawl space basement
- Laundry & utility: Laundry in basement; Gas water heater
Neighborhood map
What this means for you Summary
Snapshot
- This is a 2-bed/1.0-bath single-family listed at $80k.
Deal economics
- At list price, monthly cash flow is $753 ($9k/yr) — positive.
- The deal already cash-flows at list — no discount required.
- Meets the 1% rule at list price ($2k rent vs $80k).
- Cap rate 18.4% vs local median 8.2% in Syracuse — top-decile yield for the area; either an underpriced asset or a hidden risk that comps aren't pricing in. Stress-test before assuming the spread holds.
Location & tenants
- Location reads 77/100 on livability (#187 in NY, #2,869 nationally) — a middle-class / working-renter tenant base. Strengths: amenities A+, commute A+, cost of living A+; Watch: schools D+, crime F, employment D-.
- Syracuse City School District (urban): math 18% / reading 26% proficiency, ranked #590 of 590 in NY (top 100%) — low school quality limits family demand, transient renter base, plan for 1-2y turnover; 74% free/reduced lunch — lower-income household profile, screen leases tightly.
- Market conditions: Rents rising fast (+8.4%/yr); 55 active listings in the ZIP; 40 comparable units currently listed for rent nearby; rentals lingering (median 44d on market — plan ~5-8 weeks vacancy on turnover, expect pricing pressure); 52% of comp listings sitting > 30 days — soft ceiling on asking rent; 616 units permitted in Onondaga County in 2024 (256 in 5+ unit buildings).
- This rent runs 43% of the median local income ($47k/yr) — at the standard rent-burdened threshold; future hikes will face affordability resistance.
Forward outlook
- Local home prices are declining (-3.0%/yr); year-one equity from $553 of loan paydown is wiped out by about $2k of value loss. Plan a longer hold.
- Onondaga County population projected to shrink 9% by 2050 — rents likely to lag national; underwrite the cash flow, not the appreciation.
- At projected returns (-3.0% appreciation + 8.0% rent growth), your $22k cash investment doubles in ~3 years — after that, you're playing with house money.
Negotiation context
- Only 6 days on market — expect competitive offers; lowballing is unlikely to land.
- 2 sale attempts with the ask held roughly flat each time — persistent listings suggest the price (not the market) is what's stuck; bring a comps-based counter.
- Current owner paid $54k; 48% above their basis — modest negotiation headroom, anchor on the comps not their cost.
Risks & watch-outs
- Watch-outs: flood insurance adds $56/mo; built in 1909 — expect roof / HVAC / electrical / plumbing capex.
- Climate carrying-cost: major flood risk — expect insurance premiums to compound above CPI over the hold.
Questions for the listing agent
- Built in 1909 — when were the roof, HVAC, electrical panel, plumbing, and water heater last replaced?
- What's the actual annual flood-insurance premium (NFIP or private), and is the property in a SFHA with mandatory coverage?
- Is there a deadline driving the sale (1031 exchange, divorce, estate, relocation)? That informs how much negotiation room exists.
- Schools are D-rated, which usually means shorter tenancies and higher turnover. Who's the typical renter profile here, and what's been the actual vacancy rate?
- Crime grade is F in this area — have there been break-ins, vandalism, or insurance claims at this property in the last 3 years? What carrier currently insures it and at what premium?
- What's the average days-on-market for RENTAL listings here right now (not sales)? A rising rental-DOM trend means longer vacancies and softer asking-rent achievability than the comps imply.
- What's the recent tenant-quality profile in this submarket — average credit score on applications, eviction rate, late-payment / NSF rate, and stable-employment percentage? A property-management company in the area should have these aggregated.
- How much new for-sale + rental construction is in the pipeline within 1–3 miles? Heavy new supply typically softens prices + rents 12–24 months out; constrained supply supports both.
Investment metrics
- 1% rule
- 2.10% ✓
- Cap rate
- 18.42%
- Cash-on-cash
- 43.31%
- DSCR
- 2.93
- GRM
- 4.0
CMA / ARV
- ARV (on-the-fly)
- $170,314
- Comps found
- 12
Show comp detail 12 sales within ~0.75 mi
| Address | Dist | Beds/Ba | Sqft | Sold | Price | $/sf | Match |
|---|---|---|---|---|---|---|---|
| 310 Helen St | 0.36mi | 2/1.5 | 1,274 (+0%) | 4mo | $191,000 | $150 | 77 |
| 231 Grumbach Ave | 0.12mi | 3/1.0 (+1) | 1,152 (-9%) | 0mo | $75,000 | $65 | 73 |
| 611 Highland St | 0.30mi | 3/1.0 (+1) | 1,302 (+2%) | 7mo | $95,000 | $73 | 71 |
| 108 High St | 0.40mi | 3/1.0 (+1) | 1,276 (+0%) | 8mo | $175,000 | $137 | 69 |
| 200 Helen St | 0.39mi | 2/1.5 | 1,329 (+5%) | 5mo | $175,100 | $132 | 68 |
| 321 Dewitt St | 0.43mi | 3/1.5 (+1) | 1,310 (+3%) | 6mo | $175,000 | $134 | 63 |
| 714 Helen St | 0.51mi | 3/1.0 (+1) | 1,248 (-2%) | 6mo | $173,000 | $139 | 63 |
| 928 Kirkpatrick St N | 0.62mi | 3/1.0 (+1) | 1,236 (-3%) | 0mo | $145,000 | $117 | 61 |
| 2363 Grant Blvd | 0.60mi | 2/1.0 | 1,215 (-4%) | 5mo | $153,700 | $127 | 61 |
| 158 Darlington Rd | 0.63mi | 3/1.0 (+1) | 1,329 (+5%) | 2mo | $186,000 | $140 | 56 |
| 117 Lawrence St | 0.48mi | 3/1.0 (+1) | 1,416 (+11%) | 6mo | $90,000 | $64 | 49 |
| 222 Darlington Rd | 0.70mi | 3/1.0 (+1) | 1,080 (-15%) | 5mo | $168,500 | $156 | 33 |
Match score weights: distance 35% · size 25% · config 20% · recency 20%. Top-matched comps best support the ARV.
Projected returns pro-forma
-3.0% appreciation · 8.0% rent growth · sell at horizon
- IRR
- 42.4%
- Equity multiple
- 2.96×
- Total profit
- $43,904
- Equity at exit
- $11,928
- IRR
- 50.9%
- Equity multiple
- 7.27×
- Total profit
- $140,516
- Equity at exit
- $6,917
Cash invested: $22,400 (down + closing). Projections, not guarantees.
Landlord ↔ Tenant lean methodology
- Overall (STATE)
- 15 Strongly Tenant-Friendly
- State New York
- 15 Strongly Tenant-Friendly · D+10
- County
- — inherits STATE
- City
- — inherits STATE
ZIP-level market 13203
- Home prices YoY
- -11.9%
- Rents YoY
- 8.4%
- Active inventory
- 55
- Price-to-rent
- 4.0×
Monthly cashflow live
- Estimated rent
- $1,679 high interval (Pro) →
- Mortgage (P&I)
- −$420
- Tax from tax record
- −$65 /mo · $778/yr
- Insurance
- −$33
- Flood insurance flood zone
- −$56 /mo · $666/yr
- HOA
- −$0
- Vacancy / Maint / Mgmt
- −$353
- Net cashflow
- $753
Break-even live
UW: 25.0% down · 7.5% · 30yr · 1.5% tax · 5.0% vac · 8.0% maint · 8.0% mgmt
Financing live
Cash to close
- Down payment
- $20,000
- Closing costs
- $2,400
- Reserves months
- —
- Total cash needed
- —
Loan-product check · same deal, 3 products live
Conventional
25% down · 7.5% · 30yr
- Down + closing
- —
- Monthly P&I
- —
- Monthly cashflow
- —
- DSCR
- —
- Eligible?
- —
Personal DTI + credit; lowest rate.
DSCR
20% down · 8.5% · 30yr
- Down + closing
- —
- Monthly P&I
- —
- Monthly cashflow
- —
- DSCR
- —
- Eligible?
- —
No personal income docs; deal must DSCR.
Hard money
10% down · 12.0% · 12mo
- Down + closing
- —
- Monthly P&I
- —
- Monthly cashflow
- —
- DSCR
- —
- Eligible?
- —
Short-term bridge; refi at stabilization.
Rent comps 40 comps
| Address | Beds | Baths | Sqft | Rent | $/sqft | DOM | Units | Dist |
|---|---|---|---|---|---|---|---|---|
| 912 Park St Unit 1 Syracuse, NY | 3.0 | 1.0 | 1040 | $1,200 | $1.15 | 43d | 1 | 0.31mi |
| 126 Woodruff Ave Syracuse, NY | 3.0 | 1.0 | 1200 | $1,675 | $1.40 | 43d | 1 | 0.32mi |
| 610 E Division St Unit F2 Syracuse, NY | 2.0 | 1.0 | 900 | $1,150 | $1.28 | 43d | 1 | 0.47mi |
| 807-13 N Salina St Unit 809A Syracuse, NY | 2.0 | 1.0 | 1020 | $1,325 | $1.30 | 43d | 1 | 0.70mi |
| 286 Ross Park Syracuse, NY | 3.0 | 1.0 | 1100 | $1,500 | $1.36 | 44d | 1 | 0.82mi |
| 205A Hawley Ave Unit 211C Syracuse, NY | 3.0 | 2.5 | 1350 | $1,675 | $1.24 | 43d | 1 | 0.86mi |
| 205A Hawley Ave Unit 213C Syracuse, NY | 3.0 | 2.5 | 1350 | $1,650 | $1.22 | 43d | 1 | 0.86mi |
| 1618 James St #3 Syracuse, NY | 2.0 | 1.0 | 1150 | $2,200 | $1.91 | 13d | 1 | 0.88mi |
| 416 Pearl St Unit 2 Syracuse, NY | 3.0 | 1.0 | 900 | $2,400 | $2.67 | 13d | 1 | 0.91mi |
| 689 N Clinton St Unit 323 Syracuse, NY | 1.0 | 1.5 | 960 | $1,575 | $1.64 | 21d | 1 | 0.91mi |
| 689 N Clinton St Apt 307 Syracuse, NY | 1.0 | 1.5 | 1100 | $1,600 | $1.45 | 43d | 1 | 0.91mi |
| 210 W Division St Unit 24 Syracuse, NY | 2.0 | 2.0 | 1200 | $1,850 | $1.54 | 21d | 1 | 0.91mi |
| 721 N Clinton St Unit 105 Syracuse, NY | 2.0 | 2.0 | 1000 | $1,475 | $1.48 | 43d | 1 | 0.91mi |
| 721 N Clinton St Unit 213 Syracuse, NY | 2.0 | 2.0 | 1000 | $1,550 | $1.55 | 43d | 1 | 0.91mi |
| 210 W Division St Unit 87 Syracuse, NY | 2.0 | 2.0 | 1200 | $1,750 | $1.46 | 43d | 1 | 0.92mi |
| 525 Burnet Ave Unit First Floor Syracuse, NY | 3.0 | 1.0 | 900 | $1,650 | $1.83 | 43d | 1 | 0.96mi |
| 1801 James St #2 Syracuse, NY | 3.0 | 1.0 | 1244 | $1,800 | $1.45 | 13d | 1 | 1.02mi |
| 1507 N Salina St Unit 3 Syracuse, NY | 3.0 | 2.0 | 1030 | $1,350 | $1.31 | 43d | 1 | 1.06mi |
| 412 Delmar Pl Syracuse, NY | 1.0 | 1.0 | 1827 | $1,000 | $0.55 | 21d | 1 | 1.07mi |
| 230 W Willow St Apt 310 Syracuse, NY | 1.0 | 1.0 | 933 | $1,600 | $1.71 | 13d | 1 | 1.10mi |
| 373 Spencer St Unit 303 Syracuse, NY | 2.0 | 1.5 | 1085 | $1,850 | $1.71 | 43d | 1 | 1.17mi |
| 204 Mariposa St Unit pvt house Syracuse, NY | 3.0 | 1.0 | 1128 | $2,137 | $1.89 | 13d | 1 | 1.19mi |
| 208 W Water St Syracuse, NY | 2.0 | 2.0 | 962 | $1,800 | $1.87 | 43d | 1 | 1.23mi |
| 900 E Fayette St Syracuse, NY | 1.0–2.0 | 1.0 | 817 | $1,995 | $2.44 | 13d | 9 | 1.24mi |
| 1132 Wolf St Unit 4 Syracuse, NY | 3.0 | 1.0 | 1041 | $1,350 | $1.30 | 43d | 1 | 1.28mi |
| 300 University Ave Syracuse, NY | 2.0 | 1.0 | 1020 | $2,150 | $2.11 | 13d | 1 | 1.28mi |
| 324 W Water St Unit 106 Syracuse, NY | 2.0 | 1.0 | 1436 | $2,095 | $1.46 | 21d | 1 | 1.31mi |
| 324 W Water St Syracuse, NY | 2.0 | 1.0 | 1007 | $1,975 | $1.96 | 13d | 6 | 1.31mi |
| 319 S Salina St Syracuse, NY | 2.0 | 2.0 | 1860 | $2,000 | $1.08 | 21d | 1 | 1.33mi |
| 129 W Fayette St Unit 217 Syracuse, NY | 2.0 | 2.0 | 1100 | $1,550 | $1.41 | 13d | 1 | 1.33mi |
| 321 S Salina St Unit 403 Syracuse, NY | 1.0 | 1.0 | 978 | $1,750 | $1.79 | 21d | 1 | 1.33mi |
| 321 S Salina St Unit 501 Syracuse, NY | 2.0 | 1.0 | 1446 | $3,000 | $2.07 | 43d | 1 | 1.34mi |
| 321 S Salina St Unit 502 Syracuse, NY | 1.0 | 1.0 | 1050 | $2,500 | $2.38 | 43d | 1 | 1.34mi |
| 321 S Salina St Unit 303 Syracuse, NY | 1.0 | 1.0 | 978 | $1,800 | $1.84 | 43d | 1 | 1.34mi |
| 321 S Salina St Unit 402 Syracuse, NY | 1.0 | 1.0 | 1050 | $2,200 | $2.10 | 13d | 1 | 1.34mi |
| 321 S Salina St Unit 203 Syracuse, NY | 1.0 | 1.0 | 1236 | $2,000 | $1.62 | 21d | 1 | 1.34mi |
| 321 S Salina St Unit 201 Syracuse, NY | 2.0 | 1.0 | 1446 | $2,450 | $1.69 | 43d | 1 | 1.34mi |
| 317 S Clinton St Unit 4A Syracuse, NY | 2.0 | 1.5 | 1500 | $2,100 | $1.40 | 13d | 1 | 1.35mi |
| 317 S Clinton St Unit 3A Syracuse, NY | 2.0 | 2.0 | 1500 | $2,100 | $1.40 | 43d | 1 | 1.36mi |
| 201 E Jefferson St Syracuse, NY | 2.0 | 1.0 | 662 | $1,626 | $2.45 | 13d | 9 | 1.37mi |
Listing history 6 events
-
2026-04-29status Pending
-
2026-04-22$80,000 Active
-
2026-04-16$80,000 Active 523-char remark
Show marketing remark (523 chars)
Great opportunity to own a home with tons of potential in a highly convenient location! This property offers a solid layout and is ready for your personal touch and updates. Perfect for investors or buyers looking to build equity, the home needs some work but has strong upside value. Ideally situated near schools, hospitals, and public transportation, making daily living easy and accessible. Whether you’re looking for your next renovation project or a long-term investment, this property is full of possibilities.
-
2021-03-30soldstatus $54,000
-
2007-04-20soldstatus $45,800
-
2006-02-08soldstatus $13,000
ⓘ Source: listings_history table (triggers on properties + properties_extension) + one-shot
backfill from property_details.listing_events for pre-trigger history.
Tax reassessment forecast NY · Partial reset (capped growth)
- Current annual tax
- $778 · $65/mo
- Projected year-2 tax
- $1,065 · $89/mo
- Expected delta
- +$287/yr (+$24/mo · 36.9%)
ⓘ Screening estimate from a state-policy table — verify with the county assessor before closing.
Climate risk First Street
- Flood 7/10 Severe FEMA zone X (unshaded) · 96% chance over 30 yrs
- Wildfire 1/10 Low
- Heat 3/10 Moderate 7 d/yr ≥95°F today · 16 d/yr by 30 yrs out
- Wind 1/10 Low 0% chance of damaging wind over 30 yrs
- Air quality 2/10 Low 0 unhealthy d/yr today · 1 by 30 yrs out
Nearby sold comps map
Loading sold comps map…
Walkable amenities ~0.75 mi
Loading nearby amenities…
Taxation est. · year 1
- Rental income
- $20,145
- − Mortgage interest
- −$4,481
- − Property taxes
- −$778
- − Insurance
- −$1,066
- − Repairs & maintenance
- −$1,612
- − Management
- −$1,612
- − Depreciation
- −$2,327
- Taxable income
- $8,269
- Est. tax owed @ 24.0%
- −$1,985
- After-tax cash flow
- $7,051/yr
For passive investors: Depreciation is non-cash, so a rental often shows a tax loss while cash-flowing — sheltering income. Rental losses are passive: they offset passive income freely, and up to $25,000/yr can offset ordinary (W-2) income if you actively participate and your MAGI is under $100k (phasing out to $0 by $150k); unused losses carry forward. On sale, claimed depreciation is recaptured at up to 25%, and gains may owe capital-gains tax (a 1031 exchange can defer both). Figures are a year-1 estimate at your 24.0% rate — not tax advice; consult a CPA.
Schools (NCES district)
- District
- Syracuse City School District
- NCES district ID
- 3628590
- Math proficiency
- 18% ▼ -5.00%
- Reading proficiency
- 26% ▬ 0.00%
- Median HH income
- $32,097
- Composite
- 17.83/100
- National rank
- #9007
- State rank
- #590 of 590 in NY
Livability — Syracuse
- Score
- 77/100
- State rank
- #187
- US rank
- #2869
Category grades
Schools grade is shown separately in the Schools card above.
Census & demographics
- Census place
- Syracuse, NY
- County
- Onondaga County · 247,257 people
- City population
- 152,627
- Metro
- Syracuse, NY
- Population (ZIP)
- 16,180
- Household income
- $46,997
- Rent vs Own
- Severe rent burden
- 1566.0
Population outlook (Onondaga County) Hauer SSP2
- Today (2025)
- 467,894 people
- By 2030
- 463,381 · -1.0%
- By 2040
- 447,697 · -4.3%
- By 2050
- 426,399 · -8.9%
- By 2075
- 373,661 · -20.1%
- By 2100
- 307,967 · -34.2%
Race, ethnicity, and origin ACS 2023
- Neighborhood character
- Diverse neighborhood (Simpson 0.67)
- Race & ethnicity
- White 52% Black 22% Hispanic / Latino 11% Two or more races 9% Asian 7%
- Hispanic origin (detail)
- Puerto Rican 6% Cuban 2%
- Common ancestry
- Romanian 3% Lithuanian 2% Iranian 2%
- Foreign-born
- 13% · Canada, India, Philippines
- Languages at home
- 81% English-only · Spanish 6% Other Indo-European 3% Other Asian/Pacific 3%
Political lean MEDSL · Onondaga
- 2024 margin
- D (+17.3) · D 58.6% · R 41.4%
- 2008→2024 swing
- -3.0pp toward R · 2008: 20.3pp · 2024: 17.3pp
- All cycles
- 2024: D+17.3 2020: D+20.6 2016: D+12.8 2012: D+21.1 2008: D+20.3
Not yet ingested
- Civics
- —
Market trends
- HPI YoY
- ▼ -35.69%
- Current HPI
- 263.2588
- Rent YoY
- ▲ 8.39%
- Metro
- Syracuse, NY
- State GDP YoY
- ▲ 2.60%
- F500 in state
- 92
Industry mix (Fortune 500 HQ in NY)
| Industry | F500 HQs | Revenue |
|---|---|---|
| Financial Services | 10 | $950B |
|
||
| Consumer Goods | 9 | $162B |
|
||
| Insurance | 4 | $225B |
|
||
| Telecommunications | 2 | $144B |
|
||
| Pharmaceuticals | 2 | $112B |
|
||
| Media / Entertainment | 2 | $69B |
|
||
Price history
+515.4% since first listed6 events — show timeline
- 2026-04-29 Pending — CNYIS
- 2026-04-22 Listed $80,000 CNYIS
- 2026-04-16 Listed $80,000 Fizber.com
- 2021-03-30 Sold (Public Records) $54,000 Public Records
- 2007-04-20 Sold (Public Records) $45,800 Public Records
- 2006-02-08 Sold (Public Records) $13,000 Public Records
Property tax history
-0.1%/yrLatest (2025): $778 · +0.0% YoY. Source: county tax records.
Cash-flow waterfall
monthlySold comps — $/sqft
last 12 mo · ≤1 miLoading sold comps…