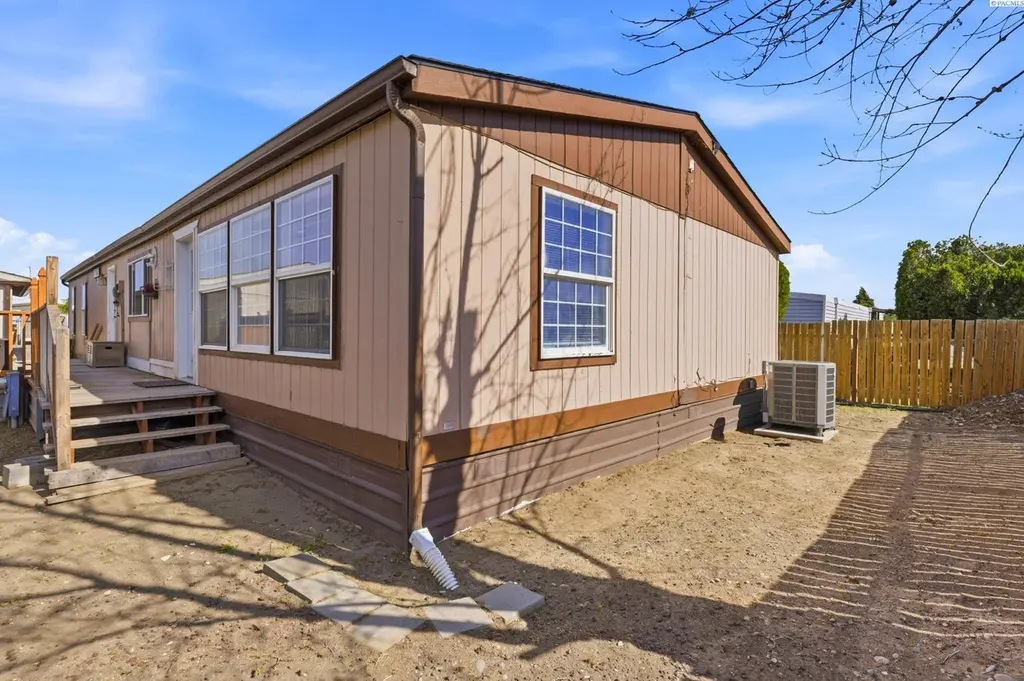
2105 N Steptoe Street #25 St #25 · Kennewick, WA
Flood risk 1/10 · Minimal
- FEMA flood zone
- X
- Chance of flooding over 30 yrs
- 0.0%
- Est. flood insurance / yr
- $473 – $860
Fire risk 1/10 · Minimal
- Est. fire insurance / yr
- $604 – $1,122
Heat risk 5/10 · Moderate
- Hot days now (above 98°F)
- 7 days/yr
- Hot days in 30 yrs
- 15 days/yr
Wind risk 1/10 · Minimal
- Chance of severe wind over 30 yrs
- —
Air-quality risk 8/10 · Major
- Unhealthy air days now
- 14 days/yr
- Unhealthy air days in 30 yrs
- 15 days/yr
Risk factors via First Street. Map © Google.
Why this score? — see what drove the B grade
The composite is a weighted blend of 9 inputs, each scored 0–100. Each bar is that input's sub-score; the figure is the points it added to the 100-point composite (weight × sub-score).
- Cash flow +30.0/30.0
- 1% rule +10.0/10.0
- DSCR +10.0/10.0
- ARV discount +7.5/15.0
- Schools +5.3/10.0
- Livability +3.9/5.0
- Rent growth +3.3/5.0
- Condition / age +2.5/5.0
- Appreciation +0.0/10.0
$124,900
🖨 Deal sheet (PDF) 📄 Offer letter ✓ Due diligence
Listing remarks MLS
Large spacious home that is move in ready. Almost all the flooring has been updated to tile and wood. Master bathroom has some updating and the main bathroom has been updated with walk in tile shower, built in shelves and new countertop. Kitchen has been updated with a kitchen island, counter tops and stainless steel appliances. Formal dining room has built in book shelves. Family room is oversized and is perfect for entertaining. 3rd bedroom has a built in cabinets and desk. Home also features two wood decks and a large shed along with a hot tub.
Key facts
- Huge wood deck
- Garage
- Community pool
Tags
Property features AI
Finance
- HOA & community: Curbs and sidewalks in the community
Exterior
- Parking: Detached garage; 1 covered parking space (1 total parking space)
- Utilities: Public water; Electric service on property; Cable connected; Electricity connected; Sewer connected
- Home design: Manufactured home (double wide); Single-story (one level); New construction; Located in a mobile home park
- Construction: Concrete construction; Composition roof
- Exterior features: Deck; Partial fencing; Community pool
Interior
- Kitchen: Dishwasher; Range / Oven; Refrigerator
- Flooring: Carpet; Laminate; Tile
- Bathrooms: 1 full bathroom; 1 three-quarter bathroom
- Heating & cooling: Heat pump for heating; Heat pump for cooling
- Interior features: Breakfast bar; Vaulted ceilings; Ceiling fans; Granite counters; Window coverings
- Laundry & utility: Laundry room; Washer; Dryer; Water heater
Neighborhood map
What this means for you Summary
Snapshot
- This is a 4-bed/2.0-bath manufactured listed at $125k.
Deal economics
- At list price, monthly cash flow is $1k ($14k/yr) — positive.
- The deal already cash-flows at list — no discount required.
- Meets the 1% rule at list price ($2k rent vs $125k).
- Recommended offer: $123k (1.5% below list) — sets the bar for market timing.
- Cap rate 17.6% vs local median 3.3% in Kennewick — top-decile yield for the area; either an underpriced asset or a hidden risk that comps aren't pricing in. Stress-test before assuming the spread holds.
Location & tenants
- Location reads 78/100 on livability (#131 in WA, #2,599 nationally) — a middle-class / working-renter tenant base. Strengths: commute A+, housing A+, health & safety A; Watch: schools D+, amenities D+, crime F.
- Richland School District (urban): math 52% / reading 64% proficiency, ranked #61 of 291 in WA (top 21%) — acceptable for families but not a draw, mixed tenant base, ~2y average lease.
- Market conditions: Rents rising (+3.4%/yr); 292 active listings in the ZIP; 9 comparable units currently listed for rent nearby; rentals at typical pace (median 23d on market — plan ~3-4 weeks tenant-placement turnaround); 44% of comp listings sitting > 30 days — soft ceiling on asking rent; 1,532 units permitted in Benton County in 2024 (389 in 5+ unit buildings).
- At $2,436/mo this rent would consume 47% of the median local household income ($63k/yr) (locally 2605% of renters already pay >50% of income on rent) — very limited rent-growth headroom before tenants either downsize or default.
Forward outlook
- Local home prices are declining (-3.0%/yr); year-one equity from $864 of loan paydown is wiped out by about $4k of value loss. Plan a longer hold.
- Benton County population projected at +32% by 2050 — long-run rental-demand tailwind backs the buy-and-hold thesis.
- At projected returns (-3.0% appreciation + 3.4% rent growth), your $35k cash investment doubles in ~3 years — after that, you're playing with house money.
Negotiation context
- It's been on market 30 days — a 2% lower offer ($123k) is reasonable based on typical stale-listing flexibility.
- 2 sale attempts since 7y ago; this cycle's ask has dropped $14k (10%) from the opening price — seller is motivated, your offer sets the floor, not the list.
- Current owner paid $75k; list at $125k implies a 67% gain — meaningful room to come down on a strong offer.
Risks & watch-outs
- Climate carrying-cost: extreme-heat days projected 7→15/yr by 2055 (HVAC capex compounding) — expect insurance premiums to compound above CPI over the hold.
Questions for the listing agent
- Is there a deadline driving the sale (1031 exchange, divorce, estate, relocation)? That informs how much negotiation room exists.
- Schools are D-rated, which usually means shorter tenancies and higher turnover. Who's the typical renter profile here, and what's been the actual vacancy rate?
- Crime grade is F in this area — have there been break-ins, vandalism, or insurance claims at this property in the last 3 years? What carrier currently insures it and at what premium?
- What's the average days-on-market for RENTAL listings here right now (not sales)? A rising rental-DOM trend means longer vacancies and softer asking-rent achievability than the comps imply.
- What's the recent tenant-quality profile in this submarket — average credit score on applications, eviction rate, late-payment / NSF rate, and stable-employment percentage? A property-management company in the area should have these aggregated.
- How much new for-sale + rental construction is in the pipeline within 1–3 miles? Heavy new supply typically softens prices + rents 12–24 months out; constrained supply supports both.
Investment metrics
- 1% rule
- 1.95% ✓
- Cap rate
- 17.61%
- Cash-on-cash
- 40.41%
- DSCR
- 2.80
- GRM
- 4.3
CMA / ARV
- ARV (median comp)
- $327,407
- List price
- $124,900
- Delta
- -61.85%
- Verdict
- UNDERPRICED
- Comps
- 14 within 1.0 mi
Show comp detail 4 sales within ~0.75 mi
| Address | Dist | Beds/Ba | Sqft | Sold | Price | $/sf | Match |
|---|---|---|---|---|---|---|---|
| 1645 Lantana Ave | 0.40mi | 4/2.0 | 1,888 (+2%) | 3mo | $350,000 | $185 | 75 |
| 9157 W Arrowhead Ave | 0.18mi | 3/2.0 (-1) | 1,728 (-6%) | 18mo | $298,000 | $172 | 61 |
| 8530 W Arrowhead Ave | 0.41mi | 3/2.0 (-1) | 1,596 (-14%) | 6mo | $335,000 | $210 | 48 |
| 8324 W Yellowstone Ave | 0.59mi | 4/2.0 | 1,714 (-7%) | 23mo | $331,000 | $193 | 41 |
Match score weights: distance 35% · size 25% · config 20% · recency 20%. Top-matched comps best support the ARV.
Projected returns pro-forma
-3.0% appreciation · 3.39% rent growth · sell at horizon
- IRR
- 37.2%
- Equity multiple
- 2.59×
- Total profit
- $55,688
- Equity at exit
- $18,623
- IRR
- 44.0%
- Equity multiple
- 5.26×
- Total profit
- $148,898
- Equity at exit
- $10,799
Cash invested: $34,972 (down + closing). Projections, not guarantees.
Landlord ↔ Tenant lean methodology
- Overall (STATE)
- 28 Tenant-Leaning
- State Washington
- 28 Tenant-Leaning · D+8
- County
- — inherits STATE
- City
- — inherits STATE
ZIP-level market 99336
- Rents YoY
- 3.4%
- Active inventory
- 292
- Price-to-rent
- 4.3×
Monthly cashflow live
- Estimated rent
- $2,436 high interval (Pro) →
- Mortgage (P&I)
- −$655
- Tax from tax record
- −$40 /mo · $477/yr
- Insurance
- −$52
- HOA
- −$0
- Vacancy / Maint / Mgmt
- −$512
- Net cashflow
- $1,178
Break-even live
Sensitivity live
| Price | -10% $1,248 | -5% $1,213 | +0% $1,178 | +5% $1,142 | +10% $1,107 |
|---|---|---|---|---|---|
| Rent | -10% $985 | -5% $1,081 | +0% $1,178 | +5% $1,274 | +10% $1,370 |
| Rate | -1.0pp $1,241 | -0.5pp $1,209 | base $1,178 | +0.5pp $1,145 | +1.0pp $1,112 |
UW: 25.0% down · 7.5% · 30yr · 1.5% tax · 5.0% vac · 8.0% maint · 8.0% mgmt
Financing live
Cash to close
- Down payment
- $31,225
- Closing costs
- $3,747
- Reserves months
- —
- Total cash needed
- —
Loan-product check · same deal, 3 products live
Conventional
25% down · 7.5% · 30yr
- Down + closing
- —
- Monthly P&I
- —
- Monthly cashflow
- —
- DSCR
- —
- Eligible?
- —
Personal DTI + credit; lowest rate.
DSCR
20% down · 8.5% · 30yr
- Down + closing
- —
- Monthly P&I
- —
- Monthly cashflow
- —
- DSCR
- —
- Eligible?
- —
No personal income docs; deal must DSCR.
Hard money
10% down · 12.0% · 12mo
- Down + closing
- —
- Monthly P&I
- —
- Monthly cashflow
- —
- DSCR
- —
- Eligible?
- —
Short-term bridge; refi at stabilization.
Rent comps 9 comps
| Address | Beds | Baths | Sqft | Rent | $/sqft | DOM | Units | Dist |
|---|---|---|---|---|---|---|---|---|
| 406 W Canyon Ave Kennewick, WA | 4.0 | 2.5 | 2050 | $2,750 | $1.34 | 22d | 1 | 0.35mi |
| 1653 Larkspur Dr Richland, WA | 3.0 | 2.0 | 1608 | $2,295 | $1.43 | 22d | 1 | 0.37mi |
| 423 Nicklaus Ct Richland, WA | 3.0 | 3.5 | 2590 | $3,000 | $1.16 | 45d | 1 | 0.61mi |
| 250 Gage Blvd Richland, WA | 1.0–3.0 | 1.0–2.0 | 1012 | $2,080 | $2.06 | 15d | 10 | 0.64mi |
| 1506 Cimarron Ave Richland, WA | 3.0 | 2.0 | 1500 | $2,095 | $1.40 | 45d | 1 | 0.83mi |
| 1080 N Montana St Kennewick, WA | 3.0 | 2.0 | 1842 | $2,600 | $1.41 | 45d | 1 | 0.94mi |
| 725 N Center Pkwy Kennewick, WA | 1.0–3.0 | 1.0–2.0 | 1086 | $2,195 | $2.02 | 15d | 9 | 1.01mi |
| 8831 W Entiat Ave Kennewick, WA | 3.0 | 2.0 | 1232 | $1,995 | $1.62 | 45d | 1 | 1.27mi |
| 7113 W Arrowhead Ave Kennewick, WA | 3.0 | 2.0 | 1848 | $2,595 | $1.40 | 15d | 1 | 1.36mi |
Listing history 16 events
-
2026-06-15statusdays on market $124,900 Pending 30 DOM
-
2026-06-14days on market $124,900 Active 29 DOM
-
2026-06-13days on market $124,900 Active 28 DOM
-
2026-06-10pricedays on market $124,900 Active 26 DOM
-
2026-06-09days on market $139,000 Active 25 DOM
-
2026-06-08days on market $139,000 Active 24 DOM
-
2026-06-07days on market $139,000 Active 23 DOM
-
2026-06-05days on market $139,000 Active 20 DOM
-
2026-06-03days on market $139,000 Active 19 DOM
-
2026-06-02days on market $139,000 Active 18 DOM
-
2026-06-01days on market $139,000 Active 17 DOM
-
2026-05-31days on market $139,000 Active 16 DOM
-
2026-05-30days on market $139,000 Active 15 DOM
-
2026-05-15$139,000 Active 949-char remark
-
2020-05-19soldstatus $75,000 553-char remark
Show marketing remark (553 chars)
Large spacious home that is move in ready. Almost all the flooring has been updated to tile and wood. Master bathroom has some updating and the main bathroom has been updated with walk in tile shower, built in shelves and new countertop. Kitchen has been updated with a kitchen island, counter tops and stainless steel appliances. Formal dining room has built in book shelves. Family room is oversized and is perfect for entertaining. 3rd bedroom has a built in cabinets and desk. Home also features two wood decks and a large shed along with a hot tub.
-
2019-12-09$79,995 553-char remark
Show marketing remark (553 chars)
Large spacious home that is move in ready. Almost all the flooring has been updated to tile and wood. Master bathroom has some updating and the main bathroom has been updated with walk in tile shower, built in shelves and new countertop. Kitchen has been updated with a kitchen island, counter tops and stainless steel appliances. Formal dining room has built in book shelves. Family room is oversized and is perfect for entertaining. 3rd bedroom has a built in cabinets and desk. Home also features two wood decks and a large shed along with a hot tub.
ⓘ Source: listings_history table (triggers on properties + properties_extension) + one-shot
backfill from property_details.listing_events for pre-trigger history.
Tax reassessment forecast WA · Resets to sale price
- Current annual tax
- $477 · $40/mo
- Projected year-2 tax
- $1,224 · $102/mo
- Expected delta
- +$747/yr (+$62/mo · 156.5%)
ⓘ Screening estimate from a state-policy table — verify with the county assessor before closing.
Climate risk First Street
- Flood 1/10 Low FEMA zone X · 0% chance over 30 yrs
- Wildfire 1/10 Low
- Heat 5/10 Major 7 d/yr ≥98°F today · 15 d/yr by 30 yrs out
- Wind 1/10 Low
- Air quality 8/10 Severe 14 unhealthy d/yr today · 15 by 30 yrs out
Nearby sold comps map
Loading sold comps map…
Walkable amenities ~0.75 mi
Loading nearby amenities…
Taxation est. · year 1
- Rental income
- $29,232
- − Mortgage interest
- −$6,996
- − Property taxes
- −$477
- − Insurance
- −$624
- − Repairs & maintenance
- −$2,339
- − Management
- −$2,339
- − Depreciation
- −$3,633
- Taxable income
- $12,823
- Est. tax owed @ 24.0%
- −$3,078
- After-tax cash flow
- $11,054/yr
For passive investors: Depreciation is non-cash, so a rental often shows a tax loss while cash-flowing — sheltering income. Rental losses are passive: they offset passive income freely, and up to $25,000/yr can offset ordinary (W-2) income if you actively participate and your MAGI is under $100k (phasing out to $0 by $150k); unused losses carry forward. On sale, claimed depreciation is recaptured at up to 25%, and gains may owe capital-gains tax (a 1031 exchange can defer both). Figures are a year-1 estimate at your 24.0% rate — not tax advice; consult a CPA.
Schools (NCES district)
- District
- Richland School District
- NCES district ID
- 5307320
- Math proficiency
- 52% ▬ 0.00%
- Reading proficiency
- 64% ▼ -1.00%
- Median HH income
- $70,475
- Composite
- 53.04/100
- National rank
- #3244
- State rank
- #61 of 291 in WA
Livability — Kennewick
- Score
- 78/100
- State rank
- #131
- US rank
- #2599
Category grades
Schools grade is shown separately in the Schools card above.
Census & demographics
- Census place
- Kennewick, WA
- County
- Benton County · 186,895 people
- City population
- 104,655
- Metro
- Kennewick-Richland, WA
- Population (ZIP)
- 50,735
- Household income
- $62,527
- Rent vs Own
- Severe rent burden
- 2605.0
Population outlook (Benton County) Hauer SSP2
- Today (2025)
- 219,421 people
- By 2030
- 233,813 · +6.6%
- By 2040
- 262,134 · +19.5%
- By 2050
- 290,100 · +32.2%
- By 2075
- 363,525 · +65.7%
- By 2100
- 418,667 · +90.8%
Race, ethnicity, and origin ACS 2023
- Neighborhood character
- Diverse neighborhood (Simpson 0.56)
- Race & ethnicity
- White 55% Hispanic / Latino 37% Two or more races 15% Black 3% Asian 2% Native American 1%
- Hispanic origin (detail)
- Mexican 31% Cuban 2%
- Common ancestry
- Portuguese 4% Slovak 3% Romanian 1%
- Foreign-born
- 16% · Canada, Jamaica
- Languages at home
- 68% English-only · Spanish 29% Arabic 1%
Political lean MEDSL · Benton
- 2024 margin
- Strong R (+21.9) · D 37.7% · R 59.6% · Other 2.7%
- 2008→2024 swing
- +4.2pp toward D · 2008: -26.1pp · 2024: -21.9pp
- All cycles
- 2024: R+21.9 2020: R+21.0 2016: R+26.6 2012: R+27.0 2008: R+26.1
Not yet ingested
- Civics
- —
Market trends
- HPI YoY
- ▼ -408.26%
- Current HPI
- 256.1143
- Rent YoY
- ▲ 3.39%
- Metro
- Kennewick-Richland, WA
- State GDP YoY
- ▲ 4.65%
- F500 in state
- 22
Industry mix (Fortune 500 HQ in WA)
| Industry | F500 HQs | Revenue |
|---|---|---|
| Retail | 2 | $269B |
|
||
| Technology / Retail | 1 | $638B |
|
||
| Technology | 1 | $245B |
|
||
| Telecommunications | 1 | $38B |
|
||
| Food / Beverage | 1 | $36B |
|
||
| Automotive / Trucks | 1 | $34B |
|
||
Price history
+56.1% since first listed5 events — show timeline
- 2026-06-15 Pending — PACMLS
- 2026-06-09 Price Changed $124,900 PACMLS
- 2026-05-15 Listed $139,000 PACMLS
- 2020-05-19 Sold (MLS) $75,000 PACMLS
- 2019-12-09 Listed $79,995 PACMLS
Property tax history
+0.4%/yrLatest (2026): $477 · +13.1% YoY. Source: county tax records.
Cash-flow waterfall
monthlySold comps — $/sqft
last 12 mo · ≤1 miLoading sold comps…