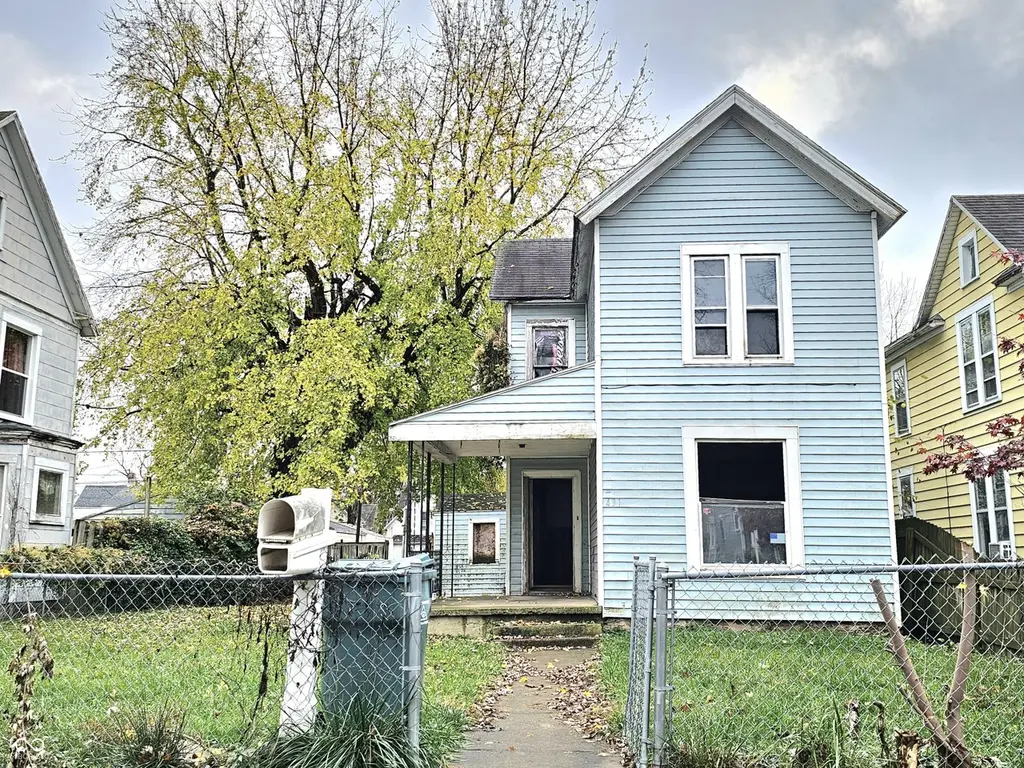
431 Randolph St · Richmond, IN
Flood risk 1/10 · Minimal
- FEMA flood zone
- X (unshaded)
- Chance of flooding over 30 yrs
- 0.0%
- Est. flood insurance / yr
- $473 – $860
Fire risk 1/10 · Minimal
- Est. fire insurance / yr
- $717 – $1,331
Heat risk 3/10 · Minor
- Hot days now (above 100°F)
- 7 days/yr
- Hot days in 30 yrs
- 18 days/yr
Wind risk 2/10 · Minimal
- Chance of severe wind over 30 yrs
- 1.0%
Air-quality risk 3/10 · Minor
- Unhealthy air days now
- 2 days/yr
- Unhealthy air days in 30 yrs
- 3 days/yr
Risk factors via First Street. Map © Google.
Why this score? — see what drove the B+ grade
The composite is a weighted blend of 9 inputs, each scored 0–100. Each bar is that input's sub-score; the figure is the points it added to the 100-point composite (weight × sub-score).
- Cash flow +30.0/30.0
- ARV discount +15.0/15.0
- 1% rule +10.0/10.0
- DSCR +10.0/10.0
- Livability +4.2/5.0
- Rent growth +2.5/5.0
- Condition / age +2.5/5.0
- Schools +1.9/10.0
- Appreciation +0.0/10.0
$61,749
🖨 Deal sheet 📄 Offer letter ✓ Due diligence
Listing remarks MLS
SELLER FINANCING AVAILABLE! Welcome to this spacious 3-bedroom, 1.5-bathroom home located in the heart of Richmond's desirable school district. This property is perfect for both investors and homeowners alike, offering large rooms that provide ample space for comfortable living. Situated in a great school district and close to shopping, groceries, and other amenities, this home makes daily errands a breeze. It is a fantastic rental investment opportunity, promising great returns. The home also features a separate laundry room for added convenience and a 24x24 garage that provides ample storage and parking space. Whether you're looking to invest or find a new place to call home, 431 Randolph Street has everything you need. Don't miss out on this incredible opportunity. For more information or to schedule a viewing, contact: Brian Ingle @ FC Tucker Richmond 765-960-0533 Brian. [email protected]
Key facts
- Ample space
- Ample storage
- 7,187 sq ft lot
Tags
Property features AI
Finance
- Other: Lot approximately 0.17 acre (< 1/4 acre)
Exterior
- Parking: Detached 2-car garage
- Security: Smoke detector(s)
- Utilities: Public water service; Municipal sewer connection; Solid waste service
- Home design: Single-family residence; Two stories; Public water
- Construction: Vinyl siding; Block foundation
- Exterior features: Front yard fencing
Interior
- Kitchen: Eat-in kitchen
- Bedrooms: Three bedrooms on the upper level
- Bathrooms: Two full bathrooms (one on upper level, one in basement)
- Heating & cooling: Forced air heating; No central air
- Interior features: Eat-in kitchen; Basement present; Smoke detectors
- Laundry & utility: Main-level laundry room
Neighborhood map
What this means for you Summary
Snapshot
- This is a 3-bed/1.5-bath single-family listed at $62k.
Deal economics
- At list price, monthly cash flow is $463 ($6k/yr) — positive.
- The deal already cash-flows at list — no discount required.
- Meets the 1% rule at list price ($1k rent vs $62k).
- Recommended offer: $60k (3.0% below list) — sets the bar for market timing.
- Cap rate 15.3% vs local median 5.2% in Richmond — top-decile yield for the area; either an underpriced asset or a hidden risk that comps aren't pricing in. Stress-test before assuming the spread holds.
Location & tenants
- Location reads 83/100 on livability (#10 in IN, #869 nationally) — a professional / high-income tenant draw. Strengths: commute A+, cost of living A+, housing A+; Watch: crime D+, schools D-, employment D-.
- Richmond Community Schools (town): math 18% / reading 27% proficiency, ranked #270 of 301 in IN (top 90%) — low school quality limits family demand, transient renter base, plan for 1-2y turnover; 65% free/reduced lunch — lower-income household profile, screen leases tightly.
- Market conditions: 273 active listings in the ZIP; 2 comparable units currently listed for rent nearby; 38 units permitted in Wayne County in 2024 (0 in 5+ unit buildings).
Forward outlook
- Local home prices are declining (-3.0%/yr); year-one equity from $427 of loan paydown is wiped out by about $2k of value loss. Plan a longer hold.
- Wayne County population projected at -21% by 2050 — secular population decline; favor cash flow + early exit over multi-decade hold.
- At projected returns (-3.0% appreciation + 3.0% rent growth), your $17k cash investment doubles in ~4 years — after that, you're playing with house money.
Negotiation context
- It's been on market 46 days — a 3% lower offer ($60k) is reasonable based on typical stale-listing flexibility.
- 2 sale attempts with the ask held roughly flat each time — persistent listings suggest the price (not the market) is what's stuck; bring a comps-based counter.
Risks & watch-outs
- Watch-outs: built in 1900 — expect roof / HVAC / electrical / plumbing capex.
Questions for the listing agent
- It's been on market 46 days. Have you received any prior offers? Is the seller open to a 3% concession, seller financing, or rate buy-down credit?
- Built in 1900 — when were the roof, HVAC, electrical panel, plumbing, and water heater last replaced?
- Is there a deadline driving the sale (1031 exchange, divorce, estate, relocation)? That informs how much negotiation room exists.
- Schools are D-rated, which usually means shorter tenancies and higher turnover. Who's the typical renter profile here, and what's been the actual vacancy rate?
- Crime grade is D in this area — have there been break-ins, vandalism, or insurance claims at this property in the last 3 years? What carrier currently insures it and at what premium?
- What's the average days-on-market for RENTAL listings here right now (not sales)? A rising rental-DOM trend means longer vacancies and softer asking-rent achievability than the comps imply.
- What's the recent tenant-quality profile in this submarket — average credit score on applications, eviction rate, late-payment / NSF rate, and stable-employment percentage? A property-management company in the area should have these aggregated.
- How much new for-sale + rental construction is in the pipeline within 1–3 miles? Heavy new supply typically softens prices + rents 12–24 months out; constrained supply supports both.
Investment metrics
- 1% rule
- 1.82% ✓
- Cap rate
- 15.28%
- Cash-on-cash
- 32.11%
- DSCR
- 2.43
- GRM
- 4.6
CMA / ARV
- ARV (on-the-fly)
- $115,498
- Comps found
- 12
Show comp detail 12 sales within ~0.75 mi
| Address | Dist | Beds/Ba | Sqft | Sold | Price | $/sf | Match |
|---|---|---|---|---|---|---|---|
| 431 Lincoln St | 0.07mi | 3/1.0 | 1,608 (+10%) | 2mo | $146,500 | $91 | 76 |
| 620 SW A St | 0.38mi | 3/1.5 | 1,456 (-0%) | 8mo | $119,000 | $82 | 75 |
| 319 Kinsey St | 0.23mi | 3/2.0 | 1,584 (+8%) | 3mo | $60,000 | $38 | 71 |
| 624 Peacock Rd | 0.16mi | 3/1.0 | 1,334 (-9%) | 7mo | $135,000 | $101 | 70 |
| 239 NW I St | 0.50mi | 2/1.0 (-1) | 1,416 (-3%) | 1mo | $112,000 | $79 | 64 |
| 706 Indiana Ave | 0.54mi | 2/1.0 (-1) | 1,536 (+5%) | 1mo | $109,900 | $72 | 58 |
| 116 SW 7th St | 0.45mi | 3/2.0 | 1,624 (+11%) | 5mo | $138,000 | $85 | 55 |
| 2 Cedar Ct | 0.64mi | 3/2.0 | 1,568 (+7%) | 2mo | $42,000 | $27 | 54 |
| 1034 Boyer St | 0.64mi | 2/1.5 (-1) | 1,404 (-4%) | 8mo | $37,600 | $27 | 52 |
| 105 SW 10th St | 0.57mi | 3/1.0 | 1,270 (-13%) | 1mo | $157,500 | $124 | 49 |
| 345 SW 4th St | 0.63mi | 3/1.0 | 1,632 (+12%) | 2mo | $110,000 | $67 | 47 |
| 432 SW 3rd St | 0.72mi | 3/1.0 | 1,670 (+14%) | 7mo | $124,900 | $75 | 35 |
Match score weights: distance 35% · size 25% · config 20% · recency 20%. Top-matched comps best support the ARV.
Projected returns pro-forma
-3.0% appreciation · 3.0% rent growth · sell at horizon
- IRR
- 27.1%
- Equity multiple
- 2.13×
- Total profit
- $19,478
- Equity at exit
- $9,207
- IRR
- 34.7%
- Equity multiple
- 4.18×
- Total profit
- $54,969
- Equity at exit
- $5,339
Cash invested: $17,290 (down + closing). Projections, not guarantees.
Landlord ↔ Tenant lean methodology
- Overall (STATE)
- 90 Strongly Landlord-Friendly
- State Indiana
- 90 Strongly Landlord-Friendly · R+11
- County
- — inherits STATE
- City
- — inherits STATE
ZIP-level market 47374
- Active inventory
- 273
- Price-to-rent
- 4.6×
Monthly cashflow live
- Estimated rent
- $1,122 medium interval (Pro) →
- Mortgage (P&I)
- −$324
- Tax from tax record
- −$74 /mo · $892/yr
- Insurance
- −$26
- HOA
- −$0
- Vacancy / Maint / Mgmt
- −$236
- Net cashflow
- $463
Break-even live
UW: 25.0% down · 7.5% · 30yr · 1.5% tax · 5.0% vac · 8.0% maint · 8.0% mgmt
Financing live
Cash to close
- Down payment
- $15,437
- Closing costs
- $1,852
- Reserves months
- —
- Total cash needed
- —
Loan-product check · same deal, 3 products live
Conventional
25% down · 7.5% · 30yr
- Down + closing
- —
- Monthly P&I
- —
- Monthly cashflow
- —
- DSCR
- —
- Eligible?
- —
Personal DTI + credit; lowest rate.
DSCR
20% down · 8.5% · 30yr
- Down + closing
- —
- Monthly P&I
- —
- Monthly cashflow
- —
- DSCR
- —
- Eligible?
- —
No personal income docs; deal must DSCR.
Hard money
10% down · 12.0% · 12mo
- Down + closing
- —
- Monthly P&I
- —
- Monthly cashflow
- —
- DSCR
- —
- Eligible?
- —
Short-term bridge; refi at stabilization.
Rent comps 2 comps
| Address | Beds | Baths | Sqft | Rent | $/sqft | DOM | Units | Dist |
|---|---|---|---|---|---|---|---|---|
| 418 NW L St Richmond, IN | 3.0 | 1.0 | 1608 | $1,275 | $0.79 | 43d | 1 | 0.76mi |
| 401 N 10th St Richmond, IN | 1.0–2.0 | 1.0 | 817 | $895 | $1.09 | 43d | 3 | 0.98mi |
Listing history 19 events
-
2026-06-19days on market $61,749 Active 46 DOM
-
2026-06-18days on market $61,749 Active 45 DOM
-
2026-06-17days on market $61,749 Active 44 DOM
-
2026-06-16days on market $61,749 Active 43 DOM
-
2026-06-15days on market $61,749 Active 42 DOM
-
2026-06-14days on market $61,749 Active 40 DOM
-
2026-06-12days on market $61,749 Active 39 DOM
-
2026-06-09days on market $61,749 Active 36 DOM
-
2026-06-08days on market $61,749 Active 35 DOM
-
2026-06-07days on market $61,749 Active 34 DOM
-
2026-06-03days on market $61,749 Active 30 DOM
-
2026-06-02days on market $61,749 Active 29 DOM
-
2026-06-01days on market $61,749 Active 28 DOM
-
2026-05-31days on market $61,749 Active 27 DOM
-
2026-05-30days on market $61,749 Active 26 DOM
-
2026-05-04$61,749 Active
Show marketing remark (910 chars)
SELLER FINANCING AVAILABLE! Welcome to this spacious 3-bedroom, 1.5-bathroom home located in the heart of Richmond's desirable school district. This property is perfect for both investors and homeowners alike, offering large rooms that provide ample space for comfortable living. Situated in a great school district and close to shopping, groceries, and other amenities, this home makes daily errands a breeze. It is a fantastic rental investment opportunity, promising great returns. The home also features a separate laundry room for added convenience and a 24x24 garage that provides ample storage and parking space. Whether you're looking to invest or find a new place to call home, 431 Randolph Street has everything you need. Don't miss out on this incredible opportunity. For more information or to schedule a viewing, contact: Brian Ingle @ FC Tucker Richmond 765-960-0533 Brian. [email protected]
-
2026-05-04$61,749 Active 910-char remark
Show marketing remark (910 chars)
SELLER FINANCING AVAILABLE! Welcome to this spacious 3-bedroom, 1.5-bathroom home located in the heart of Richmond's desirable school district. This property is perfect for both investors and homeowners alike, offering large rooms that provide ample space for comfortable living. Situated in a great school district and close to shopping, groceries, and other amenities, this home makes daily errands a breeze. It is a fantastic rental investment opportunity, promising great returns. The home also features a separate laundry room for added convenience and a 24x24 garage that provides ample storage and parking space. Whether you're looking to invest or find a new place to call home, 431 Randolph Street has everything you need. Don't miss out on this incredible opportunity. For more information or to schedule a viewing, contact: Brian Ingle @ FC Tucker Richmond 765-960-0533 Brian. [email protected]
-
2025-11-18price $61,749
-
2025-04-02price $61,750
ⓘ Source: listings_history table (triggers on properties + properties_extension) + one-shot
backfill from property_details.listing_events for pre-trigger history.
Tax reassessment forecast IN · Partial reset (capped growth)
- Current annual tax
- $892 · $74/mo
- Projected year-2 tax
- $892 · $74/mo
- Expected delta
- $0/yr ($0/mo · 0.0%)
ⓘ Screening estimate from a state-policy table — verify with the county assessor before closing.
Climate risk First Street
- Flood 1/10 Low FEMA zone X (unshaded) · 0% chance over 30 yrs
- Wildfire 1/10 Low
- Heat 3/10 Moderate 7 d/yr ≥100°F today · 18 d/yr by 30 yrs out
- Wind 2/10 Low 100% chance of damaging wind over 30 yrs
- Air quality 3/10 Moderate 2 unhealthy d/yr today · 3 by 30 yrs out
Nearby sold comps map
Loading sold comps map…
Walkable amenities ~0.75 mi
Loading nearby amenities…
Taxation est. · year 1
- Rental income
- $13,467
- − Mortgage interest
- −$3,459
- − Property taxes
- −$892
- − Insurance
- −$309
- − Repairs & maintenance
- −$1,077
- − Management
- −$1,077
- − Depreciation
- −$1,796
- Taxable income
- $4,856
- Est. tax owed @ 24.0%
- −$1,165
- After-tax cash flow
- $4,387/yr
For passive investors: Depreciation is non-cash, so a rental often shows a tax loss while cash-flowing — sheltering income. Rental losses are passive: they offset passive income freely, and up to $25,000/yr can offset ordinary (W-2) income if you actively participate and your MAGI is under $100k (phasing out to $0 by $150k); unused losses carry forward. On sale, claimed depreciation is recaptured at up to 25%, and gains may owe capital-gains tax (a 1031 exchange can defer both). Figures are a year-1 estimate at your 24.0% rate — not tax advice; consult a CPA.
Schools (NCES district)
- District
- Richmond Community Schools
- NCES district ID
- 1809510
- Math proficiency
- 18% ▼ -7.00%
- Reading proficiency
- 27% ▼ -2.00%
- Median HH income
- $35,288
- Composite
- 18.55/100
- National rank
- #8913
- State rank
- #270 of 301 in IN
Livability — Richmond
- Score
- 83/100
- State rank
- #10
- US rank
- #869
Category grades
Schools grade is shown separately in the Schools card above.
Census & demographics
- Census place
- Richmond, IN
- County
- Wayne County · 44,615 people
- City population
- 44,615
- Metro
- Richmond, IN
- Population (ZIP)
- 44,615
- Household income
- $50,766
- Rent vs Own
- Severe rent burden
- 1600.0
Population outlook (Wayne County) Hauer SSP2
- Today (2025)
- 63,316 people
- By 2030
- 60,893 · -3.8%
- By 2040
- 55,386 · -12.5%
- By 2050
- 49,946 · -21.1%
- By 2075
- 37,900 · -40.1%
- By 2100
- 26,562 · -58.0%
Race, ethnicity, and origin ACS 2023
- Neighborhood character
- Predominantly White (82%)
- Race & ethnicity
- White 82% Two or more races 7% Black 6% Hispanic / Latino 4% Asian 1%
- Common ancestry
- Slovak 2% Italian 1% Lithuanian 1%
- Foreign-born
- 4% · Canada, China
- Languages at home
- 95% English-only · Spanish 3%
Political lean MEDSL · Wayne
- 2024 margin
- Solid R (+32.5) · D 32.9% · R 65.4% · Other 1.6%
- 2008→2024 swing
- -28.6pp toward R · 2008: -3.9pp · 2024: -32.5pp
- All cycles
- 2024: R+32.5 2020: R+29.1 2016: R+30.1 2012: R+14.7 2008: R+3.9
Not yet ingested
- Civics
- —
Market trends
- HPI YoY
- ▼ -118.64%
- Current HPI
- 182.5038
- Rent YoY
- —
- Metro
- Richmond, IN
- State GDP YoY
- ▲ 2.90%
- F500 in state
- 18
Industry mix (Fortune 500 HQ in IN)
| Industry | F500 HQs | Revenue |
|---|---|---|
| Industrial Machinery | 2 | $37B |
|
||
| Healthcare | 1 | $177B |
|
||
| Pharmaceuticals | 1 | $45B |
|
||
| Metals / Steel | 1 | $18B |
|
||
| Agriculture | 1 | $17B |
|
||
| Packaging | 1 | $12B |
|
||
Price history
-0.0% since first listed4 events — show timeline
- 2026-05-04 Listed $61,749 RRELMS
- 2026-05-04 Listed $61,749 MIBOR as Distributed by MLS Grid
- 2025-11-18 Price Changed $61,749 RRELMS
- 2025-04-02 Price Changed $61,750 RRELMS
Property tax history
+8.7%/yrLatest (2024): $892 · +14.1% YoY. Source: county tax records.
Cash-flow waterfall
monthlySold comps — $/sqft
last 12 mo · ≤1 miLoading sold comps…