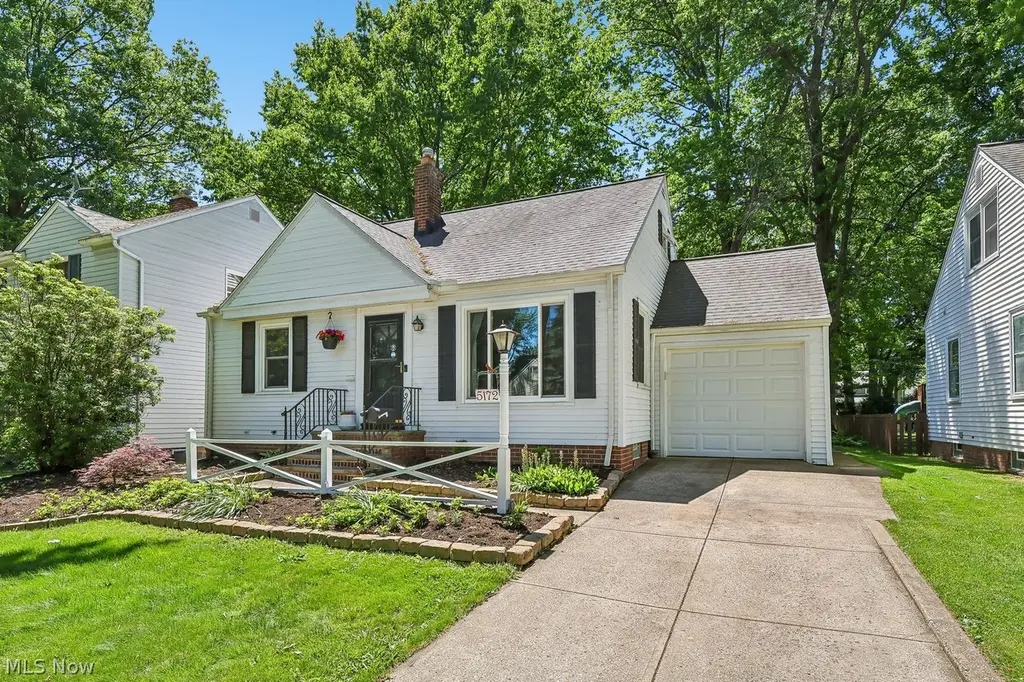
5172 Lynd Ave · Lyndhurst, OH
Flood risk 1/10 · Minimal
- FEMA flood zone
- X (unshaded)
- Chance of flooding over 30 yrs
- 0.0%
- Est. flood insurance / yr
- $473 – $860
Fire risk 1/10 · Minimal
- Est. fire insurance / yr
- $713 – $1,323
Heat risk 2/10 · Minimal
- Hot days now (above 95°F)
- 7 days/yr
- Hot days in 30 yrs
- 16 days/yr
Wind risk 1/10 · Minimal
- Chance of severe wind over 30 yrs
- —
Air-quality risk 3/10 · Minor
- Unhealthy air days now
- 2 days/yr
- Unhealthy air days in 30 yrs
- 5 days/yr
Risk factors via First Street. Map © Google.
Why this score? — see what drove the D+ grade
The composite is a weighted blend of 9 inputs, each scored 0–100. Each bar is that input's sub-score; the figure is the points it added to the 100-point composite (weight × sub-score).
- Cash flow +18.6/30.0
- 1% rule +6.1/10.0
- DSCR +5.9/10.0
- Livability +4.1/5.0
- ARV discount +3.6/15.0
- Rent growth +3.6/5.0
- Schools +3.1/10.0
- Condition / age +2.5/5.0
- Appreciation +0.0/10.0
$199,900
🖨 Deal sheet (PDF) 📄 Offer letter ✓ Due diligence
Listing remarks MLS
Welcome to this beautiful tree-lined street in the city of Lyndhurst! This is one of the most meticulously maintained and cared for homes you'll find on the market today. This gorgeous 3 bedroom, 2 bath (one in the basement) home has updates galore. The first floor consists of a living room, dining room, kitchen, 2 bedrooms, and an updated bathroom. The large open second floor contains the 3rd bedroom. The basement feels like an extension of the first floor, with a high-quality finished recreation room and full bathroom. The laundry room and mechanicals are located on the unfinished side of the basement. The relaxing sun room overlooks the peaceful, shaded, back yard and patio. Sit back and enjoy the evenings with friends and family! There is also central air to help survive those hot summer days. Some of the many updates include: replacement windows, updated main bath, remodeled kitchen, gorgeous refinished hardwood floors, blown-in insulation, finished basement, new disposal, 100 amp
Key facts
- 8,494 sq ft lot
- Garage
- Built 1949
Neighborhood map
What this means for you Summary
Snapshot
- This is a 3-bed/1.5-bath single-family listed at $200k.
Deal economics
- At list price, monthly cash flow is $194 ($2k/yr) — positive.
- The deal already cash-flows at list — no discount required.
- Meets the 1% rule at list price ($2k rent vs $200k).
- Cap rate 7.5% vs local median 5.5% in Lyndhurst — top-decile yield for the area; either an underpriced asset or a hidden risk that comps aren't pricing in. Stress-test before assuming the spread holds.
Location & tenants
- Location reads 82/100 on livability (#76 in OH, #1,152 nationally) — a professional / high-income tenant draw. Strengths: cost of living A+, housing A+, health & safety A+; Watch: amenities C-, commute F.
- South Euclid-Lyndhurst City (suburban): math 23% / reading 45% proficiency, ranked #556 of 656 in OH (top 85%) — families likely to look elsewhere, expect single-tenant / working-renter base with shorter leases.
- Zoned schools: Sunview Elementary School (math 57% / reading 47%, grade C-, #851 of 1,584 statewide, top 56%, 359 students, 36% FRL); Memorial Junior High School (math 19% / reading 45%, grade F, #559 of 654 statewide, top 87%, 497 students, 51% FRL); Brush High School (math 32% / reading 47%, grade F, #528 of 781 statewide, top 71%, 1,041 students, 44% FRL) — zoned schools at 44% FRL track the district average.
- Market conditions: Rents rising fast (+4.5%/yr); 179 active listings in the ZIP; 4 comparable units currently listed for rent nearby; rentals lingering (median 45d on market — plan ~5-8 weeks vacancy on turnover, expect pricing pressure); 50% of comp listings sitting > 30 days — soft ceiling on asking rent; solid renter incomes; 1,441 units permitted in Cuyahoga County in 2024 (700 in 5+ unit buildings).
- This rent runs 32% of the median local income ($82k/yr) — at the standard rent-burdened threshold; future hikes will face affordability resistance.
Forward outlook
- Local home prices are declining (-3.0%/yr); year-one equity from $1k of loan paydown is wiped out by about $6k of value loss. Plan a longer hold.
- Cuyahoga County population projected to shrink 8% by 2050 — rents likely to lag national; underwrite the cash flow, not the appreciation.
Negotiation context
- Only 3 days on market — expect competitive offers; lowballing is unlikely to land.
- 4 sale attempts since 17y ago with the ask held roughly flat each time — persistent listings suggest the price (not the market) is what's stuck; bring a comps-based counter.
- Current owner paid $160k; 25% above their basis — modest negotiation headroom, anchor on the comps not their cost.
Risks & watch-outs
- Watch-outs: property tax is 2.5% of price; built in 1949 — expect roof / HVAC / electrical / plumbing capex.
Questions for the listing agent
- Built in 1949 — when were the roof, HVAC, electrical panel, plumbing, and water heater last replaced?
- Property tax is high relative to price — has the assessment been appealed recently, and will the sale trigger a re-assessment?
- Is there a deadline driving the sale (1031 exchange, divorce, estate, relocation)? That informs how much negotiation room exists.
- Schools are A-rated — typically a magnet for longer-tenancy family renters. What's the average tenant stay here, and is there a school-zone premium baked into asking?
- The area grade is low — what's the realistic commute time and amenity access for the typical tenant pool here? Any planned neighborhood developments (good or bad) we should know about?
- What's the average days-on-market for RENTAL listings here right now (not sales)? A rising rental-DOM trend means longer vacancies and softer asking-rent achievability than the comps imply.
- What's the recent tenant-quality profile in this submarket — average credit score on applications, eviction rate, late-payment / NSF rate, and stable-employment percentage? A property-management company in the area should have these aggregated.
- How much new for-sale + rental construction is in the pipeline within 1–3 miles? Heavy new supply typically softens prices + rents 12–24 months out; constrained supply supports both.
Investment metrics
- 1% rule
- 1.11% ✓
- Cap rate
- 7.46%
- Cash-on-cash
- 4.16%
- DSCR
- 1.19
- GRM
- 7.5
CMA / ARV
- ARV (on-the-fly)
- $183,960
- Comps found
- 12
Show comp detail 12 sales within ~0.75 mi
| Address | Dist | Beds/Ba | Sqft | Sold | Price | $/sf | Match |
|---|---|---|---|---|---|---|---|
| 888 Richmond Rd | 0.22mi | 2/1.5 (-1) | 1,321 (+5%) | 1mo | $159,000 | $120 | 76 |
| 5247 Case Ave | 0.17mi | 4/2.0 (+1) | 1,338 (+6%) | 8mo | $212,000 | $158 | 68 |
| 5275 Lynd Ave | 0.20mi | 3/1.5 | 1,430 (+14%) | 3mo | $165,000 | $115 | 66 |
| 774 Kenbridge Dr | 0.39mi | 3/2.5 | 1,348 (+7%) | 1mo | $303,000 | $225 | 65 |
| 1207 Irene Rd | 0.69mi | 2/1.0 (-1) | 1,260 (0%) | 0mo | $219,900 | $175 | 60 |
| 5012 S Barton Rd | 0.35mi | 2/1.5 (-1) | 1,413 (+12%) | 2mo | $207,000 | $146 | 56 |
| 1147 Irene Rd | 0.59mi | 3/1.0 | 1,326 (+5%) | 7mo | $182,500 | $138 | 56 |
| 5164 Edenhurst Rd | 0.60mi | 3/2.5 | 1,190 (-6%) | 5mo | $155,000 | $130 | 54 |
| 5011 S Sedgewick Rd | 0.69mi | 3/1.5 | 1,170 (-7%) | 2mo | $210,000 | $179 | 54 |
| 4998 N Barton Rd | 0.35mi | 4/2.5 (+1) | 1,410 (+12%) | 5mo | $175,000 | $124 | 51 |
| 4860 Anderson Rd | 0.59mi | 3/1.5 | 1,379 (+9%) | 8mo | $179,000 | $130 | 50 |
| 981 Hanley Rd | 0.66mi | 4/2.5 (+1) | 1,312 (+4%) | 6mo | $275,000 | $210 | 48 |
Match score weights: distance 35% · size 25% · config 20% · recency 20%. Top-matched comps best support the ARV.
Projected returns pro-forma
-3.0% appreciation · 4.45% rent growth · sell at horizon
- IRR
- -7.9%
- Equity multiple
- 0.70×
- Total profit
- $-16,608
- Equity at exit
- $29,806
- IRR
- 3.6%
- Equity multiple
- 1.28×
- Total profit
- $15,883
- Equity at exit
- $17,284
Cash invested: $55,972 (down + closing). Projections, not guarantees.
Landlord ↔ Tenant lean methodology
- Overall (STATE)
- 73 Landlord-Friendly
- State Ohio
- 73 Landlord-Friendly · R+6
- County
- — inherits STATE
- City
- — inherits STATE
ZIP-level market 44124
- Rents YoY
- 4.5%
- Active inventory
- 179
- Price-to-rent
- 7.5×
Monthly cashflow live
- Estimated rent
- $2,214 medium interval (Pro) →
- Mortgage (P&I)
- −$1,048
- Tax from tax record
- −$424 /mo · $5,083/yr
- Insurance
- −$83
- HOA
- −$0
- Vacancy / Maint / Mgmt
- −$465
- Net cashflow
- $194
Break-even live
Sensitivity live
| Price | -10% $307 | -5% $251 | +0% $194 | +5% $138 | +10% $81 |
|---|---|---|---|---|---|
| Rent | -10% $19 | -5% $107 | +0% $194 | +5% $282 | +10% $369 |
| Rate | -1.0pp $295 | -0.5pp $245 | base $194 | +0.5pp $142 | +1.0pp $90 |
UW: 25.0% down · 7.5% · 30yr · 1.5% tax · 5.0% vac · 8.0% maint · 8.0% mgmt
Financing live
Cash to close
- Down payment
- $49,975
- Closing costs
- $5,997
- Reserves months
- —
- Total cash needed
- —
Loan-product check · same deal, 3 products live
Conventional
25% down · 7.5% · 30yr
- Down + closing
- —
- Monthly P&I
- —
- Monthly cashflow
- —
- DSCR
- —
- Eligible?
- —
Personal DTI + credit; lowest rate.
DSCR
20% down · 8.5% · 30yr
- Down + closing
- —
- Monthly P&I
- —
- Monthly cashflow
- —
- DSCR
- —
- Eligible?
- —
No personal income docs; deal must DSCR.
Hard money
10% down · 12.0% · 12mo
- Down + closing
- —
- Monthly P&I
- —
- Monthly cashflow
- —
- DSCR
- —
- Eligible?
- —
Short-term bridge; refi at stabilization.
Rent comps 4 comps
| Address | Beds | Baths | Sqft | Rent | $/sqft | DOM | Units | Dist |
|---|---|---|---|---|---|---|---|---|
| 4994 N Sedgewick Rd Cleveland, OH | 3.0 | 1.5 | 1400 | $3,000 | $2.14 | 45d | 1 | 0.68mi |
| 1207 Churchill Rd Cleveland, OH | 3.0 | 2.0 | 1134 | $1,895 | $1.67 | 25d | 1 | 0.72mi |
| 1270 Roland Rd Cleveland, OH | 4.0 | 2.0 | 1720 | $2,450 | $1.42 | 45d | 1 | 0.77mi |
| 1547 Commodore Rd Cleveland, OH | 3.0 | 1.0 | 980 | $1,795 | $1.83 | 16d | 1 | 1.31mi |
Listing history 2 events
-
2026-06-13statusdays on market $199,900 Pending 3 DOM
-
2026-06-10$199,900 Active 1 DOM
ⓘ Source: listings_history table (triggers on properties + properties_extension) + one-shot
backfill from property_details.listing_events for pre-trigger history.
Tax reassessment forecast OH · Partial reset (capped growth)
- Current annual tax
- $5,083 · $424/mo
- Projected year-2 tax
- $5,083 · $424/mo
- Expected delta
- $0/yr ($0/mo · 0.0%)
ⓘ Screening estimate from a state-policy table — verify with the county assessor before closing.
Climate risk First Street
- Flood 1/10 Low FEMA zone X (unshaded) · 0% chance over 30 yrs
- Wildfire 1/10 Low
- Heat 2/10 Low 7 d/yr ≥95°F today · 16 d/yr by 30 yrs out
- Wind 1/10 Low
- Air quality 3/10 Moderate 2 unhealthy d/yr today · 5 by 30 yrs out
Nearby sold comps map
Loading sold comps map…
Walkable amenities ~0.75 mi
Loading nearby amenities…
Taxation est. · year 1
- Rental income
- $26,572
- − Mortgage interest
- −$11,198
- − Property taxes
- −$5,083
- − Insurance
- −$1,000
- − Repairs & maintenance
- −$2,126
- − Management
- −$2,126
- − Depreciation
- −$5,815
- Taxable loss
- −$775
- Est. tax savings @ 24.0%
- +$186
- After-tax cash flow
- $2,516/yr
For passive investors: Depreciation is non-cash, so a rental often shows a tax loss while cash-flowing — sheltering income. Rental losses are passive: they offset passive income freely, and up to $25,000/yr can offset ordinary (W-2) income if you actively participate and your MAGI is under $100k (phasing out to $0 by $150k); unused losses carry forward. On sale, claimed depreciation is recaptured at up to 25%, and gains may owe capital-gains tax (a 1031 exchange can defer both). Figures are a year-1 estimate at your 24.0% rate — not tax advice; consult a CPA.
Schools (NCES district)
- District
- South Euclid-Lyndhurst City
- NCES district ID
- 3904479
- Math proficiency
- 23% ▼ -22.00%
- Reading proficiency
- 45% ▼ -11.00%
- Median HH income
- $61,244
- Composite
- 30.51/100
- National rank
- #6212
- State rank
- #556 of 656 in OH
Livability — Lyndhurst
- Score
- 82/100
- State rank
- #76
- US rank
- #1152
Category grades
Schools grade is shown separately in the Schools card above.
Census & demographics
- Census place
- Lyndhurst, OH
- County
- Cuyahoga County · 1,090,369 people
- Metro
- Cleveland-Elyria, OH
- Population (ZIP)
- 39,779
- Household income
- $82,392
- Rent vs Own
- Severe rent burden
- 1286.0
Population outlook (Cuyahoga County) Hauer SSP2
- Today (2025)
- 1,244,621 people
- By 2030
- 1,230,093 · -1.2%
- By 2040
- 1,189,108 · -4.5%
- By 2050
- 1,145,706 · -7.9%
- By 2075
- 1,076,557 · -13.5%
- By 2100
- 978,987 · -21.3%
Race, ethnicity, and origin ACS 2023
- Neighborhood character
- Predominantly White (69%)
- Race & ethnicity
- White 69% Black 15% Two or more races 7% Asian 6% Hispanic / Latino 4%
- Common ancestry
- Romanian 6% Scotch-Irish 4% Lithuanian 3%
- Foreign-born
- 14% · Canada, China, Vietnam
- Languages at home
- 84% English-only · Russian/Polish/Slavic 4% Other Indo-European 4% Spanish 3%
Political lean MEDSL · Cuyahoga
- 2024 margin
- Solid D (+31.5) · D 65.4% · R 33.9%
- 2008→2024 swing
- -7.4pp toward R · 2008: 38.9pp · 2024: 31.5pp
- All cycles
- 2024: D+31.5 2020: D+34.1 2016: D+35.0 2012: D+38.7 2008: D+38.9
Not yet ingested
- Civics
- —
Market trends
- HPI YoY
- ▼ -212.96%
- Current HPI
- 164.108
- Rent YoY
- ▲ 4.45%
- Metro
- Cleveland-Elyria, OH
- State GDP YoY
- ▲ 1.98%
- F500 in state
- 48
Industry mix (Fortune 500 HQ in OH)
| Industry | F500 HQs | Revenue |
|---|---|---|
| Insurance | 3 | $145B |
|
||
| Industrial Machinery | 3 | $49B |
|
||
| Financial Services | 3 | $24B |
|
||
| Consumer Goods | 2 | $93B |
|
||
| Aerospace / Defense | 2 | $47B |
|
||
| Utilities | 2 | $33B |
|
||
Price history
+73.8% since first listed10 events — show timeline
- 2026-06-09 Listed $199,900 MLSNOW
- 2020-08-31 Listing Removed — MLSNOW
- 2020-08-28 Sold (MLS) $159,900 MLSNOW
- 2020-07-16 Pending — MLSNOW
- 2020-07-09 Listed $159,900 MLSNOW
- 2014-09-26 Listing Removed — MLSNOW
- 2014-05-26 Listed $124,000 MLSNOW
- 2009-10-01 Sold (MLS) $107,000 MLSNOW
- 2009-09-30 Sold (Public Records) $107,000 Public Records
- 2009-07-31 Listed $115,000 MLSNOW
Property tax history
+4.5%/yrLatest (2025): $5,083 · +11.3% YoY. Source: county tax records.
Cash-flow waterfall
monthlySold comps — $/sqft
last 12 mo · ≤1 miLoading sold comps…