718 Thea Mdws · Marion, TX
Flood risk No data
- FEMA flood zone
- —
- Chance of flooding over 30 yrs
- —
- Est. flood insurance / yr
- —
Fire risk No data
- Est. fire insurance / yr
- —
Heat risk No data
- Hot days now (above threshold)
- —
- Hot days in 30 yrs
- —
Wind risk No data
- Chance of severe wind over 30 yrs
- —
Air-quality risk No data
- Unhealthy air days now
- —
- Unhealthy air days in 30 yrs
- —
Risk factors via First Street. Map © Google.
Why this score? — see what drove the D grade
The composite is a weighted blend of 9 inputs, each scored 0–100. Each bar is that input's sub-score; the figure is the points it added to the 100-point composite (weight × sub-score).
- ARV discount +15.0/15.0
- Cash flow +7.1/30.0
- Condition / age +5.0/5.0
- Schools +4.0/10.0
- Livability +3.3/5.0
- Rent growth +2.5/5.0
- 1% rule +2.4/10.0
- DSCR +1.3/10.0
- Appreciation +0.0/10.0
$210,999
🖨 Deal sheet (PDF) 📄 Offer letter ✓ Due diligence
Listing remarks
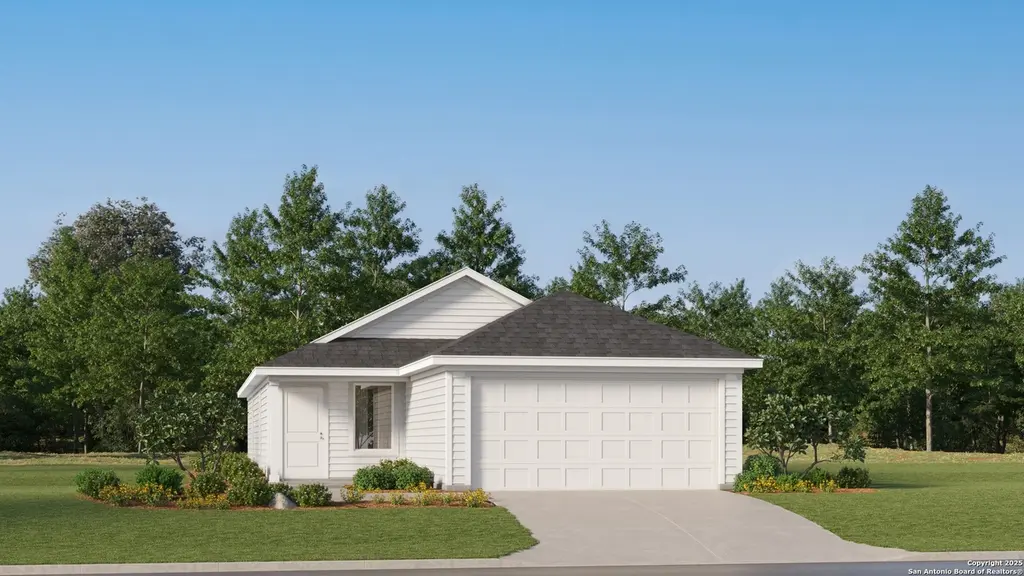
The Idlewood - This single-level home showcases a spacious open floorplan shared between the kitchen, dining area and family room for easy entertaining, along with access to an outdoor space. An owner's suite enjoys a private location in a rear corner of the home, complemented by an en-suite bathroom and walk-in closet. There are two secondary bedrooms at the front of the home, ideal for household members and overnight guests. Estimated Completion July 2026. The completion date, prices and features may vary and are subject to change. Please verify with Lennar directly. Photos are for illustrative purposes only.
Key facts
- Walk-in closet
- Open floorplan
- Outdoor space
Tags
Property features AI
Finance
- HOA & community: Mandatory HOA; Quarterly HOA fee ($225); Association transfer fee ($450); Community amenities include pool and park/playground
Exterior
- Parking: 2-car garage
- Utilities: Water service: GVSUD; Sewer service: GVSUD; Gas supplier: CenterPoint; Electric supplier: GVEC; Garbage service: Frontier
- Home design: New construction by Lennar; Cement fiber exterior; Slab foundation; Composition roof
- Construction: Built in 2026 (new)
- Exterior features: Privacy fence
Interior
- Kitchen: Stove/Range; Dishwasher
- Bedrooms: Master bedroom on lower level with full bath (14 x 15); Bedroom 2 (11 x 12); Bedroom 3 (11 x 12)
- Flooring: Carpeting; Vinyl flooring
- Bathrooms: 2 full bathrooms; Master bath with tub/shower combination (8 x 6)
- Heating & cooling: Central heating; Electric and natural gas heat; Central air conditioning
- Interior features: Open floor plan; Breakfast bar; Cable TV available; 1 living area; Utility room inside; Laundry on main level
- Laundry & utility: Washer connection; Dryer connection
Neighborhood map
What this means for you Summary
Snapshot
- This is a 3-bed/2.0-bath single-family listed at $211k. Condition is rated excellent.
Deal economics
- At list price, monthly cash flow is $-304 ($-4k/yr) — negative.
- To cash-flow at today's rent, offer at most $167k (20.9% below list).
- To meet the 1% rule (rent ≥ 1% of price), the offer needs to be $156k (26.3% below list).
- Recommended offer: $156k (26.3% below list) — sets the bar for 1% rule.
Location & tenants
- Location reads 66/100 on livability (#614 in TX) — a middle-class / working-renter tenant base. Strengths: crime A+, cost of living A+, housing A+; Watch: amenities F, commute F, health & safety F.
- Marion ISD (suburban): math 44% / reading 47% proficiency, ranked #243 of 826 in TX (top 29%) — families likely to look elsewhere, expect single-tenant / working-renter base with shorter leases.
- Zoned schools: Norma Krueger El (362 students, 50% FRL); Marion Middle (math 37% / reading 45%, grade F, #613 of 1,662 statewide, top 38%, 372 students, 41% FRL); Marion H S (math 47% / reading 62%, grade C-, #379 of 1,632 statewide, top 26%, 456 students, 36% FRL) — zoned schools at 42% FRL track the district average.
- Market conditions: 418 active listings in the ZIP; 2 comparable units currently listed for rent nearby; 2,064 units permitted in Guadalupe County in 2024 (133 in 5+ unit buildings).
Forward outlook
- Local home prices are declining (-3.0%/yr); year-one equity from $1k of loan paydown is wiped out by about $6k of value loss. Plan a longer hold.
- Guadalupe County population projected at +61% by 2050 — long-run rental-demand tailwind backs the buy-and-hold thesis.
Negotiation context
- It's been on market 41 days — a 3% lower offer ($205k) is reasonable based on typical stale-listing flexibility.
Questions for the listing agent
- What do current leases actually rent for vs. the listed asking? Can we see a recent rent roll and the last 12 months of T-12 income?
- It's been on market 41 days. Have you received any prior offers? Is the seller open to a 26% concession, seller financing, or rate buy-down credit?
- What does the HOA fee cover, when was the last increase, and are there any pending special assessments or reserve-fund shortfalls?
- Is there a deadline driving the sale (1031 exchange, divorce, estate, relocation)? That informs how much negotiation room exists.
- The area grade is low — what's the realistic commute time and amenity access for the typical tenant pool here? Any planned neighborhood developments (good or bad) we should know about?
- What's the average days-on-market for RENTAL listings here right now (not sales)? A rising rental-DOM trend means longer vacancies and softer asking-rent achievability than the comps imply.
- What's the recent tenant-quality profile in this submarket — average credit score on applications, eviction rate, late-payment / NSF rate, and stable-employment percentage? A property-management company in the area should have these aggregated.
- How much new for-sale + rental construction is in the pipeline within 1–3 miles? Heavy new supply typically softens prices + rents 12–24 months out; constrained supply supports both.
Investment metrics
- 1% rule
- 0.74% ✗
- Cap rate
- 4.56%
- Cash-on-cash
- -6.18%
- DSCR
- 0.73
- GRM
- 11.3
CMA / ARV
- ARV (median comp)
- $258,438
- List price
- $210,999
- Delta
- -18.36%
- Verdict
- UNDERPRICED
- Comps
- 20 within 1.0 mi
Show comp detail 12 sales within ~0.75 mi
| Address | Dist | Beds/Ba | Sqft | Sold | Price | $/sf | Match |
|---|---|---|---|---|---|---|---|
| 2760 Pioneer Rd | 0.00mi | 3/2.0 | 1,474 (+4%) | 1mo | $250,000 | $170 | 92 |
| 713 Thea Mdws | 0.46mi | 3/2.0 | 1,402 (-1%) | 1mo | $230,999 | $165 | 76 |
| 701 Thea Mdws | 0.00mi | 4/2.0 (+1) | 1,575 (+12%) | 1mo | $240,999 | $153 | 75 |
| 175 Lost Maples Way | 0.57mi | 3/2.0 | 1,407 (-0%) | 2mo | $289,900 | $206 | 72 |
| 721 Thea Mdws | 0.46mi | 4/2.0 (+1) | 1,575 (+12%) | 2mo | $223,999 | $142 | 52 |
| 305 Gadwall Ave | 0.46mi | 4/2.0 (+1) | 1,575 (+12%) | 3mo | $245,999 | $156 | 52 |
| 743 Thea Mdws | 0.46mi | 4/2.0 (+1) | 1,575 (+12%) | 3mo | $222,999 | $142 | 52 |
| 314 Gadwall Ave | 0.46mi | 4/2.0 (+1) | 1,575 (+12%) | 3mo | $225,999 | $143 | 51 |
| 705 Thea Mdws | 0.46mi | 4/2.0 (+1) | 1,600 (+13%) | 1mo | $219,999 | $137 | 50 |
| 746 Thea Mdws | 0.46mi | 4/2.0 (+1) | 1,600 (+13%) | 1mo | $219,999 | $137 | 50 |
| 179 Lost Maples Way | 0.57mi | 3/2.0 | 1,594 (+13%) | 2mo | $314,000 | $197 | 50 |
| 301 Gadwall Ave | 0.46mi | 4/2.0 (+1) | 1,600 (+13%) | 3mo | $228,999 | $143 | 49 |
Match score weights: distance 35% · size 25% · config 20% · recency 20%. Top-matched comps best support the ARV.
Projected returns pro-forma
-3.0% appreciation · 3.0% rent growth · sell at horizon
- IRR
- -26.9%
- Equity multiple
- 0.09×
- Total profit
- $-53,490
- Equity at exit
- $31,461
- IRR
- -24.3%
- Equity multiple
- -0.21×
- Total profit
- $-71,235
- Equity at exit
- $18,243
Cash invested: $59,080 (down + closing). Projections, not guarantees.
Landlord ↔ Tenant lean methodology
- Overall (STATE)
- 87 Strongly Landlord-Friendly
- State Texas
- 87 Strongly Landlord-Friendly · R+5
- County
- — inherits STATE
- City
- — inherits STATE
ZIP-level market 78124
- Active inventory
- 418
- Price-to-rent
- 11.3×
Monthly cashflow live
- Estimated rent
- $1,556 medium interval (Pro) →
- Mortgage (P&I)
- −$1,107
- Tax est. 1.5%
- −$264 /mo · $3,165/yr
- Insurance
- −$88
- HOA
- −$75
- Vacancy / Maint / Mgmt
- −$327
- Net cashflow
- $-304
Break-even live
Sensitivity live
| Price | -10% $-158 | -5% $-231 | +0% $-304 | +5% $-377 | +10% $-450 |
|---|---|---|---|---|---|
| Rent | -10% $-427 | -5% $-366 | +0% $-304 | +5% $-243 | +10% $-181 |
| Rate | -1.0pp $-198 | -0.5pp $-250 | base $-304 | +0.5pp $-359 | +1.0pp $-414 |
UW: 25.0% down · 7.5% · 30yr · 1.5% tax · 5.0% vac · 8.0% maint · 8.0% mgmt
Financing live
Cash to close
- Down payment
- $52,750
- Closing costs
- $6,330
- Reserves months
- —
- Total cash needed
- —
Loan-product check · same deal, 3 products live
Conventional
25% down · 7.5% · 30yr
- Down + closing
- —
- Monthly P&I
- —
- Monthly cashflow
- —
- DSCR
- —
- Eligible?
- —
Personal DTI + credit; lowest rate.
DSCR
20% down · 8.5% · 30yr
- Down + closing
- —
- Monthly P&I
- —
- Monthly cashflow
- —
- DSCR
- —
- Eligible?
- —
No personal income docs; deal must DSCR.
Hard money
10% down · 12.0% · 12mo
- Down + closing
- —
- Monthly P&I
- —
- Monthly cashflow
- —
- DSCR
- —
- Eligible?
- —
Short-term bridge; refi at stabilization.
Rent comps 2 comps
| Address | Beds | Baths | Sqft | Rent | $/sqft | DOM | Units | Dist |
|---|---|---|---|---|---|---|---|---|
| 205 W Schulz St Marion, TX | 3.0 | 1.5 | 1109 | $1,695 | $1.53 | 6d | 1 | 0.08mi |
| 217 E Schulz St Marion, TX | 3.0 | 2.0 | 924 | $1,050 | $1.14 | 0d | 1 | 0.30mi |
HOA detail
- Monthly dues
- $75 · $900/yr
Listing history 4 events
-
2026-06-01status $210,999 Pending 41 DOM
-
2026-05-31statusdays on market $210,999 Active 41 DOM
-
2026-05-08price $212,999 618-char remark
-
2026-04-20$232,999 New 618-char remark
ⓘ Source: listings_history table (triggers on properties + properties_extension) + one-shot
backfill from property_details.listing_events for pre-trigger history.
Nearby sold comps map
Loading sold comps map…
Walkable amenities ~0.75 mi
Loading nearby amenities…
Taxation est. · year 1
- Rental income
- $18,669
- − Mortgage interest
- −$11,819
- − Property taxes
- −$3,165
- − Insurance
- −$1,055
- − Repairs & maintenance
- −$1,494
- − Management
- −$1,494
- − HOA
- −$900
- − Depreciation
- −$6,138
- Taxable loss
- −$7,395
- Est. tax savings @ 24.0%
- +$1,775
- After-tax cash flow
- $-1,874/yr
For passive investors: Depreciation is non-cash, so a rental often shows a tax loss while cash-flowing — sheltering income. Rental losses are passive: they offset passive income freely, and up to $25,000/yr can offset ordinary (W-2) income if you actively participate and your MAGI is under $100k (phasing out to $0 by $150k); unused losses carry forward. On sale, claimed depreciation is recaptured at up to 25%, and gains may owe capital-gains tax (a 1031 exchange can defer both). Figures are a year-1 estimate at your 24.0% rate — not tax advice; consult a CPA.
Condition & rehab AI · 2 photos
This single-family home is in excellent condition with no visible repairs or maintenance needed. It offers a spacious floorplan and is move-in ready, making it an attractive option for both resale and rental markets.
Value-add opportunities
- Both Painting exterior and interior — Enhances curb appeal and interior aesthetics
- Both Landscaping improvements — Enhances curb appeal and adds value
- Both New flooring in high-traffic areas — Improves appearance and reduces maintenance
- Both New kitchen appliances — Modernizes the space and adds value
- Both New bathroom fixtures — Enhances functionality and adds value
Renovation cost estimate screening
Value-add ROI direction
- Both Painting exterior and interior — Enhances curb appeal and interior aesthetics ↑
- Both Landscaping improvements — Enhances curb appeal and adds value ↑
- Both New flooring in high-traffic areas — Improves appearance and reduces maintenance ↑
- Both New kitchen appliances — Modernizes the space and adds value ↑
- Both New bathroom fixtures — Enhances functionality and adds value ↑
ⓘ Cost ranges are severity-bucket heuristics (US national rule-of-thumb). Get contractor quotes + a written scope before underwriting a rehab budget.
Schools (NCES district)
- District
- Marion ISD
- NCES district ID
- 4829100
- Math proficiency
- 44% ▼ -10.00%
- Reading proficiency
- 47% ▼ -4.00%
- Median HH income
- $58,465
- Composite
- 39.86/100
- National rank
- #3867
- State rank
- #243 of 826 in TX
Livability — Marion
- Score
- 66/100
- State rank
- #614
- US rank
- #11619
Category grades
Schools grade is shown separately in the Schools card above.
Census & demographics
- Census place
- Marion, TX
- Population (ZIP)
- 6,907
Population outlook (Guadalupe County) Hauer SSP2
- Today (2025)
- 196,854 people
- By 2030
- 220,210 · +11.9%
- By 2040
- 268,004 · +36.1%
- By 2050
- 316,333 · +60.7%
- By 2075
- 434,747 · +120.8%
- By 2100
- 520,447 · +164.4%
Race, ethnicity, and origin ACS 2023
- Neighborhood character
- Diverse neighborhood (Simpson 0.61)
- Race & ethnicity
- White 49% Hispanic / Latino 38% Two or more races 24% Black 6% Asian 2%
- Hispanic origin (detail)
- Mexican 35% Puerto Rican 1%
- Common ancestry
- Slovak 3% Romanian 2% Iranian 1%
- Foreign-born
- 7% · Canada, Jamaica
- Languages at home
- 80% English-only · Spanish 18% Tagalog/Filipino 1%
Political lean MEDSL · Guadalupe
- 2024 margin
- Strong R (+29.5) · D 34.8% · R 64.3%
- 2008→2024 swing
- +1.5pp toward D · 2008: -31.0pp · 2024: -29.5pp
- All cycles
- 2024: R+29.5 2020: R+24.2 2016: R+31.8 2012: R+35.1 2008: R+31.0
Not yet ingested
- Civics
- —
Market trends
- HPI YoY
- ▼ -126.83%
- Current HPI
- 189.5796
- Rent YoY
- —
- Metro
- —
- State GDP YoY
- ▲ 3.95%
- F500 in state
- 110
Industry mix (Fortune 500 HQ in TX)
| Industry | F500 HQs | Revenue |
|---|---|---|
| Energy | 16 | $1,198B |
|
||
| Technology | 5 | $198B |
|
||
| Engineering / Construction | 4 | $72B |
|
||
| Energy Services | 3 | $60B |
|
||
| Utilities | 3 | $41B |
|
||
| Healthcare | 2 | $330B |
|
||
Price history
-9.4% since first listed4 events — show timeline
- 2026-05-31 Pending — LERA
- 2026-05-21 Price Changed $210,999 LERA
- 2026-05-08 Price Changed $212,999 LERA
- 2026-04-20 Listed $232,999 LERA
Cash-flow waterfall
monthlySold comps — $/sqft
last 12 mo · ≤1 miLoading sold comps…