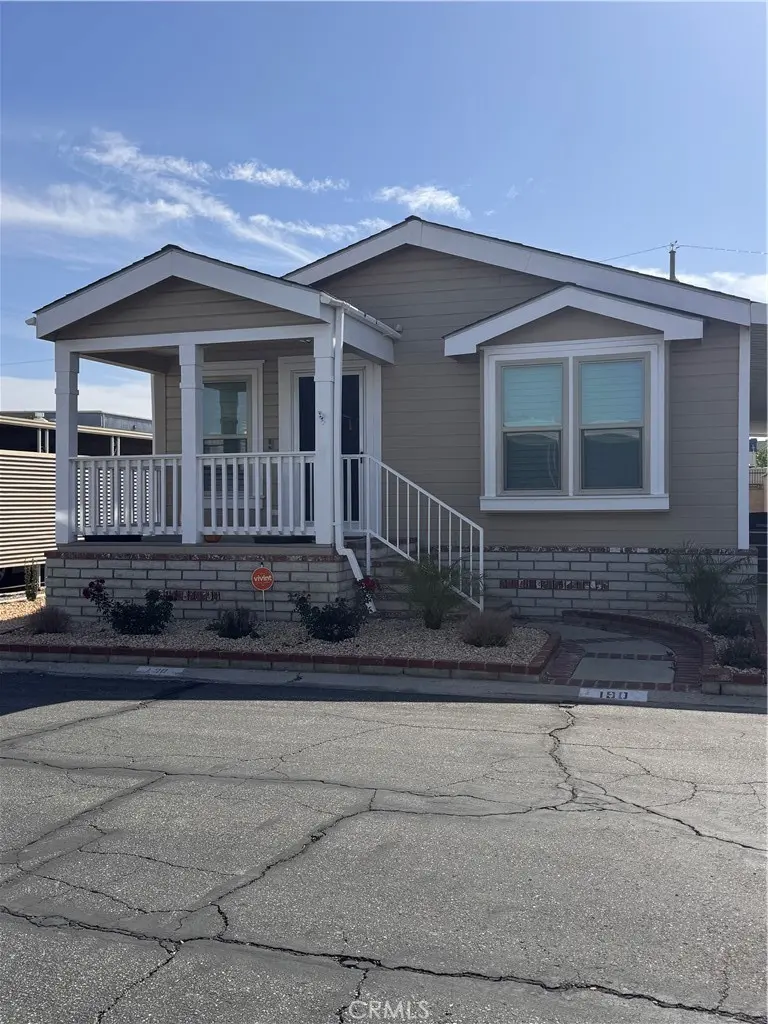
2205 W Acacia #190 · Hemet, CA
Flood risk 1/10 · Minimal
- FEMA flood zone
- X (unshaded)
- Chance of flooding over 30 yrs
- 0.0%
- Est. flood insurance / yr
- $507 – $1,088
Fire risk 6/10 · Moderate
- Est. fire insurance / yr
- $659 – $1,223
Heat risk 7/10 · Major
- Hot days now (above 104°F)
- 6 days/yr
- Hot days in 30 yrs
- 19 days/yr
Wind risk 1/10 · Minimal
- Chance of severe wind over 30 yrs
- —
Air-quality risk 6/10 · Moderate
- Unhealthy air days now
- 9 days/yr
- Unhealthy air days in 30 yrs
- 11 days/yr
Risk factors via First Street. Map © Google.
Why this score? — see what drove the C grade
The composite is a weighted blend of 9 inputs, each scored 0–100. Each bar is that input's sub-score; the figure is the points it added to the 100-point composite (weight × sub-score).
- Cash flow +26.0/30.0
- DSCR +8.7/10.0
- ARV discount +7.5/15.0
- 1% rule +5.6/10.0
- Rent growth +3.4/5.0
- Livability +2.6/5.0
- Schools +2.5/10.0
- Condition / age +2.5/5.0
- Appreciation +0.0/10.0
$189,000
🖨 Deal sheet 📄 Offer letter ✓ Due diligence
Listing remarks
COMPLETELY UPDATED AND MOVE-IN READY! This beautifully renovated home offers the perfect blend of comfort, style, and affordability. From the moment you arrive, you’ll appreciate the pride of ownership and extensive upgrades that make this home truly stand out. Step inside to discover a bright and inviting interior featuring brand-new flooring, fresh paint throughout, and elegant shutters that add both charm and functionality. The spacious layout is filled with natural light thanks to the brand-new energy-efficient windows, creating a warm and welcoming atmosphere. The updated kitchen is ready for its new owner and comes complete with all new appliances, making meal preparation a bree
Key facts
- Community pool
- Built 2004
- Listed 48 days
Property features AI
Finance
- Financial info: Land lease of $1,200
- HOA & community: Part of an association; Located in Villa Del Sol park; Community features include curbs
Exterior
- Parking: Carport; Driveway
- Utilities: Public water (district); Public sewer; Standard electric service; Natural gas available; Electricity available; Water available
- Home design: Single-story mobile home (24' x 60'); Mobile home remains; Has a view
- Construction: Shingle roof; Single-story structure
- Exterior features: Front porch; Community pool; No fencing
Interior
- Kitchen: Refrigerator; Gas range; Dishwasher; Quartz countertops
- Flooring: Laminate flooring
- Bathrooms: Two full bathrooms
- Heating & cooling: Central air conditioning; Central furnace; Fireplace
- Interior features: One-level entry with front door entry; Community spa; Entry located at front door
- Laundry & utility: Dedicated laundry room
Neighborhood map
What this means for you Summary
Snapshot
- This is a 2-bed/2.0-bath manufactured listed at $189k.
Deal economics
- At list price, monthly cash flow is $469 ($6k/yr) — positive.
- The deal already cash-flows at list — no discount required.
- Meets the 1% rule at list price ($2k rent vs $189k).
- Recommended offer: $183k (3.0% below list) — sets the bar for market timing.
- Cap rate 9.3% vs local median 4.9% in Hemet — top-decile yield for the area; either an underpriced asset or a hidden risk that comps aren't pricing in. Stress-test before assuming the spread holds.
Location & tenants
- Location reads 51/100 on livability (#1,056 in CA) — a working-class tenant base; expect higher turnover. Strengths: housing A+; Watch: crime D+, schools F, amenities F.
- Hemet Unified (suburban): math 19% / reading 41% proficiency, ranked #360 of 517 in CA (top 70%) — families likely to look elsewhere, expect single-tenant / working-renter base with shorter leases; 66% free/reduced lunch — lower-income household profile, screen leases tightly.
- Market conditions: Rents rising (+3.7%/yr); 290 active listings in the ZIP; 40 comparable units currently listed for rent nearby; rentals at typical pace (median 24d on market — plan ~3-4 weeks tenant-placement turnaround); 9,195 units permitted in Riverside County in 2024 (1,512 in 5+ unit buildings).
- This rent runs 38% of the median local income ($64k/yr) — at the standard rent-burdened threshold; future hikes will face affordability resistance.
Forward outlook
- Local home prices are declining (-3.0%/yr); year-one equity from $1k of loan paydown is wiped out by about $6k of value loss. Plan a longer hold.
- Riverside County population projected at +22% by 2050 — long-run rental-demand tailwind backs the buy-and-hold thesis.
- At projected returns (-3.0% appreciation + 3.7% rent growth), your $53k cash investment doubles in ~10 years — after that, you're playing with house money.
Negotiation context
- It's been on market 48 days — a 3% lower offer ($183k) is reasonable based on typical stale-listing flexibility.
Risks & watch-outs
- Climate carrying-cost: major wildfire risk; extreme-heat days projected 6→19/yr by 2055 (HVAC capex compounding) — expect insurance premiums to compound above CPI over the hold.
Questions for the listing agent
- It's been on market 48 days. Have you received any prior offers? Is the seller open to a 3% concession, seller financing, or rate buy-down credit?
- Is there a deadline driving the sale (1031 exchange, divorce, estate, relocation)? That informs how much negotiation room exists.
- Schools are F-rated, which usually means shorter tenancies and higher turnover. Who's the typical renter profile here, and what's been the actual vacancy rate?
- Crime grade is D in this area — have there been break-ins, vandalism, or insurance claims at this property in the last 3 years? What carrier currently insures it and at what premium?
- What's the average days-on-market for RENTAL listings here right now (not sales)? A rising rental-DOM trend means longer vacancies and softer asking-rent achievability than the comps imply.
- What's the recent tenant-quality profile in this submarket — average credit score on applications, eviction rate, late-payment / NSF rate, and stable-employment percentage? A property-management company in the area should have these aggregated.
- How much new for-sale + rental construction is in the pipeline within 1–3 miles? Heavy new supply typically softens prices + rents 12–24 months out; constrained supply supports both.
Investment metrics
- 1% rule
- 1.06% ✓
- Cap rate
- 9.27%
- Cash-on-cash
- 10.65%
- DSCR
- 1.47
- GRM
- 7.8
CMA / ARV
- ARV (median comp)
- $124,000
- List price
- $189,000
- Delta
- 52.42%
- Verdict
- OVERPRICED
- Comps
- 20 within 1.0 mi
Show comp detail 12 sales within ~0.75 mi
| Address | Dist | Beds/Ba | Sqft | Sold | Price | $/sf | Match |
|---|---|---|---|---|---|---|---|
| 2205 acacia #62 | 0.03mi | 2/2.0 | 1,400 (-3%) | 1mo | $73,000 | $52 | 93 |
| 575 S Lyon Ave #34 | 0.30mi | 2/2.0 | 1,440 (0%) | 1mo | $62,900 | $44 | 85 |
| 2205 W Acacia Ave #6 | 0.00mi | 3/2.0 (+1) | 1,250 (-13%) | 2mo | $130,000 | $104 | 71 |
| 1445-#88 W Florida | 0.61mi | 3/2.0 (+1) | 1,440 (0%) | 1mo | $124,000 | $86 | 66 |
| 1655 Vista Grande Dr | 0.74mi | 2/2.0 | 1,440 (0%) | 1mo | $158,000 | $110 | 64 |
| 853 SANTA TERESA Way | 0.55mi | 2/2.0 | 1,368 (-5%) | 2mo | $151,000 | $110 | 64 |
| 180 Santa Paula | 0.63mi | 2/2.0 | 1,368 (-5%) | 2mo | $139,000 | $102 | 60 |
| 1895 W Devonshire #20 | 0.63mi | 2/2.0 | 1,344 (-7%) | 1mo | $44,000 | $33 | 59 |
| 1760 Santiago | 0.43mi | 2/2.0 | 1,248 (-13%) | 0mo | $118,000 | $95 | 58 |
| 942 Santa Elena | 0.72mi | 2/1.5 | 1,503 (+4%) | 0mo | $144,000 | $96 | 56 |
| 1895 W Devonshire Ave #74 | 0.63mi | 3/2.0 (+1) | 1,344 (-7%) | 2mo | $80,000 | $60 | 53 |
| 1730 San Marcos | 0.75mi | 2/2.0 | 1,344 (-7%) | 3mo | $135,000 | $100 | 52 |
Match score weights: distance 35% · size 25% · config 20% · recency 20%. Top-matched comps best support the ARV.
Projected returns pro-forma
-3.0% appreciation · 3.74% rent growth · sell at horizon
- IRR
- 0.3%
- Equity multiple
- 1.01×
- Total profit
- $694
- Equity at exit
- $28,181
- IRR
- 10.6%
- Equity multiple
- 1.85×
- Total profit
- $45,023
- Equity at exit
- $16,341
Cash invested: $52,920 (down + closing). Projections, not guarantees.
Landlord ↔ Tenant lean methodology
- Overall (STATE)
- 18 Strongly Tenant-Friendly
- State California
- 18 Strongly Tenant-Friendly · D+13
- County
- — inherits STATE
- City
- — inherits STATE
ZIP-level market 92545
- Home prices YoY
- -24.6%
- Rents YoY
- 3.7%
- Active inventory
- 290
- Price-to-rent
- 7.8×
Monthly cashflow live
- Estimated rent
- $2,006 high interval (Pro) →
- Mortgage (P&I)
- −$991
- Tax from tax record
- −$46 /mo · $549/yr
- Insurance
- −$79
- HOA
- −$0
- Vacancy / Maint / Mgmt
- −$421
- Net cashflow
- $469
Break-even live
UW: 25.0% down · 7.5% · 30yr · 1.5% tax · 5.0% vac · 8.0% maint · 8.0% mgmt
Financing live
Cash to close
- Down payment
- $47,250
- Closing costs
- $5,670
- Reserves months
- —
- Total cash needed
- —
Loan-product check · same deal, 3 products live
Conventional
25% down · 7.5% · 30yr
- Down + closing
- —
- Monthly P&I
- —
- Monthly cashflow
- —
- DSCR
- —
- Eligible?
- —
Personal DTI + credit; lowest rate.
DSCR
20% down · 8.5% · 30yr
- Down + closing
- —
- Monthly P&I
- —
- Monthly cashflow
- —
- DSCR
- —
- Eligible?
- —
No personal income docs; deal must DSCR.
Hard money
10% down · 12.0% · 12mo
- Down + closing
- —
- Monthly P&I
- —
- Monthly cashflow
- —
- DSCR
- —
- Eligible?
- —
Short-term bridge; refi at stabilization.
Rent comps 40 comps
| Address | Beds | Baths | Sqft | Rent | $/sqft | DOM | Units | Dist |
|---|---|---|---|---|---|---|---|---|
| 2403 W Acacia Ave Hemet, CA | 2.0 | 2.0 | 910 | $1,995 | $2.19 | 7d | 1 | 0.20mi |
| 2469 W Acacia Ave Hemet, CA | 2.0 | 2.0 | 910 | $1,750 | $1.92 | 24d | 1 | 0.21mi |
| 2098 W Acacia Ave Hemet, CA | 1.0–3.0 | 1.0–2.0 | 895 | $2,035 | $2.27 | 1d | 1 | 0.24mi |
| 683 Jonquil St Hemet, CA | 3.0 | 2.0 | 1150 | $2,448 | $2.13 | 24d | 1 | 0.30mi |
| 471 Whitney Dr Hemet, CA | 2.0 | 2.0 | 1085 | $1,800 | $1.66 | 5d | 1 | 0.36mi |
| 1850 Amberwood Dr Hemet, CA | 2.0 | 2.0 | 1170 | $1,561 | $1.33 | 43d | 1 | 0.39mi |
| 1461 W Mayberry Ave Hemet, CA | 2.0 | 2.0 | 1044 | $1,750 | $1.68 | 43d | 1 | 0.48mi |
| 3030 W Acacia Ave Hemet, CA | 1.0–3.0 | 1.0–2.0 | 892 | $1,895 | $2.12 | 1d | 10 | 0.52mi |
| 1521 W Westmont Ave Hemet, CA | 2.0 | 2.0 | 1197 | $2,000 | $1.67 | 43d | 1 | 0.54mi |
| 1241 Sandlewood Dr Hemet, CA | 2.0 | 1.5 | 1504 | $2,000 | $1.33 | 43d | 1 | 0.67mi |
| 2971 Pembroke Ave Hemet, CA | 3.0 | 2.0 | 1572 | $3,000 | $1.91 | 18d | 1 | 0.68mi |
| 101 San Mateo Cir Hemet, CA | 2.0 | 2.0 | 1152 | $1,725 | $1.50 | 16d | 1 | 0.68mi |
| 120 Santa Lucia Dr Hemet, CA | 2.0 | 2.0 | 1197 | $1,600 | $1.34 | 43d | 1 | 0.69mi |
| 611 S Palm Ave Unit K Hemet, CA | 2.0 | 2.0 | 1254 | $1,895 | $1.51 | 7d | 1 | 0.78mi |
| 1315 W Latham Ave Hemet, CA | 3.0 | 2.5 | 1340 | $2,550 | $1.90 | 43d | 1 | 0.78mi |
| 2770 W Devonshire Ave Hemet, CA | 1.0–2.0 | 1.0–2.0 | 707 | $1,945 | $2.75 | 1d | 11 | 0.86mi |
| 250 N Elk St Hemet, CA | 2.0 | 1.0 | 900 | $1,625 | $1.81 | 13d | 1 | 0.88mi |
| 471 S Simpson Ave Unit D Hemet, CA | 2.0 | 2.0 | 900 | $1,750 | $1.94 | 43d | 1 | 0.89mi |
| 876 W Whittier Ave Unit 878 Hemet, CA | 2.0 | 2.0 | 1127 | $2,150 | $1.91 | 24d | 1 | 0.91mi |
| 1955 Silver Oak Way Hemet, CA | 3.0 | 2.0 | 1318 | $2,250 | $1.71 | 43d | 1 | 0.94mi |
| 415 S Tahquitz Ave Hemet, CA | 3.0 | 2.0 | 1766 | $2,900 | $1.64 | 18d | 1 | 0.94mi |
| 1862 Pueblo Dr Hemet, CA | 2.0 | 2.0 | 977 | $1,900 | $1.94 | 43d | 1 | 0.95mi |
| 1862 Pueblo Dr Unit 1862 Hemet, CA | 2.0 | 2.0 | 977 | $1,750 | $1.79 | 24d | 1 | 0.95mi |
| 1964 W Oakland Ave Hemet, CA | 2.0 | 2.0 | 977 | $1,695 | $1.73 | 17d | 1 | 0.98mi |
| 1270 Rosalia Ave Unit 1 Hemet, CA | 2.0 | 1.0 | 900 | $1,800 | $2.00 | 43d | 1 | 1.04mi |
| 627 Solano Dr Hemet, CA | 2.0 | 2.0 | 882 | $1,800 | $2.04 | 18d | 1 | 1.07mi |
| 363 S Gilbert St Hemet, CA | 3.0 | 2.0 | 1200 | $1,900 | $1.58 | 3d | 1 | 1.08mi |
| 363 S Gilbert St Unit B Hemet, CA | 3.0 | 2.0 | 1200 | $1,900 | $1.58 | 13d | 1 | 1.08mi |
| 446 N Elk St Unit D Hemet, CA | 2.0 | 1.0 | 980 | $1,675 | $1.71 | 24d | 1 | 1.08mi |
| 543 La Cresta Dr Hemet, CA | 2.0 | 2.0 | 1544 | $1,595 | $1.03 | 43d | 1 | 1.09mi |
| 424 W Mayberry Ave Unit 1 Hemet, CA | 1.0 | 1.0 | 1664 | $850 | $0.51 | 7d | 1 | 1.12mi |
| 735 S Gilbert St Hemet, CA | 3.0 | 2.0 | 1202 | $2,400 | $2.00 | 43d | 1 | 1.14mi |
| 1354 Jasmine Way Hemet, CA | 2.0 | 2.0 | 1440 | $1,650 | $1.15 | 43d | 1 | 1.19mi |
| 663 Mariposa Dr Hemet, CA | 2.0 | 2.0 | 1440 | $1,500 | $1.04 | 24d | 1 | 1.22mi |
| 3800 W Devonshire Ave Hemet, CA | 3.0 | 1.0–2.0 | 816 | $2,055 | $2.52 | 1d | 8 | 1.23mi |
| 1005 S Gilbert St Hemet, CA | 2.0 | 1.5 | 975 | $1,825 | $1.87 | 24d | 2 | 1.24mi |
| 716 Robert Dr Hemet, CA | 3.0 | 2.0 | 1450 | $2,300 | $1.59 | 5d | 1 | 1.25mi |
| 1025 S Gilbert St Hemet, CA | 1.0–2.0 | 1.0–2.0 | 890 | $2,320 | $2.61 | 1d | 8 | 1.26mi |
| 3471 Dublin Ct Hemet, CA | 3.0 | 2.0 | 1276 | $2,895 | $2.27 | 3d | 1 | 1.26mi |
| 1700 Walden Ln Hemet, CA | 3.0 | 2.0 | 1430 | $2,670 | $1.87 | 24d | 1 | 1.35mi |
Listing history 17 events
-
2026-06-18days on market $189,000 Active 48 DOM
-
2026-06-17days on market $189,000 Active 47 DOM
-
2026-06-16remarks 693-char remark
-
2026-06-16days on market $189,000 Active 46 DOM
-
2026-06-15days on market $189,000 Active 45 DOM
-
2026-06-13days on market $189,000 Active 43 DOM
-
2026-06-09days on market $189,000 Active 39 DOM
-
2026-06-08days on market $189,000 Active 38 DOM
-
2026-06-07days on market $189,000 Active 37 DOM
-
2026-06-04days on market $189,000 Active 34 DOM
-
2026-06-03days on market $189,000 Active 33 DOM
-
2026-06-02days on market $189,000 Active 32 DOM
-
2026-06-02price $189,000 Active 31 DOM
-
2026-06-01days on market $195,000 Active 31 DOM
-
2026-05-31days on market $195,000 Active 30 DOM
-
2026-05-01$202,000 Active 917-char remark
-
2026-04-25historical $202,000 917-char remark
ⓘ Source: listings_history table (triggers on properties + properties_extension) + one-shot
backfill from property_details.listing_events for pre-trigger history.
Tax reassessment forecast CA · Resets to sale price
- Current annual tax
- $549 · $46/mo
- Projected year-2 tax
- $1,436 · $120/mo
- Expected delta
- +$887/yr (+$74/mo · 161.5%)
ⓘ Screening estimate from a state-policy table — verify with the county assessor before closing.
Climate risk First Street
- Flood 1/10 Low FEMA zone X (unshaded) · 0% chance over 30 yrs
- Wildfire 6/10 Major
- Heat 7/10 Severe 6 d/yr ≥104°F today · 19 d/yr by 30 yrs out
- Wind 1/10 Low
- Air quality 6/10 Major 9 unhealthy d/yr today · 11 by 30 yrs out
Nearby sold comps map
Loading sold comps map…
Walkable amenities ~0.75 mi
Loading nearby amenities…
Taxation est. · year 1
- Rental income
- $24,078
- − Mortgage interest
- −$10,587
- − Property taxes
- −$549
- − Insurance
- −$945
- − Repairs & maintenance
- −$1,926
- − Management
- −$1,926
- − Depreciation
- −$5,498
- Taxable income
- $2,646
- Est. tax owed @ 24.0%
- −$635
- After-tax cash flow
- $4,999/yr
For passive investors: Depreciation is non-cash, so a rental often shows a tax loss while cash-flowing — sheltering income. Rental losses are passive: they offset passive income freely, and up to $25,000/yr can offset ordinary (W-2) income if you actively participate and your MAGI is under $100k (phasing out to $0 by $150k); unused losses carry forward. On sale, claimed depreciation is recaptured at up to 25%, and gains may owe capital-gains tax (a 1031 exchange can defer both). Figures are a year-1 estimate at your 24.0% rate — not tax advice; consult a CPA.
Schools (NCES district)
- District
- Hemet Unified
- NCES district ID
- 0616920
- Math proficiency
- 19% ▼ -3.00%
- Reading proficiency
- 41% ▲ 4.00%
- Median HH income
- $39,962
- Composite
- 25.16/100
- National rank
- #7517
- State rank
- #360 of 517 in CA
Livability — Hemet
- Score
- 51/100
- State rank
- #1056
- US rank
- #25208
Category grades
Schools grade is shown separately in the Schools card above.
Census & demographics
- Census place
- Hemet, CA
- County
- Riverside County · 2,287,001 people
- City population
- 137,670
- Metro
- Riverside-San Bernardino-Ontario, CA
- Population (ZIP)
- 45,982
- Household income
- $63,770
- Rent vs Own
- Severe rent burden
- 1813.0
Population outlook (Riverside County) Hauer SSP2
- Today (2025)
- 2,664,475 people
- By 2030
- 2,802,692 · +5.2%
- By 2040
- 3,050,904 · +14.5%
- By 2050
- 3,256,783 · +22.2%
- By 2075
- 3,655,058 · +37.2%
- By 2100
- 3,766,594 · +41.4%
Race, ethnicity, and origin ACS 2023
- Neighborhood character
- Diverse neighborhood (Simpson 0.65)
- Race & ethnicity
- Hispanic / Latino 46% White 35% Two or more races 17% Black 8% Asian 5% Native American 1%
- Hispanic origin (detail)
- Mexican 40%
- Common ancestry
- Slovak 2% Lithuanian 2% Portuguese 1%
- Foreign-born
- 19% · Canada, Vietnam, Jamaica
- Languages at home
- 69% English-only · Spanish 27% Tagalog/Filipino 1% Other Indo-European 1%
Political lean MEDSL · Riverside
- 2024 margin
- Toss-up / Even · D 48.0% · R 49.3% · Other 2.6%
- 2008→2024 swing
- -3.6pp toward R · 2008: 2.3pp · 2024: -1.3pp
- All cycles
- 2024: R+1.3 2020: D+8.0 2016: D+4.3 2012: R+0.4 2008: D+2.3
Not yet ingested
- Civics
- —
Market trends
- HPI YoY
- ▼ -116.25%
- Current HPI
- 356.9414
- Rent YoY
- ▲ 3.74%
- Metro
- Riverside-San Bernardino-Ontario, CA
- State GDP YoY
- ▲ 3.21%
- F500 in state
- 116
Industry mix (Fortune 500 HQ in CA)
| Industry | F500 HQs | Revenue |
|---|---|---|
| Technology | 27 | $1,492B |
|
||
| Financial Services | 3 | $174B |
|
||
| Retail | 3 | $44B |
|
||
| Insurance | 3 | $26B |
|
||
| Media / Entertainment | 2 | $115B |
|
||
| Pharmaceuticals / Biotech | 2 | $62B |
|
||
Price history
-6.4% since first listed4 events — show timeline
- 2026-06-01 Price Changed $189,000 CRMLS
- 2026-05-25 Price Changed $195,000 CRMLS
- 2026-05-01 Listed $202,000 CRMLS
- 2026-04-25 Coming Soon $202,000 CRMLS
Property tax history
-3.8%/yrLatest (2025): $549 · +2.3% YoY. Source: county tax records.
Cash-flow waterfall
monthlySold comps — $/sqft
last 12 mo · ≤1 miLoading sold comps…