 🌊 Lakefront
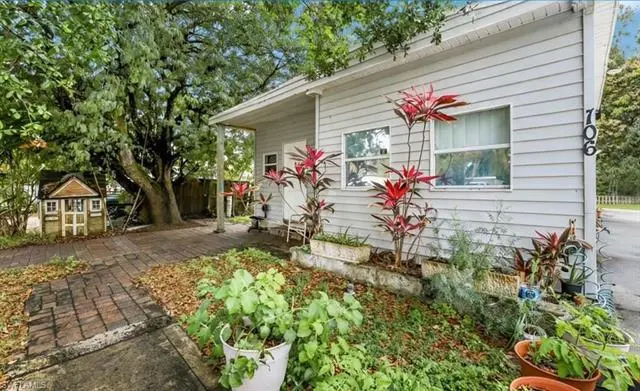
106 Moon Bay St · Marco Shores-Hammock Bay, FL
Flood risk 9/10 · Severe
- FEMA flood zone
- AE
- Chance of flooding over 30 yrs
- 0.99%
- Est. flood insurance / yr
- $1,737 – $8,500
Fire risk 5/10 · Moderate
- Est. fire insurance / yr
- $947 – $1,759
Heat risk 10/10 · Severe
- Hot days now (above 107°F)
- 5 days/yr
- Hot days in 30 yrs
- 21 days/yr
Wind risk 10/10 · Severe
- Chance of severe wind over 30 yrs
- 99.0%
Air-quality risk 3/10 · Minor
- Unhealthy air days now
- 3 days/yr
- Unhealthy air days in 30 yrs
- 3 days/yr
Risk factors via First Street. Map © Google.
Why this score? — see what drove the C grade
The composite is a weighted blend of 9 inputs, each scored 0–100. Each bar is that input's sub-score; the figure is the points it added to the 100-point composite (weight × sub-score).
- Cash flow +20.0/30.0
- ARV discount +7.5/15.0
- DSCR +6.3/10.0
- Schools +5.0/10.0
- Appreciation +4.3/10.0
- 1% rule +4.2/10.0
- Rent growth +3.3/5.0
- Livability +2.5/5.0
- Condition / age +2.5/5.0
$249,900
🖨 Deal sheet (PDF) 📄 Offer letter ✓ Due diligence
Listing remarks
One or more photo(s) has been virtually staged, AI generated or rendered. 106 Moon Bay St - Affordable Naples Living with No HOA! Discover a rare opportunity to own a charming, manufactured home on its own lot in Naples, Florida. This cozy residence offers approximately 672 sq ft of living space with 2 bedrooms and 1 bath, ideal for first-time buyers, seasonal residents, or investors looking for a manageable property in a prime Southwest Florida location. The home features a bright, open interior layout that maximizes functionality, with living spaces that flow seamlessly for comfort and convenience. In-unit laundry adds practicality, while the private lot provides ample outdoor space for g
Key facts
- Private lot
- No hoa fees
- In unit laundry
Tags
Property features AI
Finance
- Other: Lot is approximately 0.14 acres; Total area listed as 672; Lot described as regular; City-maintained paved public road access; Subdivision/Lot unit: Port Au Prince, Lot 106; View: See remarks; Possession at closing
- HOA & community: No HOA maintenance; Community amenities: None; Community type: See remarks
Exterior
- Parking: Attached 1-car garage
- Utilities: Central water; Central sewer; Cable available
- Home design: Manufactured residential property; 1 story (Ranch); Rear exposure faces east; Located in the Port Au Prince community
- Construction: Manufactured construction; Built in 1972; Metal roof; Vinyl siding exterior
- Exterior features: Storage; Single-hung windows; Vinyl siding
Interior
- Kitchen: Electric cooktop; Dishwasher; Refrigerator/Freezer
- Bedrooms: 2 bedrooms (one on the first floor)
- Flooring: Laminate; Tile
- Bathrooms: 1 full bathroom; No master bath
- Heating & cooling: Central electric heat; Central electric cooling; Ceiling fans
- Interior features: Laundry tub; Window coverings; Split bedroom floor plan; Dining area combines with living room
- Laundry & utility: Laundry tub (in-unit)
Neighborhood map
What this means for you Summary
Snapshot
- This is a 2-bed/1.0-bath manufactured listed at $250k.
Deal economics
- At list price, monthly cash flow is $-120 ($-1k/yr) — negative.
- To cash-flow at today's rent, offer at most $229k (8.5% below list).
- To meet the 1% rule (rent ≥ 1% of price), the offer needs to be $231k (7.6% below list).
- Recommended offer: $229k (8.5% below list) — sets the bar for cash-flow.
Location & tenants
- Location reads: area grade C — affects rentability + tenant quality, not the cash-flow math above.
- Collier (suburban): math 60% / reading 56% proficiency, ranked #16 of 73 in FL (top 22%) — acceptable for families but not a draw, mixed tenant base, ~2y average lease.
- Zoned schools: Manatee Elementary School (math 58% / reading 51%, grade C, #892 of 2,144 statewide, top 44%, 584 students, 73% FRL); Manatee Middle School (math 61% / reading 43%, grade C+, #217 of 571 statewide, top 40%, 749 students, 64% FRL); Lely High School (math 40% / reading 39%, grade F, #304 of 667 statewide, top 47%, 1,504 students, 54% FRL).
- Market conditions: Rents rising (+3.2%/yr); 904 active listings in the ZIP; 1 comparable units currently listed for rent nearby; solid renter incomes; 3,520 units permitted in Collier County in 2024 (959 in 5+ unit buildings).
- This rent runs 31% of the median local income ($89k/yr) — at the standard rent-burdened threshold; future hikes will face affordability resistance.
Forward outlook
- Local home prices are declining (-1.5%/yr); year-one equity from $2k of loan paydown is wiped out by about $4k of value loss. Plan a longer hold.
- Collier County population projected at +30% by 2050 — long-run rental-demand tailwind backs the buy-and-hold thesis.
Negotiation context
- It's been on market 79 days — a 6% lower offer ($235k) is reasonable based on typical stale-listing flexibility.
- Current owner paid $45k; list at $250k implies a 455% gain — meaningful room to come down on a strong offer.
Risks & watch-outs
- Watch-outs: flood insurance adds $427/mo.
- Climate carrying-cost: in FEMA flood zone AE (mandatory federal flood insurance); severe wind risk, 99% chance of damaging wind over 30y; moderate wildfire risk; extreme-heat days projected 5→21/yr by 2055 (HVAC capex compounding) — expect insurance premiums to compound above CPI over the hold.
Questions for the listing agent
- What do current leases actually rent for vs. the listed asking? Can we see a recent rent roll and the last 12 months of T-12 income?
- It's been on market 79 days. Have you received any prior offers? Is the seller open to a 9% concession, seller financing, or rate buy-down credit?
- Built in 1972 — when were the roof, HVAC, electrical panel, plumbing, and water heater last replaced?
- What's the actual annual flood-insurance premium (NFIP or private), and is the property in a SFHA with mandatory coverage?
- Why hasn't it sold? Are there any deal-killer items the seller is aware of (foundation, flood, title, zoning, code violations)?
- Is there a deadline driving the sale (1031 exchange, divorce, estate, relocation)? That informs how much negotiation room exists.
- This sits on a lake — are riparian / water-frontage rights deeded with the parcel? Any dock permits, shoreline easements, or HOA water-use restrictions?
- What's the documented flood / surge / shoreline-erosion history here (FEMA AND non-FEMA — e.g., storm surge, creek backup, septic-field saturation)?
- Any water-quality or seasonal algae-bloom issues that affect tenant satisfaction or short-term-rental demand?
- What's the average days-on-market for RENTAL listings here right now (not sales)? A rising rental-DOM trend means longer vacancies and softer asking-rent achievability than the comps imply.
- What's the recent tenant-quality profile in this submarket — average credit score on applications, eviction rate, late-payment / NSF rate, and stable-employment percentage? A property-management company in the area should have these aggregated.
- How much new for-sale + rental construction is in the pipeline within 1–3 miles? Heavy new supply typically softens prices + rents 12–24 months out; constrained supply supports both.
Investment metrics
- 1% rule
- 0.92% ✗
- Cap rate
- 7.76%
- Cash-on-cash
- 5.25%
- DSCR
- 1.23
- GRM
- 9.0
CMA / ARV
No comps found within radius.
Projected returns pro-forma
-1.48% appreciation · 3.21% rent growth · sell at horizon
- IRR
- -10.7%
- Equity multiple
- 0.55×
- Total profit
- $-31,195
- Equity at exit
- $54,606
- IRR
- -3.2%
- Equity multiple
- 0.72×
- Total profit
- $-19,395
- Equity at exit
- $52,601
Cash invested: $69,972 (down + closing). Projections, not guarantees.
Landlord ↔ Tenant lean methodology
- Overall (STATE)
- 87 Strongly Landlord-Friendly
- State Florida
- 87 Strongly Landlord-Friendly · R+3
- County
- — inherits STATE
- City
- — inherits STATE
ZIP-level market 34114
- Home prices YoY
- -0.6%
- Rents YoY
- 3.2%
- Active inventory
- 904
- Price-to-rent
- 9.0×
Monthly cashflow live
- Estimated rent
- $2,309 medium interval (Pro) →
- Mortgage (P&I)
- −$1,311
- Tax from tax record
- −$103 /mo · $1,241/yr
- Insurance
- −$104
- Flood insurance flood zone
- −$427 /mo · $5,118/yr
- HOA
- −$0
- Vacancy / Maint / Mgmt
- −$485
- Net cashflow
- $-120
Break-even live
Sensitivity live
| Price | -10% $21 | -5% $-50 | +0% $-120 | +5% $-191 | +10% $-262 |
|---|---|---|---|---|---|
| Rent | -10% $-303 | -5% $-212 | +0% $-120 | +5% $-29 | +10% $62 |
| Rate | -1.0pp $6 | -0.5pp $-57 | base $-120 | +0.5pp $-185 | +1.0pp $-251 |
UW: 25.0% down · 7.5% · 30yr · 1.5% tax · 5.0% vac · 8.0% maint · 8.0% mgmt
Financing live
Cash to close
- Down payment
- $62,475
- Closing costs
- $7,497
- Reserves months
- —
- Total cash needed
- —
Loan-product check · same deal, 3 products live
Conventional
25% down · 7.5% · 30yr
- Down + closing
- —
- Monthly P&I
- —
- Monthly cashflow
- —
- DSCR
- —
- Eligible?
- —
Personal DTI + credit; lowest rate.
DSCR
20% down · 8.5% · 30yr
- Down + closing
- —
- Monthly P&I
- —
- Monthly cashflow
- —
- DSCR
- —
- Eligible?
- —
No personal income docs; deal must DSCR.
Hard money
10% down · 12.0% · 12mo
- Down + closing
- —
- Monthly P&I
- —
- Monthly cashflow
- —
- DSCR
- —
- Eligible?
- —
Short-term bridge; refi at stabilization.
Rent comps 1 comps
| Address | Beds | Baths | Sqft | Rent | $/sqft | DOM | Units | Dist |
|---|---|---|---|---|---|---|---|---|
| 36 Ocho Rios Naples, FL | 2.0 | 2.0 | 672 | $1,850 | $2.75 | 25d | 1 | 0.15mi |
Listing history 17 events
-
2026-06-21days on market $249,900 Active 79 DOM
-
2026-06-18days on market $249,900 Active 76 DOM
-
2026-06-17days on market $249,900 Active 75 DOM
-
2026-06-16days on market $249,900 Active 74 DOM
-
2026-06-15days on market $249,900 Active 73 DOM
-
2026-06-14days on market $249,900 Active 71 DOM
-
2026-06-10days on market $249,900 Active 68 DOM
-
2026-06-09days on market $249,900 Active 67 DOM
-
2026-06-08days on market $249,900 Active 66 DOM
-
2026-06-07days on market $249,900 Active 65 DOM
-
2026-06-03days on market $249,900 Active 61 DOM
-
2026-06-02days on market $249,900 Active 60 DOM
-
2026-06-01days on market $249,900 Active 59 DOM
-
2026-05-31days on market $249,900 Active 58 DOM
-
2026-05-30days on market $249,900 Active 57 DOM
-
2026-04-03$249,900 Active
-
2003-06-30soldstatus $45,000
ⓘ Source: listings_history table (triggers on properties + properties_extension) + one-shot
backfill from property_details.listing_events for pre-trigger history.
Tax reassessment forecast FL · Resets to sale price
- Current annual tax
- $1,241 · $103/mo
- Projected year-2 tax
- $2,074 · $173/mo
- Expected delta
- +$833/yr (+$69/mo · 67.1%)
ⓘ Screening estimate from a state-policy table — verify with the county assessor before closing.
Climate risk First Street
- Flood 9/10 Extreme FEMA zone AE · 99% chance over 30 yrs
- Wildfire 5/10 Major
- Heat 10/10 Extreme 5 d/yr ≥107°F today · 21 d/yr by 30 yrs out
- Wind 10/10 Extreme 99% chance of damaging wind over 30 yrs
- Air quality 3/10 Moderate 3 unhealthy d/yr today · 3 by 30 yrs out
Nearby sold comps map
Loading sold comps map…
Walkable amenities ~0.75 mi
Loading nearby amenities…
Taxation est. · year 1
- Rental income
- $27,711
- − Mortgage interest
- −$13,998
- − Property taxes
- −$1,241
- − Insurance
- −$6,368
- − Repairs & maintenance
- −$2,217
- − Management
- −$2,217
- − Depreciation
- −$7,270
- Taxable loss
- −$5,600
- Est. tax savings @ 24.0%
- +$1,344
- After-tax cash flow
- $-100/yr
For passive investors: Depreciation is non-cash, so a rental often shows a tax loss while cash-flowing — sheltering income. Rental losses are passive: they offset passive income freely, and up to $25,000/yr can offset ordinary (W-2) income if you actively participate and your MAGI is under $100k (phasing out to $0 by $150k); unused losses carry forward. On sale, claimed depreciation is recaptured at up to 25%, and gains may owe capital-gains tax (a 1031 exchange can defer both). Figures are a year-1 estimate at your 24.0% rate — not tax advice; consult a CPA.
Schools (NCES district)
- District
- Collier
- NCES district ID
- 1200330
- Math proficiency
- 60% ▼ -4.00%
- Reading proficiency
- 56% ▼ -2.00%
- Median HH income
- $58,275
- Composite
- 50.23/100
- National rank
- #1892
- State rank
- #16 of 73 in FL
Livability — Marco Shores-Hammock Bay
No livability data for this city. (Only ~50 U.S. cities are tracked.)
Census & demographics
- County
- Collier County · 396,295 people
- Metro
- Naples-Marco Island, FL
- Population (ZIP)
- 23,559
- Household income
- $89,334
- Rent vs Own
- Severe rent burden
- 550.0
Population outlook (Collier County) Hauer SSP2
- Today (2025)
- 420,858 people
- By 2030
- 450,054 · +6.9%
- By 2040
- 502,232 · +19.3%
- By 2050
- 544,932 · +29.5%
- By 2075
- 627,203 · +49.0%
- By 2100
- 659,015 · +56.6%
Race, ethnicity, and origin ACS 2023
- Neighborhood character
- Predominantly White (72%)
- Race & ethnicity
- White 72% Hispanic / Latino 17% Two or more races 13% Black 7%
- Hispanic origin (detail)
- Mexican 7% Puerto Rican 1% Cuban 3%
- Common ancestry
- Hispanic 5% Romanian 4% Lithuanian 1%
- Foreign-born
- 21% · Canada, Jamaica
- Languages at home
- 75% English-only · Spanish 15% French/Haitian/Cajun 5% Other Indo-European 4%
Political lean MEDSL · Collier
- 2024 margin
- Solid R (+33.1) · D 33.1% · R 66.2%
- 2008→2024 swing
- -10.6pp toward R · 2008: -22.5pp · 2024: -33.1pp
- All cycles
- 2024: R+33.1 2020: R+24.7 2016: R+26.0 2012: R+30.1 2008: R+22.5
Not yet ingested
- Civics
- —
Market trends
- HPI YoY
- ▼ -1.48%
- Current HPI
- 266.5545
- Rent YoY
- ▲ 3.21%
- Metro
- Naples-Marco Island, FL
- State GDP YoY
- ▲ 3.28%
- F500 in state
- 36
Industry mix (Fortune 500 HQ in FL)
| Industry | F500 HQs | Revenue |
|---|---|---|
| Industrial Technology | 2 | $29B |
|
||
| Insurance | 2 | $17B |
|
||
| Retail | 1 | $60B |
|
||
| Technology Distribution | 1 | $58B |
|
||
| Homebuilding | 1 | $35B |
|
||
| Technology Manufacturing | 1 | $35B |
|
||
Price history
+455.3% since first listed2 events — show timeline
- 2026-04-03 Listed $249,900 NAPLESMLS
- 2003-06-30 Sold (Public Records) $45,000 Public Records
Property tax history
+11.9%/yrLatest (2025): $1,241 · -5.4% YoY. Source: county tax records.
Cash-flow waterfall
monthlySold comps — $/sqft
last 12 mo · ≤1 miLoading sold comps…