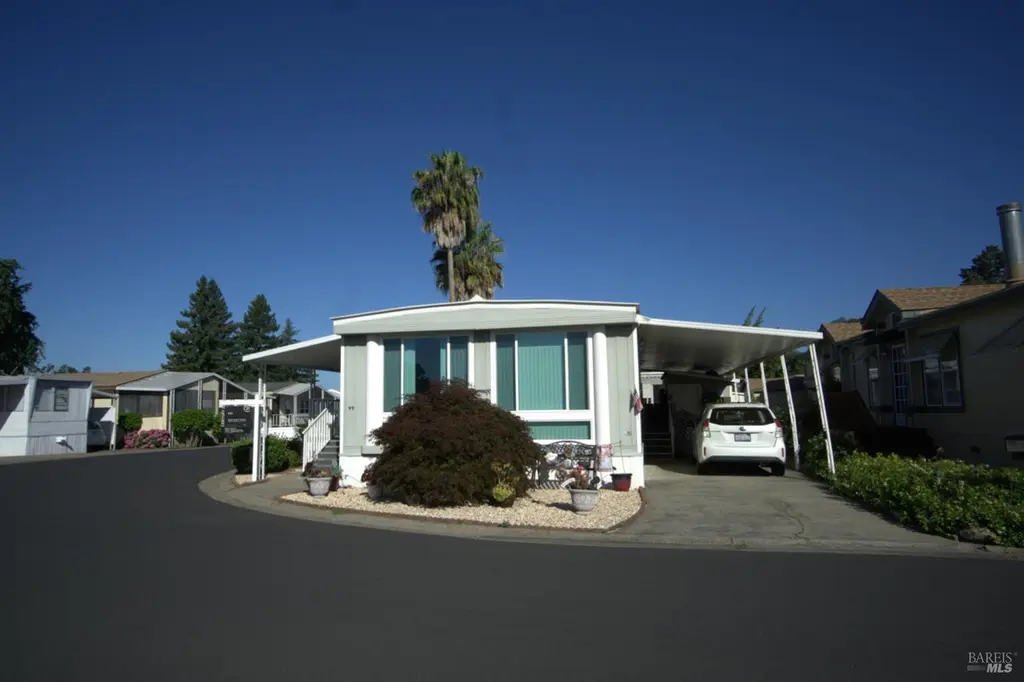
99 Plymouth Way · Larkfield-Wikiup, CA
Flood risk 1/10 · Minimal
- FEMA flood zone
- X (unshaded)
- Chance of flooding over 30 yrs
- 0.0%
- Est. flood insurance / yr
- $507 – $1,088
Fire risk 5/10 · Moderate
- Est. fire insurance / yr
- $659 – $1,223
Heat risk 4/10 · Minor
- Hot days now (above 90°F)
- 7 days/yr
- Hot days in 30 yrs
- 16 days/yr
Wind risk 1/10 · Minimal
- Chance of severe wind over 30 yrs
- —
Air-quality risk 9/10 · Severe
- Unhealthy air days now
- 18 days/yr
- Unhealthy air days in 30 yrs
- 20 days/yr
Risk factors via First Street. Map © Google.
Why this score? — see what drove the C+ grade
The composite is a weighted blend of 9 inputs, each scored 0–100. Each bar is that input's sub-score; the figure is the points it added to the 100-point composite (weight × sub-score).
- Cash flow +30.0/30.0
- 1% rule +10.0/10.0
- DSCR +10.0/10.0
- Condition / age +3.8/5.0
- Schools +3.7/10.0
- ARV discount +2.5/15.0
- Rent growth +2.5/5.0
- Livability +2.5/5.0
- Appreciation +0.0/10.0
$179,900
🖨 Deal sheet 📄 Offer letter ✓ Due diligence
Listing remarks
Welcome to your spacious, beautifully maintained double-wide mobile home on a desirable corner lot in Colonial Senior Park. This home has a wonderful open front deck leading to a spacious patio area where you can visit with your family or friends. When you step inside the home you come upon the light and bright living room that has huge windows to bring in natural light. The living room is open to the dining area which borders the kitchen, keeping you connected to your family and friends while cooking. All the kitchen appliances are sold with the home including the washer and dryer! Down the hall you will find the 2 bedrooms and 2 baths. The main bedroom has an ensuite so that you feel pamp
Key facts
- Huge windows
- Spacious patio area
- Open front deck
Tags
Property features AI
Finance
- Other: Located in a mobile home park (land lease: yes)
- Financial info: Monthly land lease fee (space rent) applies
- HOA & community: No homeowners association
Exterior
- Parking: Attached covered parking for 2 vehicles
- Utilities: Individual electric meter; Individual gas meter; Public sewer
- Home design: Manufactured double-wide in park; Located in a senior community
- Construction: Vinyl skirting; Updated/remodeled condition
- Exterior features: Fenced backyard; Carport awning; Shed(s)
Interior
- Kitchen: Dishwasher; Disposal; Free-standing gas range; Microwave; Hood over range; Free-standing refrigerator; Laminate counters
- Bedrooms: 2 bedrooms
- Flooring: Carpet; Laminate
- Bathrooms: 2 full bathrooms with shower stalls
- Heating & cooling: Central heating; Evaporative cooler
- Interior features: Updated/remodeled interior; Dining/Living combo; Deck off the living room
- Laundry & utility: Washer and dryer included; Laundry inside
Neighborhood map
What this means for you Summary
Snapshot
- This is a 2-bed/2.0-bath manufactured listed at $180k. Condition is rated good.
Deal economics
- At list price, monthly cash flow is $927 ($11k/yr) — positive.
- The deal already cash-flows at list — no discount required.
- Meets the 1% rule at list price ($3k rent vs $180k).
- Cap rate 12.5% vs local median 2.1% in Larkfield-Wikiup — top-decile yield for the area; either an underpriced asset or a hidden risk that comps aren't pricing in. Stress-test before assuming the spread holds.
Location & tenants
- Location reads: area grade C — affects rentability + tenant quality, not the cash-flow math above.
- Santa Rosa High (urban): math 31% / reading 47% proficiency, ranked #703 of 1,400 in CA (top 50%) — families likely to look elsewhere, expect single-tenant / working-renter base with shorter leases.
- Market conditions: Rents flat; 199 active listings in the ZIP; 7 comparable units currently listed for rent nearby; rentals leasing fast (median 13d on market — plan ~1-2 weeks tenant-placement turnaround); solid renter incomes; 1,039 units permitted in Sonoma County in 2024 (185 in 5+ unit buildings).
- This rent runs 34% of the median local income ($98k/yr) — at the standard rent-burdened threshold; future hikes will face affordability resistance.
Forward outlook
- Local home prices are declining (-3.0%/yr); year-one equity from $1k of loan paydown is wiped out by about $5k of value loss. Plan a longer hold.
- Sonoma County population projected at +8% by 2050 — modest demand growth; plan on rents tracking national, not racing it.
- At projected returns (-3.0% appreciation + 0.1% rent growth), your $50k cash investment doubles in ~7 years — after that, you're playing with house money.
Negotiation context
- Only 4 days on market — expect competitive offers; lowballing is unlikely to land.
Risks & watch-outs
- Climate carrying-cost: moderate wildfire risk — expect insurance premiums to compound above CPI over the hold.
Questions for the listing agent
- Built in 1966 — when were the roof, HVAC, electrical panel, plumbing, and water heater last replaced?
- Is there a deadline driving the sale (1031 exchange, divorce, estate, relocation)? That informs how much negotiation room exists.
- What's the average days-on-market for RENTAL listings here right now (not sales)? A rising rental-DOM trend means longer vacancies and softer asking-rent achievability than the comps imply.
- What's the recent tenant-quality profile in this submarket — average credit score on applications, eviction rate, late-payment / NSF rate, and stable-employment percentage? A property-management company in the area should have these aggregated.
- How much new for-sale + rental construction is in the pipeline within 1–3 miles? Heavy new supply typically softens prices + rents 12–24 months out; constrained supply supports both.
Investment metrics
- 1% rule
- 1.53% ✓
- Cap rate
- 12.48%
- Cash-on-cash
- 22.09%
- DSCR
- 1.98
- GRM
- 5.5
CMA / ARV
- ARV (on-the-fly)
- $161,880
- Comps found
- 12
Show comp detail 12 sales within ~0.75 mi
| Address | Dist | Beds/Ba | Sqft | Sold | Price | $/sf | Match |
|---|---|---|---|---|---|---|---|
| 50 Plymouth Way | 0.06mi | 2/2.0 | 1,120 (-2%) | 11mo | $156,000 | $139 | 85 |
| 56 Ellie Dr | 0.12mi | 2/2.0 | 1,080 (-5%) | 3mo | $75,000 | $69 | 84 |
| 612 Colonial Park Dr | 0.03mi | 2/2.0 | 1,200 (+5%) | 10mo | $165,000 | $138 | 82 |
| 33 Arthur Dr | 0.18mi | 3/2.0 (+1) | 1,152 (+1%) | 12mo | $188,000 | $163 | 75 |
| 216 Colonial Park Dr | 0.08mi | 2/2.0 | 1,060 (-7%) | 12mo | $150,000 | $142 | 75 |
| 634 Colonial Park Dr | 0.07mi | 2/2.0 | 1,000 (-12%) | 7mo | $118,000 | $118 | 71 |
| 5306 Rexford Way | 0.74mi | 2/2.0 | 1,150 (+1%) | 1mo | $255,000 | $222 | 63 |
| 5241 Whispering Crk | 0.61mi | 2/2.0 | 1,224 (+7%) | 2mo | $191,000 | $156 | 58 |
| 19 Ellie Dr | 0.12mi | 3/2.0 (+1) | 1,300 (+14%) | 11mo | $240,000 | $185 | 57 |
| 5215 Gayle Dr | 0.72mi | 2/2.0 | 1,120 (-2%) | 9mo | $175,000 | $156 | 56 |
| 5318 Huckleberry Way | 0.67mi | 3/2.0 (+1) | 1,100 (-4%) | 8mo | $135,000 | $123 | 51 |
| 5300 Rexford #5300 | 0.75mi | 3/2.0 (+1) | 1,248 (+10%) | 6mo | $145,000 | $116 | 39 |
Match score weights: distance 35% · size 25% · config 20% · recency 20%. Top-matched comps best support the ARV.
Projected returns pro-forma
-3.0% appreciation · 0.1% rent growth · sell at horizon
- IRR
- 11.5%
- Equity multiple
- 1.44×
- Total profit
- $22,149
- Equity at exit
- $26,824
- IRR
- 18.0%
- Equity multiple
- 2.30×
- Total profit
- $65,323
- Equity at exit
- $15,554
Cash invested: $50,372 (down + closing). Projections, not guarantees.
Landlord ↔ Tenant lean methodology
- Overall (STATE)
- 18 Strongly Tenant-Friendly
- State California
- 18 Strongly Tenant-Friendly · D+13
- County
- — inherits STATE
- City
- — inherits STATE
ZIP-level market 95403
- Rents YoY
- 0.1%
- Active inventory
- 199
- Price-to-rent
- 5.5×
Monthly cashflow live
- Estimated rent
- $2,747 high interval (Pro) →
- Mortgage (P&I)
- −$943
- Tax est. 1.5%
- −$225 /mo · $2,698/yr
- Insurance
- −$75
- HOA
- −$0
- Vacancy / Maint / Mgmt
- −$577
- Net cashflow
- $927
Break-even live
UW: 25.0% down · 7.5% · 30yr · 1.5% tax · 5.0% vac · 8.0% maint · 8.0% mgmt
Financing live
Cash to close
- Down payment
- $44,975
- Closing costs
- $5,397
- Reserves months
- —
- Total cash needed
- —
Loan-product check · same deal, 3 products live
Conventional
25% down · 7.5% · 30yr
- Down + closing
- —
- Monthly P&I
- —
- Monthly cashflow
- —
- DSCR
- —
- Eligible?
- —
Personal DTI + credit; lowest rate.
DSCR
20% down · 8.5% · 30yr
- Down + closing
- —
- Monthly P&I
- —
- Monthly cashflow
- —
- DSCR
- —
- Eligible?
- —
No personal income docs; deal must DSCR.
Hard money
10% down · 12.0% · 12mo
- Down + closing
- —
- Monthly P&I
- —
- Monthly cashflow
- —
- DSCR
- —
- Eligible?
- —
Short-term bridge; refi at stabilization.
Rent comps 7 comps
| Address | Beds | Baths | Sqft | Rent | $/sqft | DOM | Units | Dist |
|---|---|---|---|---|---|---|---|---|
| 211 Shiloh Rd Windsor, CA | 2.0 | 1.0 | 814 | $3,095 | $3.80 | 13d | 1 | 0.63mi |
| 193 Airport Blvd E Santa Rosa, CA | 1.0–2.0 | 1.0–1.5 | 967 | $2,760 | $2.85 | 12d | 1 | 0.87mi |
| 5252 Old Redwood Hwy Unit 20 Santa Rosa, CA | 2.0 | 1.0 | 900 | $2,000 | $2.22 | 13d | 1 | 0.95mi |
| 5256 Old Redwood Hwy Unit 31 Santa Rosa, CA | 2.0 | 2.0 | 950 | $2,200 | $2.32 | 13d | 1 | 0.95mi |
| 5223 Old Redwood Hwy Santa Rosa, CA | 2.0 | 1.0 | 915 | $3,200 | $3.50 | 12d | 1 | 1.11mi |
| 5209 Old Redwood Hwy Santa Rosa, CA | 2.0 | 2.0 | 1014 | $2,450 | $2.42 | 21d | 1 | 1.16mi |
| 1145 Shiloh Rd Windsor, CA | 3.0 | 1.0–2.0 | 776 | $3,828 | $4.93 | 7d | 14 | 1.36mi |
Listing history 4 events
-
2026-06-16days on market $179,900 Active 4 DOM
-
2026-06-15days on market $179,900 Active 3 DOM
-
2026-06-13remarks 699-char remark
-
2026-06-13$179,900 Active 1 DOM
ⓘ Source: listings_history table (triggers on properties + properties_extension) + one-shot
backfill from property_details.listing_events for pre-trigger history.
Climate risk First Street
- Flood 1/10 Low FEMA zone X (unshaded) · 0% chance over 30 yrs
- Wildfire 5/10 Major
- Heat 4/10 Moderate 7 d/yr ≥90°F today · 16 d/yr by 30 yrs out
- Wind 1/10 Low
- Air quality 9/10 Extreme 18 unhealthy d/yr today · 20 by 30 yrs out
Nearby sold comps map
Loading sold comps map…
Walkable amenities ~0.75 mi
Loading nearby amenities…
Taxation est. · year 1
- Rental income
- $32,968
- − Mortgage interest
- −$10,077
- − Property taxes
- −$2,698
- − Insurance
- −$900
- − Repairs & maintenance
- −$2,637
- − Management
- −$2,637
- − Depreciation
- −$5,233
- Taxable income
- $8,784
- Est. tax owed @ 24.0%
- −$2,108
- After-tax cash flow
- $9,017/yr
For passive investors: Depreciation is non-cash, so a rental often shows a tax loss while cash-flowing — sheltering income. Rental losses are passive: they offset passive income freely, and up to $25,000/yr can offset ordinary (W-2) income if you actively participate and your MAGI is under $100k (phasing out to $0 by $150k); unused losses carry forward. On sale, claimed depreciation is recaptured at up to 25%, and gains may owe capital-gains tax (a 1031 exchange can defer both). Figures are a year-1 estimate at your 24.0% rate — not tax advice; consult a CPA.
Condition & rehab AI · 12 photos
This double-wide mobile home in Colonial Senior Park is in good condition with minimal repairs needed. It offers a spacious living area and is move-in ready.
Value-add opportunities
- Both Paint exterior siding — Enhances curb appeal and value
- Both Clean gutters — Improves drainage and property value
Renovation cost estimate screening
Value-add ROI direction
- Both Paint exterior siding — Enhances curb appeal and value ↑
- Both Clean gutters — Improves drainage and property value ↑
ⓘ Cost ranges are severity-bucket heuristics (US national rule-of-thumb). Get contractor quotes + a written scope before underwriting a rehab budget.
Schools (NCES district)
- District
- Santa Rosa High
- NCES district ID
- 0635830
- Math proficiency
- 31% —
- Reading proficiency
- 47% —
- Median HH income
- $62,000
- Composite
- 37.25/100
- National rank
- #8972
- State rank
- #703 of 1400 in CA
Livability — Larkfield-Wikiup
No livability data for this city. (Only ~50 U.S. cities are tracked.)
Census & demographics
- Census place
- Larkfield-Wikiup, CA
- County
- Sonoma County · 449,805 people
- City population
- 45,570
- Metro
- Santa Rosa-Petaluma, CA
- Population (ZIP)
- 45,806
- Household income
- $98,191
- Rent vs Own
- Severe rent burden
- 1770.0
Population outlook (Sonoma County) Hauer SSP2
- Today (2025)
- 539,935 people
- By 2030
- 554,870 · +2.8%
- By 2040
- 573,262 · +6.2%
- By 2050
- 580,715 · +7.6%
- By 2075
- 579,229 · +7.3%
- By 2100
- 547,835 · +1.5%
Race, ethnicity, and origin ACS 2023
- Neighborhood character
- Diverse neighborhood (Simpson 0.61)
- Race & ethnicity
- White 50% Hispanic / Latino 37% Two or more races 13% Asian 5% Native American 2% Black 2%
- Hispanic origin (detail)
- Mexican 31%
- Common ancestry
- Italian 3% Slovak 2% Lithuanian 2%
- Foreign-born
- 20% · Canada, Vietnam, South Korea
- Languages at home
- 67% English-only · Spanish 26% Other Indo-European 1% Vietnamese 1%
Political lean MEDSL · Sonoma
- 2024 margin
- Solid D (+46.2) · D 71.4% · R 25.2% · Other 3.3%
- 2008→2024 swing
- -3.4pp toward R · 2008: 49.6pp · 2024: 46.2pp
- All cycles
- 2024: D+46.2 2020: D+51.5 2016: D+47.9 2012: D+44.9 2008: D+49.6
Not yet ingested
- Civics
- —
Market trends
- HPI YoY
- ▼ -679.94%
- Current HPI
- 254.3106
- Rent YoY
- ▲ 0.10%
- Metro
- Santa Rosa-Petaluma, CA
- State GDP YoY
- ▲ 3.21%
- F500 in state
- 116
Industry mix (Fortune 500 HQ in CA)
| Industry | F500 HQs | Revenue |
|---|---|---|
| Technology | 27 | $1,492B |
|
||
| Financial Services | 3 | $174B |
|
||
| Retail | 3 | $44B |
|
||
| Insurance | 3 | $26B |
|
||
| Media / Entertainment | 2 | $115B |
|
||
| Pharmaceuticals / Biotech | 2 | $62B |
|
||
Price history
1 event — show timeline
- 2026-06-12 Listed $179,900 BAREIS
Cash-flow waterfall
monthlySold comps — $/sqft
last 12 mo · ≤1 miLoading sold comps…