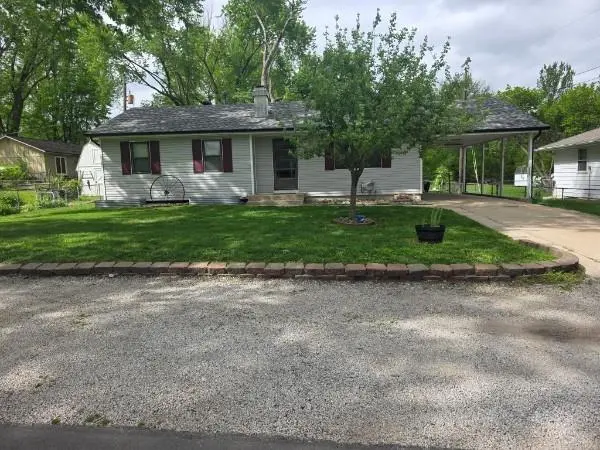
128 SW 18th St · Oak Grove, MO
Flood risk 1/10 · Minimal
- FEMA flood zone
- X (unshaded)
- Chance of flooding over 30 yrs
- 0.0%
- Est. flood insurance / yr
- $473 – $860
Fire risk 2/10 · Minimal
- Est. fire insurance / yr
- $1,054 – $1,958
Heat risk 4/10 · Minor
- Hot days now (above 107°F)
- 7 days/yr
- Hot days in 30 yrs
- 16 days/yr
Wind risk 2/10 · Minimal
- Chance of severe wind over 30 yrs
- —
Air-quality risk 3/10 · Minor
- Unhealthy air days now
- 2 days/yr
- Unhealthy air days in 30 yrs
- 4 days/yr
Risk factors via First Street. Map © Google.
Why this score? — see what drove the D grade
The composite is a weighted blend of 9 inputs, each scored 0–100. Each bar is that input's sub-score; the figure is the points it added to the 100-point composite (weight × sub-score).
- Cash flow +11.7/30.0
- ARV discount +10.6/15.0
- Livability +3.8/5.0
- DSCR +3.5/10.0
- Schools +3.5/10.0
- 1% rule +2.8/10.0
- Rent growth +2.5/5.0
- Condition / age +2.5/5.0
- Appreciation +0.0/10.0
$239,500
🖨 Deal sheet (PDF) 📄 Offer letter ✓ Due diligence
Key facts
- 0.3 acre lot
- Built 1971
- Listed 2 days
Property features AI
Exterior
- Parking: Carport
- Utilities: Public water; Public sewer
- Home design: Single-family ranch-style home; Residential property
- Construction: Vinyl siding; Composition roof; Approximately 51–75 years old
- Exterior features: City lot, level; Lot dimensions approximately 70 x 162
Interior
- Kitchen: Eat-in kitchen
- Bedrooms: 4 bedrooms
- Bathrooms: 2 full bathrooms
- Heating & cooling: Forced air heating; Electric cooling
- Interior features: Finished full basement with inside entrance; Eat-in kitchen; Wood-burning fireplace in the family room (1 fireplace)
- Laundry & utility: Laundry located in the basement
Neighborhood map
What this means for you Summary
Snapshot
- This is a 4-bed/2.0-bath single-family listed at $240k.
Deal economics
- At list price, monthly cash flow is $-69 ($-826/yr) — negative.
- To cash-flow at today's rent, offer at most $227k (5.1% below list).
- To meet the 1% rule (rent ≥ 1% of price), the offer needs to be $186k (22.3% below list).
- Recommended offer: $186k (22.3% below list) — sets the bar for 1% rule.
- Cap rate 5.9% vs local median 2.3% in Oak Grove — top-decile yield for the area; either an underpriced asset or a hidden risk that comps aren't pricing in. Stress-test before assuming the spread holds.
Location & tenants
- Location reads 76/100 on livability (#43 in MO, #3,564 nationally) — a middle-class / working-renter tenant base. Strengths: crime A+, cost of living A+, housing A+; Watch: amenities F, commute F.
- Oak Grove R-VI (suburban): math 29% / reading 50% proficiency, ranked #134 of 324 in MO (top 41%) — families likely to look elsewhere, expect single-tenant / working-renter base with shorter leases.
- Zoned schools: Oak Grove Primary (496 students, 37% FRL); Oak Grove Middle (math 27% / reading 47%, grade F, #220 of 391 statewide, top 59%, 466 students, 28% FRL); Oak Grove High (math 17% / reading 57%, grade F, #291 of 521 statewide, top 60%, 564 students, 27% FRL) — zoned schools at 31% FRL track the district average.
- Market conditions: 133 active listings in the ZIP; 2 comparable units currently listed for rent nearby; solid renter incomes; 4,002 units permitted in Jackson County in 2024 (2,271 in 5+ unit buildings).
Forward outlook
- Local home prices are declining (-3.0%/yr); year-one equity from $2k of loan paydown is wiped out by about $7k of value loss. Plan a longer hold.
- Jackson County population projected at +4% by 2050 — modest demand growth; plan on rents tracking national, not racing it.
Negotiation context
- Only 2 days on market — expect competitive offers; lowballing is unlikely to land.
- 3 sale attempts since 14y ago with the ask held roughly flat each time — persistent listings suggest the price (not the market) is what's stuck; bring a comps-based counter.
Questions for the listing agent
- What do current leases actually rent for vs. the listed asking? Can we see a recent rent roll and the last 12 months of T-12 income?
- Built in 1971 — when were the roof, HVAC, electrical panel, plumbing, and water heater last replaced?
- Is there a deadline driving the sale (1031 exchange, divorce, estate, relocation)? That informs how much negotiation room exists.
- Schools are B-rated — typically a magnet for longer-tenancy family renters. What's the average tenant stay here, and is there a school-zone premium baked into asking?
- The area grade is low — what's the realistic commute time and amenity access for the typical tenant pool here? Any planned neighborhood developments (good or bad) we should know about?
- What's the average days-on-market for RENTAL listings here right now (not sales)? A rising rental-DOM trend means longer vacancies and softer asking-rent achievability than the comps imply.
- What's the recent tenant-quality profile in this submarket — average credit score on applications, eviction rate, late-payment / NSF rate, and stable-employment percentage? A property-management company in the area should have these aggregated.
- How much new for-sale + rental construction is in the pipeline within 1–3 miles? Heavy new supply typically softens prices + rents 12–24 months out; constrained supply supports both.
Investment metrics
- 1% rule
- 0.78% ✗
- Cap rate
- 5.95%
- Cash-on-cash
- -1.23%
- DSCR
- 0.95
- GRM
- 10.7
CMA / ARV
- ARV (median comp)
- $257,496
- List price
- $239,500
- Delta
- -6.99%
- Verdict
- FAIR
- Comps
- 20 within 1.0 mi
Show comp detail 12 sales within ~0.75 mi
| Address | Dist | Beds/Ba | Sqft | Sold | Price | $/sf | Match |
|---|---|---|---|---|---|---|---|
| 303 SW 17th St | 0.13mi | 3/2.0 (-1) | 1,704 (-10%) | 2mo | $479,900 | $282 | 71 |
| 307 SW 13th St | 0.39mi | 3/2.5 (-1) | 1,829 (-3%) | 1mo | $295,000 | $161 | 69 |
| 305 SW 17th St | 0.15mi | 3/2.0 (-1) | 1,667 (-12%) | 3mo | $489,000 | $293 | 66 |
| 2205 S Owing St | 0.59mi | 3/2.0 (-1) | 1,850 (-2%) | 9mo | $239,900 | $130 | 57 |
| 509 SE 20th St | 0.52mi | 3/2.0 (-1) | 1,782 (-6%) | 7mo | $235,000 | $132 | 56 |
| 1600 SW Stonewall Dr | 0.27mi | 3/2.0 (-1) | 1,700 (-10%) | 12mo | $470,000 | $276 | 55 |
| 410 SW 24th St | 0.46mi | 4/3.0 | 1,658 (-12%) | 1mo | $249,500 | $150 | 53 |
| 311 SW 24th Ter | 0.52mi | 4/2.5 | 1,762 (-7%) | 11mo | $290,000 | $165 | 53 |
| 510 SE 21st St | 0.55mi | 3/2.5 (-1) | 2,052 (+9%) | 0mo | $254,900 | $124 | 52 |
| 2113 S Owings St | 0.56mi | 3/2.0 (-1) | 1,658 (-12%) | 1mo | $255,000 | $154 | 48 |
| 2106 SE Oak Ridge Dr | 0.72mi | 4/3.0 | 1,708 (-10%) | 11mo | $339,900 | $199 | 37 |
| 2103 S Owings St | 0.51mi | 3/1.5 (-1) | 1,612 (-15%) | 13mo | $190,000 | $118 | 34 |
Match score weights: distance 35% · size 25% · config 20% · recency 20%. Top-matched comps best support the ARV.
Projected returns pro-forma
-3.0% appreciation · 3.0% rent growth · sell at horizon
- IRR
- -18.4%
- Equity multiple
- 0.36×
- Total profit
- $-43,236
- Equity at exit
- $35,710
- IRR
- -10.7%
- Equity multiple
- 0.35×
- Total profit
- $-43,470
- Equity at exit
- $20,708
Cash invested: $67,060 (down + closing). Projections, not guarantees.
Landlord ↔ Tenant lean methodology
- Overall (STATE)
- 81 Strongly Landlord-Friendly
- State Missouri
- 81 Strongly Landlord-Friendly · R+10
- County
- — inherits STATE
- City
- — inherits STATE
ZIP-level market 64075
- Home prices YoY
- -30.1%
- Active inventory
- 133
- Price-to-rent
- 10.7×
Monthly cashflow live
- Estimated rent
- $1,860 medium interval (Pro) →
- Mortgage (P&I)
- −$1,256
- Tax from tax record
- −$183 /mo · $2,191/yr
- Insurance
- −$100
- HOA
- −$0
- Vacancy / Maint / Mgmt
- −$391
- Net cashflow
- $-69
Break-even live
Sensitivity live
| Price | -10% $67 | -5% $-1 | +0% $-69 | +5% $-137 | +10% $-204 |
|---|---|---|---|---|---|
| Rent | -10% $-216 | -5% $-142 | +0% $-69 | +5% $5 | +10% $78 |
| Rate | -1.0pp $52 | -0.5pp $-8 | base $-69 | +0.5pp $-131 | +1.0pp $-194 |
UW: 25.0% down · 7.5% · 30yr · 1.5% tax · 5.0% vac · 8.0% maint · 8.0% mgmt
Financing live
Cash to close
- Down payment
- $59,875
- Closing costs
- $7,185
- Reserves months
- —
- Total cash needed
- —
Loan-product check · same deal, 3 products live
Conventional
25% down · 7.5% · 30yr
- Down + closing
- —
- Monthly P&I
- —
- Monthly cashflow
- —
- DSCR
- —
- Eligible?
- —
Personal DTI + credit; lowest rate.
DSCR
20% down · 8.5% · 30yr
- Down + closing
- —
- Monthly P&I
- —
- Monthly cashflow
- —
- DSCR
- —
- Eligible?
- —
No personal income docs; deal must DSCR.
Hard money
10% down · 12.0% · 12mo
- Down + closing
- —
- Monthly P&I
- —
- Monthly cashflow
- —
- DSCR
- —
- Eligible?
- —
Short-term bridge; refi at stabilization.
Rent comps 2 comps
| Address | Beds | Baths | Sqft | Rent | $/sqft | DOM | Units | Dist |
|---|---|---|---|---|---|---|---|---|
| 1101 SE 4th St Oak Grove, MO | 2.0–3.0 | 2.5 | 1194 | $1,910 | $1.60 | 3d | 94 | 1.36mi |
| 106 NE Dogwood St Unit D Oak Grove, MO | 3.0 | 2.5 | 1495 | $1,399 | $0.94 | 3d | 1 | 1.49mi |
Listing history 13 events
-
2026-06-07statusdays on market $239,500 Pending 2 DOM
-
2026-06-03days on market $239,500 Coming Soon 30 DOM
-
2026-06-02pricedays on market $239,500 Coming Soon 29 DOM
-
2026-06-01days on market $235,000 Coming Soon 28 DOM
-
2026-05-31days on market $235,000 Coming Soon 27 DOM
-
2026-05-04historical $235,000
-
2012-06-04soldstatus
-
2012-05-30soldstatus
-
2012-04-17$88,500
-
2012-03-20historical
-
2012-01-16$88,500
-
2006-02-13soldstatus
-
1973-06-18soldstatus
ⓘ Source: listings_history table (triggers on properties + properties_extension) + one-shot
backfill from property_details.listing_events for pre-trigger history.
Tax reassessment forecast MO · Resets to sale price
- Current annual tax
- $2,191 · $183/mo
- Projected year-2 tax
- $2,323 · $194/mo
- Expected delta
- +$132/yr (+$11/mo · 6.0%)
ⓘ Screening estimate from a state-policy table — verify with the county assessor before closing.
Climate risk First Street
- Flood 1/10 Low FEMA zone X (unshaded) · 0% chance over 30 yrs
- Wildfire 2/10 Low
- Heat 4/10 Moderate 7 d/yr ≥107°F today · 16 d/yr by 30 yrs out
- Wind 2/10 Low
- Air quality 3/10 Moderate 2 unhealthy d/yr today · 4 by 30 yrs out
Nearby sold comps map
Loading sold comps map…
Walkable amenities ~0.75 mi
Loading nearby amenities…
Taxation est. · year 1
- Rental income
- $22,322
- − Mortgage interest
- −$13,416
- − Property taxes
- −$2,191
- − Insurance
- −$1,198
- − Repairs & maintenance
- −$1,786
- − Management
- −$1,786
- − Depreciation
- −$6,967
- Taxable loss
- −$5,021
- Est. tax savings @ 24.0%
- +$1,205
- After-tax cash flow
- $379/yr
For passive investors: Depreciation is non-cash, so a rental often shows a tax loss while cash-flowing — sheltering income. Rental losses are passive: they offset passive income freely, and up to $25,000/yr can offset ordinary (W-2) income if you actively participate and your MAGI is under $100k (phasing out to $0 by $150k); unused losses carry forward. On sale, claimed depreciation is recaptured at up to 25%, and gains may owe capital-gains tax (a 1031 exchange can defer both). Figures are a year-1 estimate at your 24.0% rate — not tax advice; consult a CPA.
Schools (NCES district)
- District
- Oak Grove R-VI
- NCES district ID
- 2923010
- Math proficiency
- 29% ▼ -13.00%
- Reading proficiency
- 50% ▼ -7.00%
- Median HH income
- $56,271
- Composite
- 34.6/100
- National rank
- #5155
- State rank
- #134 of 324 in MO
Livability — Oak Grove
- Score
- 76/100
- State rank
- #43
- US rank
- #3564
Category grades
Schools grade is shown separately in the Schools card above.
Census & demographics
- Census place
- Oak Grove, MO
- County
- Jackson County · 687,798 people
- City population
- 12,121
- Metro
- Kansas City, MO-KS
- Population (ZIP)
- 12,121
- Household income
- $81,573
- Rent vs Own
- Severe rent burden
- 316.0
Population outlook (Jackson County) Hauer SSP2
- Today (2025)
- 719,589 people
- By 2030
- 731,456 · +1.6%
- By 2040
- 746,689 · +3.8%
- By 2050
- 749,289 · +4.1%
- By 2075
- 736,227 · +2.3%
- By 2100
- 668,210 · -7.1%
Race, ethnicity, and origin ACS 2023
- Neighborhood character
- Predominantly White (92%)
- Race & ethnicity
- White 92% Two or more races 3% Black 2% Hispanic / Latino 2% Asian 1%
- Common ancestry
- Italian 11% Lithuanian 4% Slovak 3%
- Foreign-born
- 2% · Canada
- Languages at home
- 98% English-only · Spanish 1%
Political lean MEDSL · Jackson
- 2024 margin
- D (+19.3) · D 58.9% · R 39.5% · Other 1.6%
- 2008→2024 swing
- -6.1pp toward R · 2008: 25.4pp · 2024: 19.3pp
- All cycles
- 2024: D+19.3 2020: D+22.0 2016: D+16.6 2012: D+19.0 2008: D+25.4
Not yet ingested
- Civics
- —
Market trends
- HPI YoY
- ▼ -110.43%
- Current HPI
- 257.0632
- Rent YoY
- —
- Metro
- Kansas City, MO-KS
- State GDP YoY
- ▲ 1.84%
- F500 in state
- 20
Industry mix (Fortune 500 HQ in MO)
| Industry | F500 HQs | Revenue |
|---|---|---|
| Healthcare | 1 | $163B |
|
||
| Insurance | 1 | $21B |
|
||
| Industrial Technology | 1 | $17B |
|
||
| Retail | 1 | $16B |
|
||
| Industrial Distribution | 1 | $10B |
|
||
| Utilities | 1 | $9B |
|
||
Price history
+170.6% since first listed11 events — show timeline
- 2026-06-05 Pending — Heartland MLS as Distributed by MLS Grid
- 2026-06-04 Listed $239,500 Heartland MLS as Distributed by MLS Grid
- 2026-06-02 Price Changed $239,500 Heartland MLS as Distributed by MLS Grid
- 2026-05-04 Coming Soon $235,000 Heartland MLS as Distributed by MLS Grid
- 2012-06-04 Sold (Public Records) — Public Records
- 2012-05-30 Sold (MLS) — Heartland MLS as Distributed by MLS Grid
- 2012-04-17 Listed $88,500 Heartland MLS as Distributed by MLS Grid
- 2012-03-20 Listing Removed — Heartland MLS as Distributed by MLS Grid
- 2012-01-16 Listed $88,500 Heartland MLS as Distributed by MLS Grid
- 2006-02-13 Sold (Public Records) — Public Records
- 1973-06-18 Sold (Public Records) — Public Records
Property tax history
+6.7%/yrLatest (2025): $2,191 · -11.8% YoY. Source: county tax records.
Cash-flow waterfall
monthlySold comps — $/sqft
last 12 mo · ≤1 miLoading sold comps…