3919 Evergreen St · Prien, LA
Flood risk 6/10 · Moderate
- FEMA flood zone
- X (unshaded)
- Chance of flooding over 30 yrs
- 0.71%
- Est. flood insurance / yr
- $507 – $1,088
Fire risk 1/10 · Minimal
- Est. fire insurance / yr
- $1,269 – $2,357
Heat risk 9/10 · Severe
- Hot days now (above 109°F)
- 7 days/yr
- Hot days in 30 yrs
- 22 days/yr
Wind risk 9/10 · Severe
- Chance of severe wind over 30 yrs
- 99.0%
Air-quality risk 2/10 · Minimal
- Unhealthy air days now
- 1 days/yr
- Unhealthy air days in 30 yrs
- 1 days/yr
Risk factors via First Street. Map © Google.
Why this score? — see what drove the D grade
The composite is a weighted blend of 9 inputs, each scored 0–100. Each bar is that input's sub-score; the figure is the points it added to the 100-point composite (weight × sub-score).
- Cash flow +13.0/30.0
- ARV discount +7.2/15.0
- Rent growth +5.0/5.0
- DSCR +3.9/10.0
- Livability +3.2/5.0
- Schools +3.1/10.0
- 1% rule +2.6/10.0
- Condition / age +2.5/5.0
- Appreciation +0.0/10.0
$279,000
🖨 Deal sheet 📄 Offer letter ✓ Due diligence
Listing remarks
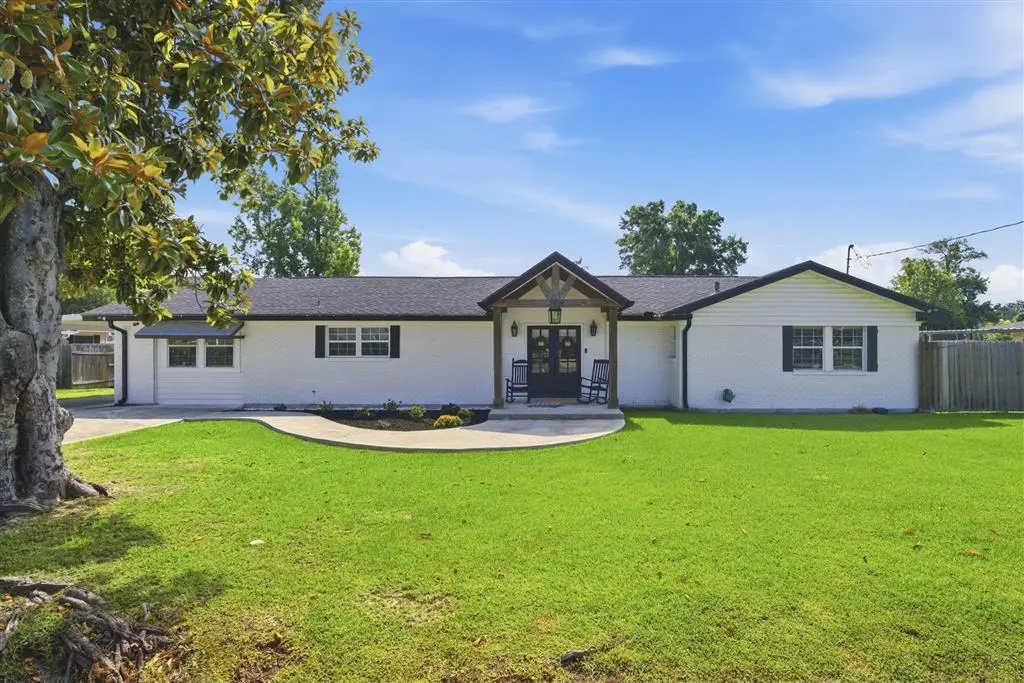
This beautifully updated, single-story ranch home perfectly blends modern amenities with classic comfort, offering spectacular curb appeal with its freshly painted white brick, striking black shutters, and an inviting timber-accented front porch. Inside, cohesive wood-look laminate flooring leads from a versatile double-door foyer and home office space into a stunning, open-concept layout centered around a chef's dream kitchen. The kitchen boasts a massive island with breakfast bar seating, soft blue and white cabinetry, a built-in wine rack, premium stainless steel appliances, and a classic farmhouse apron sink. Defined by a rustic wooden accent beam, the kitchen flows seamlessly into a sp
Key facts
- Massive island
- Updated ranch home
- Chef's dream kitchen
Tags
Property features AI
Exterior
- Parking: Attached covered carport (1 car); Open parking available (total 1 parking space)
- Security: Carbon monoxide detectors; Smoke detectors
- Utilities: Public water; Public sewer; Electricity connected; Water connected
- Home design: Single-family residence; One-story; House structure
- Construction: Brick construction; Slab foundation
- Exterior features: Covered front porch; Covered patio/porch; Privacy fencing; Shed on the property; Shingle roof; City lot with rectangular layout; Asphalt road frontage on a city street; Lot dimensions approximately 121' x 162'
Interior
- Kitchen: Dishwasher; Microwave; Oven; Range; Refrigerator
- Bedrooms: 4 bedrooms (all on the main level)
- Bathrooms: 2 full bathrooms (both on the main level)
- Heating & cooling: Central heating; Central air conditioning
- Interior features: Kitchen island; Open floor plan; Pantry
- Laundry & utility: Laundry room inside
Neighborhood map
What this means for you Summary
Snapshot
- This is a 4-bed/2.0-bath single-family listed at $279k.
Deal economics
- At list price, monthly cash flow is $-15 ($-180/yr) — negative.
- To cash-flow at today's rent, offer at most $276k (1.0% below list).
- To meet the 1% rule (rent ≥ 1% of price), the offer needs to be $212k (23.8% below list).
- Recommended offer: $212k (23.8% below list) — sets the bar for 1% rule.
- Cap rate 6.2% vs local median 4.7% in Prien — top-decile yield for the area; either an underpriced asset or a hidden risk that comps aren't pricing in. Stress-test before assuming the spread holds.
Location & tenants
- Location reads 64/100 on livability (#174 in LA) — a middle-class / working-renter tenant base. Strengths: employment A+, housing A+, crime A; Watch: amenities F, commute F, health & safety F.
- Calcasieu Parish (other): math 30% / reading 44% proficiency, ranked #29 of 98 in LA (top 30%) — families likely to look elsewhere, expect single-tenant / working-renter base with shorter leases.
- Zoned schools: Prien Lake Elementary School (math 60% / reading 68%, grade B, #45 of 646 statewide, top 7%, 671 students, 44% FRL); Alfred M. Barbe High School (math 41% / reading 56%, grade D, #41 of 265 statewide, top 16%, 1,991 students, 41% FRL).
- Zoned-school proficiency averages 56% at this address vs 37% district-wide (+19 pts) — the actual schools serving this property are materially stronger than the Calcasieu Parish average implies; a family-tenant draw the district grade alone would hide.
- Market conditions: Rents rising fast (+15.1%/yr); 456 active listings in the ZIP; 5 comparable units currently listed for rent nearby; rentals at typical pace (median 21d on market — plan ~3-4 weeks tenant-placement turnaround); 40% of comp listings sitting > 30 days — soft ceiling on asking rent; solid renter incomes; 1,298 units permitted in Calcasieu Parish in 2024 (526 in 5+ unit buildings).
Forward outlook
- Local home prices are declining (-3.0%/yr); year-one equity from $2k of loan paydown is wiped out by about $8k of value loss. Plan a longer hold.
- Calcasieu County population projected at +11% by 2050 — modest demand growth; plan on rents tracking national, not racing it.
Negotiation context
- It's been on market 15 days — a 2% lower offer ($275k) is reasonable based on typical stale-listing flexibility.
- Current owner paid $75k; list at $279k implies a 272% gain — meaningful room to come down on a strong offer.
Risks & watch-outs
- Climate carrying-cost: major flood risk; severe wind risk, 99% chance of damaging wind over 30y; extreme-heat days projected 7→22/yr by 2055 (HVAC capex compounding) — expect insurance premiums to compound above CPI over the hold.
Questions for the listing agent
- What do current leases actually rent for vs. the listed asking? Can we see a recent rent roll and the last 12 months of T-12 income?
- Built in 1964 — when were the roof, HVAC, electrical panel, plumbing, and water heater last replaced?
- Is there a deadline driving the sale (1031 exchange, divorce, estate, relocation)? That informs how much negotiation room exists.
- Schools are F-rated, which usually means shorter tenancies and higher turnover. Who's the typical renter profile here, and what's been the actual vacancy rate?
- The area grade is low — what's the realistic commute time and amenity access for the typical tenant pool here? Any planned neighborhood developments (good or bad) we should know about?
- What's the average days-on-market for RENTAL listings here right now (not sales)? A rising rental-DOM trend means longer vacancies and softer asking-rent achievability than the comps imply.
- What's the recent tenant-quality profile in this submarket — average credit score on applications, eviction rate, late-payment / NSF rate, and stable-employment percentage? A property-management company in the area should have these aggregated.
- How much new for-sale + rental construction is in the pipeline within 1–3 miles? Heavy new supply typically softens prices + rents 12–24 months out; constrained supply supports both.
Investment metrics
- 1% rule
- 0.76% ✗
- Cap rate
- 6.23%
- Cash-on-cash
- -0.23%
- DSCR
- 0.99
- GRM
- 10.9
CMA / ARV
- ARV (on-the-fly)
- $277,014
- Comps found
- 12
Show comp detail 12 sales within ~0.75 mi
| Address | Dist | Beds/Ba | Sqft | Sold | Price | $/sf | Match |
|---|---|---|---|---|---|---|---|
| 1922 Sarah Ln | 0.19mi | 4/2.0 | 1,996 (-1%) | 10mo | $315,000 | $158 | 81 |
| 4048 Woodcrest St | 0.22mi | 3/2.5 (-1) | 1,932 (-4%) | 11mo | $264,750 | $137 | 66 |
| 1717 Woodland Dr | 0.57mi | 4/2.0 | 2,132 (+5%) | 11mo | $259,500 | $122 | 55 |
| 4019 Cappy Dr | 0.51mi | 3/2.5 (-1) | 2,195 (+9%) | 1mo | $325,000 | $148 | 54 |
| 3525 Joan St | 0.49mi | 3/2.0 (-1) | 2,118 (+5%) | 13mo | $219,000 | $103 | 53 |
| 3605 E Whispering Woods Dr E | 0.64mi | 3/2.0 (-1) | 1,890 (-6%) | 5mo | $235,000 | $124 | 50 |
| 4202 Kingswood St | 0.46mi | 4/2.0 | 2,276 (+13%) | 11mo | $345,000 | $152 | 49 |
| 4124 W Jevon Ln W | 0.71mi | 3/2.5 (-1) | 2,132 (+5%) | 4mo | $350,000 | $164 | 48 |
| 2600 Timber Ln Ln | 0.51mi | 3/2.5 (-1) | 2,283 (+13%) | 3mo | $235,000 | $103 | 45 |
| 1602 Sarah Dr | 0.58mi | 3/2.0 (-1) | 1,734 (-14%) | 1mo | $260,000 | $150 | 44 |
| 1700 Woodland Dr | 0.64mi | 3/2.5 (-1) | 2,150 (+6%) | 12mo | $185,000 | $86 | 43 |
| 3915 Ken Dr | 0.63mi | 3/2.0 (-1) | 1,794 (-11%) | 15mo | $145,000 | $81 | 34 |
Match score weights: distance 35% · size 25% · config 20% · recency 20%. Top-matched comps best support the ARV.
Projected returns pro-forma
-3.0% appreciation · 8.0% rent growth · sell at horizon
- IRR
- -11.9%
- Equity multiple
- 0.55×
- Total profit
- $-35,050
- Equity at exit
- $41,600
- IRR
- 2.8%
- Equity multiple
- 1.24×
- Total profit
- $18,895
- Equity at exit
- $24,123
Cash invested: $78,120 (down + closing). Projections, not guarantees.
Landlord ↔ Tenant lean methodology
- Overall (STATE)
- 90 Strongly Landlord-Friendly
- State Louisiana
- 90 Strongly Landlord-Friendly · R+12
- County
- — inherits STATE
- City
- — inherits STATE
ZIP-level market 70605
- Rents YoY
- 15.1%
- Active inventory
- 456
- Price-to-rent
- 10.9×
Monthly cashflow live
- Estimated rent
- $2,125 medium interval (Pro) →
- Mortgage (P&I)
- −$1,463
- Tax from tax record
- −$114 /mo · $1,369/yr
- Insurance
- −$116
- HOA
- −$0
- Vacancy / Maint / Mgmt
- −$446
- Net cashflow
- $-15
Break-even live
UW: 25.0% down · 7.5% · 30yr · 1.5% tax · 5.0% vac · 8.0% maint · 8.0% mgmt
Financing live
Cash to close
- Down payment
- $69,750
- Closing costs
- $8,370
- Reserves months
- —
- Total cash needed
- —
Loan-product check · same deal, 3 products live
Conventional
25% down · 7.5% · 30yr
- Down + closing
- —
- Monthly P&I
- —
- Monthly cashflow
- —
- DSCR
- —
- Eligible?
- —
Personal DTI + credit; lowest rate.
DSCR
20% down · 8.5% · 30yr
- Down + closing
- —
- Monthly P&I
- —
- Monthly cashflow
- —
- DSCR
- —
- Eligible?
- —
No personal income docs; deal must DSCR.
Hard money
10% down · 12.0% · 12mo
- Down + closing
- —
- Monthly P&I
- —
- Monthly cashflow
- —
- DSCR
- —
- Eligible?
- —
Short-term bridge; refi at stabilization.
Rent comps 5 comps
| Address | Beds | Baths | Sqft | Rent | $/sqft | DOM | Units | Dist |
|---|---|---|---|---|---|---|---|---|
| 3708 Nelson Rd Lake Charles, LA | 3.0 | 2.0 | 2020 | $1,400 | $0.69 | 43d | 1 | 0.45mi |
| 3535 Knight Ln Unit 14 Lake Charles, LA | 3.0 | 2.5 | 1450 | $2,150 | $1.48 | 13d | 1 | 0.49mi |
| 4650 Nelson Rd Lake Charles, LA | 1.0–3.0 | 1.0–2.0 | 1032 | $1,875 | $1.82 | 13d | 24 | 0.82mi |
| 4326 Christina St Lake Charles, LA | 3.0 | 2.0 | 1600 | $1,770 | $1.11 | 21d | 1 | 0.94mi |
| 4607 W Prien Lake Rd Lake Charles, LA | 3.0 | 2.0 | 1530 | $3,500 | $2.29 | 43d | 1 | 1.50mi |
Listing history 13 events
-
2026-06-19days on market $279,000 Active 15 DOM
-
2026-06-18days on market $279,000 Active 14 DOM
-
2026-06-17days on market $279,000 Active 13 DOM
-
2026-06-16days on market $279,000 Active 12 DOM
-
2026-06-15days on market $279,000 Active 11 DOM
-
2026-06-14days on market $279,000 Active 9 DOM
-
2026-06-13pricedays on market $279,000 Active 8 DOM
-
2026-06-10days on market $285,000 Active 6 DOM
-
2026-06-09days on market $285,000 Active 5 DOM
-
2026-06-08days on market $285,000 Active 4 DOM
-
2026-06-07days on market $285,000 Active 3 DOM
-
2026-06-05remarks 699-char remark
-
2026-06-05$285,000 Active 1 DOM
ⓘ Source: listings_history table (triggers on properties + properties_extension) + one-shot
backfill from property_details.listing_events for pre-trigger history.
Tax reassessment forecast LA · Resets to sale price
- Current annual tax
- $1,369 · $114/mo
- Projected year-2 tax
- $1,534 · $128/mo
- Expected delta
- +$165/yr (+$14/mo · 12.1%)
ⓘ Screening estimate from a state-policy table — verify with the county assessor before closing.
Climate risk First Street
- Flood 6/10 Major FEMA zone X (unshaded) · 71% chance over 30 yrs
- Wildfire 1/10 Low
- Heat 9/10 Extreme 7 d/yr ≥109°F today · 22 d/yr by 30 yrs out
- Wind 9/10 Extreme 99% chance of damaging wind over 30 yrs
- Air quality 2/10 Low 1 unhealthy d/yr today · 1 by 30 yrs out
Nearby sold comps map
Loading sold comps map…
Walkable amenities ~0.75 mi
Loading nearby amenities…
Taxation est. · year 1
- Rental income
- $25,495
- − Mortgage interest
- −$15,628
- − Property taxes
- −$1,369
- − Insurance
- −$1,395
- − Repairs & maintenance
- −$2,040
- − Management
- −$2,040
- − Depreciation
- −$8,116
- Taxable loss
- −$5,093
- Est. tax savings @ 24.0%
- +$1,222
- After-tax cash flow
- $1,042/yr
For passive investors: Depreciation is non-cash, so a rental often shows a tax loss while cash-flowing — sheltering income. Rental losses are passive: they offset passive income freely, and up to $25,000/yr can offset ordinary (W-2) income if you actively participate and your MAGI is under $100k (phasing out to $0 by $150k); unused losses carry forward. On sale, claimed depreciation is recaptured at up to 25%, and gains may owe capital-gains tax (a 1031 exchange can defer both). Figures are a year-1 estimate at your 24.0% rate — not tax advice; consult a CPA.
Schools (NCES district)
- District
- Calcasieu Parish
- NCES district ID
- 2200330
- Math proficiency
- 30% ▼ -39.00%
- Reading proficiency
- 44% ▼ -33.00%
- Median HH income
- $44,700
- Composite
- 31.45/100
- National rank
- #5979
- State rank
- #29 of 98 in LA
Livability — Prien
- Score
- 64/100
- State rank
- #174
- US rank
- #14370
Category grades
Schools grade is shown separately in the Schools card above.
Census & demographics
- Census place
- Prien, LA
- County
- Calcasieu Parish · 170,889 people
- Metro
- Lake Charles, LA
- Population (ZIP)
- 40,482
- Household income
- $86,015
- Rent vs Own
- Severe rent burden
- 1328.0
Population outlook (Calcasieu County) Hauer SSP2
- Today (2025)
- 212,179 people
- By 2030
- 218,199 · +2.8%
- By 2040
- 228,486 · +7.7%
- By 2050
- 236,208 · +11.3%
- By 2075
- 251,696 · +18.6%
- By 2100
- 247,848 · +16.8%
Race, ethnicity, and origin ACS 2023
- Neighborhood character
- Predominantly White (79%)
- Race & ethnicity
- White 79% Black 10% Hispanic / Latino 6% Two or more races 6% Asian 3%
- Hispanic origin (detail)
- Mexican 2%
- Common ancestry
- Lithuanian 12% Italian 3% Slovak 2%
- Foreign-born
- 6% · Canada, Jamaica
- Languages at home
- 92% English-only · Spanish 4% Other Indo-European 2% Other Asian/Pacific 1%
Political lean MEDSL · Calcasieu
- 2024 margin
- Solid R (+39.6) · D 29.5% · R 69.0% · Other 1.5%
- 2008→2024 swing
- -15.0pp toward R · 2008: -24.6pp · 2024: -39.6pp
- All cycles
- 2024: R+39.6 2020: R+35.2 2016: R+33.3 2012: R+28.7 2008: R+24.6
Not yet ingested
- Civics
- —
Market trends
- HPI YoY
- ▼ -102.68%
- Current HPI
- 105.1903
- Rent YoY
- ▲ 15.10%
- Metro
- Lake Charles, LA
- State GDP YoY
- ▲ 3.29%
- F500 in state
- 10
Industry mix (Fortune 500 HQ in LA)
| Industry | F500 HQs | Revenue |
|---|---|---|
| Telecommunications | 2 | $23B |
|
||
| Utilities | 1 | $12B |
|
||
| Wholesale / Distribution | 1 | $5B |
|
||
| Advertising | 1 | $2B |
|
||
Price history
+280.0% since first listed2 events — show timeline
- 2026-06-04 Listed $285,000 SWLAR
- 2000-03-29 Sold (Public Records) $75,000 Public Records
Property tax history
+5.6%/yrLatest (2025): $1,369 · +2.5% YoY. Source: county tax records.
Cash-flow waterfall
monthlySold comps — $/sqft
last 12 mo · ≤1 miLoading sold comps…