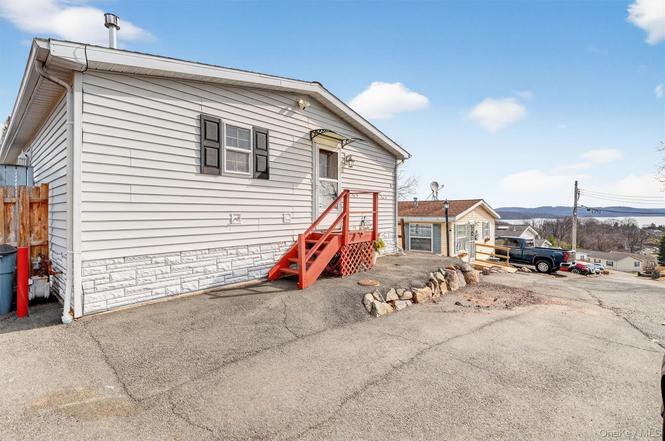
31 Thamsen Dr · Stony Point, NY
Flood risk 1/10 · Minimal
- FEMA flood zone
- X (unshaded)
- Chance of flooding over 30 yrs
- 0.0%
- Est. flood insurance / yr
- $473 – $860
Fire risk 2/10 · Minimal
- Est. fire insurance / yr
- $691 – $1,283
Heat risk 6/10 · Moderate
- Hot days now (above 100°F)
- 7 days/yr
- Hot days in 30 yrs
- 16 days/yr
Wind risk 4/10 · Minor
- Chance of severe wind over 30 yrs
- 21.0%
Air-quality risk 3/10 · Minor
- Unhealthy air days now
- 2 days/yr
- Unhealthy air days in 30 yrs
- 3 days/yr
Risk factors via First Street. Map © Google.
Why this score? — see what drove the D+ grade
The composite is a weighted blend of 9 inputs, each scored 0–100. Each bar is that input's sub-score; the figure is the points it added to the 100-point composite (weight × sub-score).
- Cash flow +14.4/30.0
- 1% rule +9.5/10.0
- ARV discount +6.5/15.0
- DSCR +4.4/10.0
- Schools +4.1/10.0
- Livability +3.5/5.0
- Rent growth +2.5/5.0
- Condition / age +2.5/5.0
- Appreciation +0.0/10.0
$230,999
🖨 Deal sheet 📄 Offer letter ✓ Due diligence
Listing remarks
Step in and step up your expectations! GORGEOUS 3 bedroom 2 bath 1700+ sq ft "Shamrock Model" sitting pretty with a river view and a rear yard. .. This humble abode is a manufactured home with a lot rent of $1200 (you would never know it is a manufactured home!) Features gleaming floors; an open kitchen! that is an absolute pleasure to cook in! Large Fridge dishwasher range and new double oven with counter space galore! Large living room with hight ceilings and a double slider that leads to a small slice of heaven! Large Deck paver walkway, fenced in and private! 3 large bedrooms with closets that offer storage organization! Large main bath and a gorgeous en-suite with a large wa
Key facts
- 4.92 acre lot
- Built 2002
- Listed 38 days
Property features AI
Finance
- HOA & community: Has association; Association fee of $1,200 per month; Association covers common area maintenance and snow removal; Additional monthly fee of $1,200 for lot rent
Exterior
- Parking: No carport; Other parking
- Utilities: Public sewer; Electricity connected (Orange & Rockland); Natural gas connected; Cable connected; Phone connected; Private trash collection
- Home design: Double wide manufactured home; Manufactured home property subtype; Actual property condition
- Construction: Manufactured house; Living area reported from plans
- Exterior features: Back yard; Corner lot; Landscaped yard; Near golf course; Near public transit; Near shops; Private setting; Secluded
Interior
- Kitchen: Cooktop; Oven; Dishwasher; Refrigerator
- Flooring: Carpet; Combination flooring; Other flooring
- Bathrooms: 2 full bathrooms
- Heating & cooling: Baseboard heating; Other heating; Central air conditioning; Has fireplace
- Interior features: Other interior features
- Laundry & utility: Washer hookup inside; Dryer hookup (gas); Laundry room
Neighborhood map
What this means for you Summary
Snapshot
- This is a 3-bed/2.0-bath manufactured listed at $231k.
Deal economics
- At list price, monthly cash flow is $45 ($545/yr) — positive.
- The deal already cash-flows at list — no discount required.
- Meets the 1% rule at list price ($3k rent vs $231k).
- Recommended offer: $224k (3.0% below list) — sets the bar for market timing.
- Cap rate 6.5% vs local median 2.6% in Stony Point — top-decile yield for the area; either an underpriced asset or a hidden risk that comps aren't pricing in. Stress-test before assuming the spread holds.
Location & tenants
- Location reads 70/100 on livability (#450 in NY) — a middle-class / working-renter tenant base. Strengths: employment A+, housing A+, health & safety A+; Watch: amenities F, commute F, cost of living F.
- Haverstraw-Stony Point CSD (North Rockland) (suburban): math 41% / reading 47% proficiency, ranked #427 of 590 in NY (top 72%) — families likely to look elsewhere, expect single-tenant / working-renter base with shorter leases.
- Zoned schools: Stony Point Elementary School (math 42% / reading 52%, grade D-, #1,195 of 2,108 statewide, top 60%, 725 students, 17% FRL); James A Farley Elementary School (math 36% / reading 51%, grade D, #366 of 729 statewide, top 51%, 538 students, 7% FRL); North Rockland High School (math 86% / reading 67%, grade A-, #612 of 1,100 statewide, top 56%, 2,687 students, 0% FRL) — zoned schools average 8% FRL vs 40% district-wide (32 pts lower); this property's tenant base skews higher-income than the district average.
- Market conditions: 89 active listings in the ZIP; 2 comparable units currently listed for rent nearby; 429 units permitted in Rockland County in 2024 (231 in 5+ unit buildings).
Forward outlook
- Local home prices are declining (-3.0%/yr); year-one equity from $2k of loan paydown is wiped out by about $7k of value loss. Plan a longer hold.
- Rockland County population projected at +7% by 2050 — modest demand growth; plan on rents tracking national, not racing it.
Negotiation context
- It's been on market 38 days — a 3% lower offer ($224k) is reasonable based on typical stale-listing flexibility.
- 2 sale attempts with the ask held roughly flat each time — persistent listings suggest the price (not the market) is what's stuck; bring a comps-based counter.
Risks & watch-outs
- Watch-outs: HOA is 36% of rent.
- Climate carrying-cost: extreme-heat days projected 7→16/yr by 2055 (HVAC capex compounding) — expect insurance premiums to compound above CPI over the hold.
Questions for the listing agent
- It's been on market 38 days. Have you received any prior offers? Is the seller open to a 3% concession, seller financing, or rate buy-down credit?
- What does the HOA fee cover, when was the last increase, and are there any pending special assessments or reserve-fund shortfalls?
- Is there a deadline driving the sale (1031 exchange, divorce, estate, relocation)? That informs how much negotiation room exists.
- The area grade is low — what's the realistic commute time and amenity access for the typical tenant pool here? Any planned neighborhood developments (good or bad) we should know about?
- What's the average days-on-market for RENTAL listings here right now (not sales)? A rising rental-DOM trend means longer vacancies and softer asking-rent achievability than the comps imply.
- What's the recent tenant-quality profile in this submarket — average credit score on applications, eviction rate, late-payment / NSF rate, and stable-employment percentage? A property-management company in the area should have these aggregated.
- How much new for-sale + rental construction is in the pipeline within 1–3 miles? Heavy new supply typically softens prices + rents 12–24 months out; constrained supply supports both.
Investment metrics
- 1% rule
- 1.45% ✓
- Cap rate
- 6.53%
- Cash-on-cash
- 0.84%
- DSCR
- 1.04
- GRM
- 5.7
CMA / ARV
- ARV (on-the-fly)
- $226,100
- Comps found
- 1
Show comp detail 1 sale within ~0.75 mi
| Address | Dist | Beds/Ba | Sqft | Sold | Price | $/sf | Match |
|---|---|---|---|---|---|---|---|
| 25 Thamsen Dr | 0.03mi | 3/2.0 | 1,700 (0%) | 7mo | $226,000 | $133 | 93 |
Match score weights: distance 35% · size 25% · config 20% · recency 20%. Top-matched comps best support the ARV.
Projected returns pro-forma
-3.0% appreciation · 3.0% rent growth · sell at horizon
- IRR
- -14.6%
- Equity multiple
- 0.48×
- Total profit
- $-33,868
- Equity at exit
- $34,443
- IRR
- -5.4%
- Equity multiple
- 0.64×
- Total profit
- $-23,036
- Equity at exit
- $19,973
Cash invested: $64,680 (down + closing). Projections, not guarantees.
Landlord ↔ Tenant lean methodology
- Overall (STATE)
- 15 Strongly Tenant-Friendly
- State New York
- 15 Strongly Tenant-Friendly · D+10
- County
- — inherits STATE
- City
- — inherits STATE
ZIP-level market 10980
- Active inventory
- 89
- Price-to-rent
- 5.7×
Monthly cashflow live
- Estimated rent
- $3,360 medium interval (Pro) →
- Mortgage (P&I)
- −$1,211
- Tax from tax record
- −$101 /mo · $1,215/yr
- Insurance
- −$96
- HOA
- −$1,200
- Vacancy / Maint / Mgmt
- −$706
- Net cashflow
- $45
Break-even live
UW: 25.0% down · 7.5% · 30yr · 1.5% tax · 5.0% vac · 8.0% maint · 8.0% mgmt
Financing live
Cash to close
- Down payment
- $57,750
- Closing costs
- $6,930
- Reserves months
- —
- Total cash needed
- —
Loan-product check · same deal, 3 products live
Conventional
25% down · 7.5% · 30yr
- Down + closing
- —
- Monthly P&I
- —
- Monthly cashflow
- —
- DSCR
- —
- Eligible?
- —
Personal DTI + credit; lowest rate.
DSCR
20% down · 8.5% · 30yr
- Down + closing
- —
- Monthly P&I
- —
- Monthly cashflow
- —
- DSCR
- —
- Eligible?
- —
No personal income docs; deal must DSCR.
Hard money
10% down · 12.0% · 12mo
- Down + closing
- —
- Monthly P&I
- —
- Monthly cashflow
- —
- DSCR
- —
- Eligible?
- —
Short-term bridge; refi at stabilization.
Rent comps 2 comps
| Address | Beds | Baths | Sqft | Rent | $/sqft | DOM | Units | Dist |
|---|---|---|---|---|---|---|---|---|
| 50 Rosetown Rd Tomkins Cove, NY | 2.0 | 1.0 | 1128 | $2,800 | $2.48 | 1d | 1 | 1.29mi |
| 79 Buckberg Rd Tomkins Cove, NY | 3.0 | 1.0 | 1500 | $3,800 | $2.53 | 7d | 1 | 1.35mi |
HOA detail
- Monthly dues
- $1,200 · $14,400/yr
Listing history 5 events
-
2026-04-20status Pending
-
2026-03-25price $230,999
-
2026-03-14status Active
-
2026-03-03$230,000 Active
-
2026-02-18historical $230,000
ⓘ Source: listings_history table (triggers on properties + properties_extension) + one-shot
backfill from property_details.listing_events for pre-trigger history.
Tax reassessment forecast NY · Partial reset (capped growth)
- Current annual tax
- $1,215 · $101/mo
- Projected year-2 tax
- $2,559 · $213/mo
- Expected delta
- +$1,344/yr (+$112/mo · 110.6%)
ⓘ Screening estimate from a state-policy table — verify with the county assessor before closing.
Climate risk First Street
- Flood 1/10 Low FEMA zone X (unshaded) · 0% chance over 30 yrs
- Wildfire 2/10 Low
- Heat 6/10 Major 7 d/yr ≥100°F today · 16 d/yr by 30 yrs out
- Wind 4/10 Moderate 21% chance of damaging wind over 30 yrs
- Air quality 3/10 Moderate 2 unhealthy d/yr today · 3 by 30 yrs out
Nearby sold comps map
Loading sold comps map…
Walkable amenities ~0.75 mi
Loading nearby amenities…
Taxation est. · year 1
- Rental income
- $40,318
- − Mortgage interest
- −$12,940
- − Property taxes
- −$1,215
- − Insurance
- −$1,155
- − Repairs & maintenance
- −$3,225
- − Management
- −$3,225
- − HOA
- −$14,400
- − Depreciation
- −$6,720
- Taxable loss
- −$2,562
- Est. tax savings @ 24.0%
- +$615
- After-tax cash flow
- $1,160/yr
For passive investors: Depreciation is non-cash, so a rental often shows a tax loss while cash-flowing — sheltering income. Rental losses are passive: they offset passive income freely, and up to $25,000/yr can offset ordinary (W-2) income if you actively participate and your MAGI is under $100k (phasing out to $0 by $150k); unused losses carry forward. On sale, claimed depreciation is recaptured at up to 25%, and gains may owe capital-gains tax (a 1031 exchange can defer both). Figures are a year-1 estimate at your 24.0% rate — not tax advice; consult a CPA.
Schools (NCES district)
- District
- Haverstraw-Stony Point CSD (North Rockland)
- NCES district ID
- 3614010
- Math proficiency
- 41% ▼ -7.00%
- Reading proficiency
- 47% ▼ -1.00%
- Median HH income
- $80,218
- Composite
- 40.68/100
- National rank
- #3672
- State rank
- #427 of 590 in NY
Livability — Stony Point
- Score
- 70/100
- State rank
- #450
- US rank
- #7882
Category grades
Schools grade is shown separately in the Schools card above.
Census & demographics
- Census place
- Stony Point, NY
- Population (ZIP)
- 13,793
Population outlook (Rockland County) Hauer SSP2
- Today (2025)
- 339,642 people
- By 2030
- 345,987 · +1.9%
- By 2040
- 357,178 · +5.2%
- By 2050
- 362,456 · +6.7%
- By 2075
- 367,281 · +8.1%
- By 2100
- 328,211 · -3.4%
Race, ethnicity, and origin ACS 2023
- Neighborhood character
- Diverse neighborhood (Simpson 0.60)
- Race & ethnicity
- White 58% Hispanic / Latino 22% Black 12% Two or more races 10% Asian 3%
- Hispanic origin (detail)
- Mexican 3% Puerto Rican 9% Dominican 8%
- Common ancestry
- Romanian 4% Hispanic 3% Scotch-Irish 1%
- Foreign-born
- 14% · Canada, Jamaica, China
- Languages at home
- 81% English-only · Spanish 12% French/Haitian/Cajun 3% Other Asian/Pacific 1%
Political lean MEDSL · Rockland
- 2024 margin
- R (+11.8) · D 44.1% · R 55.9%
- 2008→2024 swing
- -17.7pp toward R · 2008: 5.9pp · 2024: -11.8pp
- All cycles
- 2024: R+11.8 2020: D+1.7 2016: D+5.1 2012: D+6.6 2008: D+5.9
Not yet ingested
- Civics
- —
Market trends
- HPI YoY
- ▼ -459.52%
- Current HPI
- 243.4467
- Rent YoY
- —
- Metro
- —
- State GDP YoY
- ▲ 2.60%
- F500 in state
- 92
Industry mix (Fortune 500 HQ in NY)
| Industry | F500 HQs | Revenue |
|---|---|---|
| Financial Services | 10 | $950B |
|
||
| Consumer Goods | 9 | $162B |
|
||
| Insurance | 4 | $225B |
|
||
| Telecommunications | 2 | $144B |
|
||
| Pharmaceuticals | 2 | $112B |
|
||
| Media / Entertainment | 2 | $69B |
|
||
Price history
+0.4% since first listed5 events — show timeline
- 2026-04-20 Pending — OneKey® MLS as Distributed by MLS Grid
- 2026-03-25 Price Changed $230,999 OneKey® MLS as Distributed by MLS Grid
- 2026-03-14 Relisted — OneKey® MLS as Distributed by MLS Grid
- 2026-03-03 Listed $230,000 OneKey® MLS as Distributed by MLS Grid
- 2026-02-18 Coming Soon $230,000 OneKey® MLS as Distributed by MLS Grid
Property tax history
+11.7%/yrLatest (2022): $1,215 · +164.5% YoY. Source: county tax records.
Cash-flow waterfall
monthlySold comps — $/sqft
last 12 mo · ≤1 miLoading sold comps…