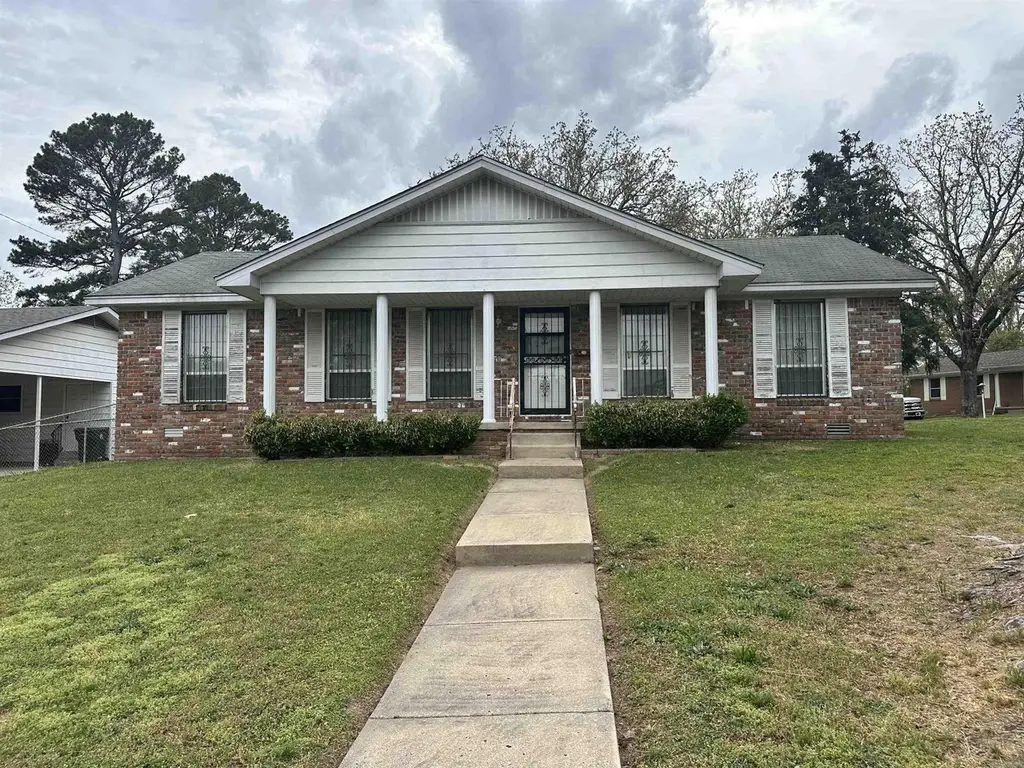
624 Poinsetta Dr · Little Rock, AR
Flood risk 1/10 · Minimal
- FEMA flood zone
- X (unshaded)
- Chance of flooding over 30 yrs
- 0.0%
- Est. flood insurance / yr
- $507 – $1,088
Fire risk 1/10 · Minimal
- Est. fire insurance / yr
- $1,499 – $2,785
Heat risk 6/10 · Moderate
- Hot days now (above 111°F)
- 7 days/yr
- Hot days in 30 yrs
- 19 days/yr
Wind risk 4/10 · Minor
- Chance of severe wind over 30 yrs
- 9.0%
Air-quality risk 2/10 · Minimal
- Unhealthy air days now
- 0 days/yr
- Unhealthy air days in 30 yrs
- 1 days/yr
Risk factors via First Street. Map © Google.
Why this score? — see what drove the C- grade
The composite is a weighted blend of 9 inputs, each scored 0–100. Each bar is that input's sub-score; the figure is the points it added to the 100-point composite (weight × sub-score).
- ARV discount +15.0/15.0
- Cash flow +14.9/30.0
- DSCR +4.6/10.0
- 1% rule +4.2/10.0
- Livability +3.7/5.0
- Rent growth +3.1/5.0
- Condition / age +2.5/5.0
- Schools +2.1/10.0
- Appreciation +0.0/10.0
$134,900
🖨 Deal sheet (PDF) 📄 Offer letter ✓ Due diligence
Listing remarks
INVESTORS! Look no further! This 2 bedroom 2 bath home sits on a large corner lot and is located in a really nice older subdivision and would make a great Rental Property to add to your portfolio or a great Fixer Upper! It has a formal living room and den, nice kitchen space with plenty of cabinets, bar seating, and a Side x Side refrigerator. A large outside carport also offers additional storage space and the laundry room, equipped with a dryer. It's within walking distance to the neighborhood park and pool as well as fine dining and shopping. This property won't last long! Schedule your showing today!!
Key facts
- Kitchen space
- Formal living room
- Den
Tags
Neighborhood map
What this means for you Summary
Snapshot
- This is a 2-bed/2.0-bath single-family listed at $135k.
Deal economics
- At list price, monthly cash flow is $40 ($486/yr) — positive.
- The deal already cash-flows at list — no discount required.
- To meet the 1% rule (rent ≥ 1% of price), the offer needs to be $124k (8.4% below list).
- Recommended offer: $124k (8.4% below list) — sets the bar for 1% rule.
- Cap rate 6.7% vs local median 4.1% in Little Rock — top-decile yield for the area; either an underpriced asset or a hidden risk that comps aren't pricing in. Stress-test before assuming the spread holds.
Location & tenants
- Location reads 73/100 on livability (#22 in AR) — a middle-class / working-renter tenant base. Strengths: commute A+, cost of living A+, housing A+; Watch: crime F.
- Little Rock School District (urban): math 23% / reading 26% proficiency, ranked #183 of 238 in AR (top 77%) — low school quality limits family demand, transient renter base, plan for 1-2y turnover; 69% free/reduced lunch — lower-income household profile, screen leases tightly.
- Zoned schools: Mcdermott Elementary School (math 8% / reading 12%, grade F, #429 of 454 statewide, top 96%, 296 students, 92% FRL); Central High School (math 32% / reading 42%, grade F, #64 of 292 statewide, top 26%, 2,338 students, 53% FRL) — zoned schools at 73% FRL track the district average.
- Market conditions: Rents rising (+2.4%/yr); 123 active listings in the ZIP; 40 comparable units currently listed for rent nearby; rentals at typical pace (median 25d on market — plan ~3-4 weeks tenant-placement turnaround); 48% of comp listings sitting > 30 days — soft ceiling on asking rent; 1,006 units permitted in Pulaski County in 2024 (0 in 5+ unit buildings).
Forward outlook
- Local home prices are declining (-3.0%/yr); year-one equity from $933 of loan paydown is wiped out by about $4k of value loss. Plan a longer hold.
- Pulaski County population projected at +6% by 2050 — modest demand growth; plan on rents tracking national, not racing it.
Negotiation context
- Only 7 days on market — expect competitive offers; lowballing is unlikely to land.
Risks & watch-outs
- Climate carrying-cost: extreme-heat days projected 7→19/yr by 2055 (HVAC capex compounding) — expect insurance premiums to compound above CPI over the hold.
Questions for the listing agent
- Built in 1965 — when were the roof, HVAC, electrical panel, plumbing, and water heater last replaced?
- What does the HOA fee cover, when was the last increase, and are there any pending special assessments or reserve-fund shortfalls?
- Is there a deadline driving the sale (1031 exchange, divorce, estate, relocation)? That informs how much negotiation room exists.
- Crime grade is F in this area — have there been break-ins, vandalism, or insurance claims at this property in the last 3 years? What carrier currently insures it and at what premium?
- What's the average days-on-market for RENTAL listings here right now (not sales)? A rising rental-DOM trend means longer vacancies and softer asking-rent achievability than the comps imply.
- What's the recent tenant-quality profile in this submarket — average credit score on applications, eviction rate, late-payment / NSF rate, and stable-employment percentage? A property-management company in the area should have these aggregated.
- How much new for-sale + rental construction is in the pipeline within 1–3 miles? Heavy new supply typically softens prices + rents 12–24 months out; constrained supply supports both.
Investment metrics
- 1% rule
- 0.92% ✗
- Cap rate
- 6.65%
- Cash-on-cash
- 1.29%
- DSCR
- 1.06
- GRM
- 9.1
CMA / ARV
- ARV (on-the-fly)
- $197,100
- Comps found
- 12
Show comp detail 12 sales within ~0.75 mi
| Address | Dist | Beds/Ba | Sqft | Sold | Price | $/sf | Match |
|---|---|---|---|---|---|---|---|
| 624 Poinsetta Dr | 0.00mi | 2/2.0 | 1,318 (-2%) | 1mo | $115,000 | $87 | 95 |
| 319 Poinsetta Dr | 0.19mi | 3/2.0 (+1) | 1,402 (+4%) | 0mo | $239,000 | $170 | 79 |
| 3 Pyeatt Cir | 0.07mi | 3/2.0 (+1) | 1,215 (-10%) | 2mo | $218,000 | $179 | 73 |
| 9904 Snider Ct | 0.20mi | 3/2.0 (+1) | 1,457 (+8%) | 3mo | $195,000 | $134 | 70 |
| 9815 Brooks Ln | 0.22mi | 3/2.0 (+1) | 1,221 (-10%) | 2mo | $178,000 | $146 | 68 |
| 12 Serenity Dr | 0.55mi | 3/2.0 (+1) | 1,368 (+1%) | 2mo | $174,900 | $128 | 65 |
| 1209 Southedge Dr | 0.33mi | 3/2.0 (+1) | 1,488 (+10%) | 1mo | $187,000 | $126 | 62 |
| 26 Warwick Rd | 0.51mi | 3/2.0 (+1) | 1,407 (+4%) | 3mo | $234,000 | $166 | 62 |
| 8508 N Rodney Parham | 0.72mi | 3/2.0 (+1) | 1,335 (-1%) | 3mo | $161,000 | $121 | 57 |
| 318 Ellis Dr | 0.32mi | 3/1.5 (+1) | 1,160 (-14%) | 0mo | $177,000 | $153 | 54 |
| 9304 6th St | 0.72mi | 3/2.0 (+1) | 1,313 (-3%) | 3mo | $113,000 | $86 | 54 |
| 302 Oak Ln | 0.54mi | 3/2.0 (+1) | 1,213 (-10%) | 1mo | $210,000 | $173 | 52 |
Match score weights: distance 35% · size 25% · config 20% · recency 20%. Top-matched comps best support the ARV.
Projected returns pro-forma
-3.0% appreciation · 2.4% rent growth · sell at horizon
- IRR
- -14.9%
- Equity multiple
- 0.47×
- Total profit
- $-20,001
- Equity at exit
- $20,114
- IRR
- -7.3%
- Equity multiple
- 0.55×
- Total profit
- $-17,018
- Equity at exit
- $11,664
Cash invested: $37,772 (down + closing). Projections, not guarantees.
Landlord ↔ Tenant lean methodology
- Overall (STATE)
- 92 Strongly Landlord-Friendly
- State Arkansas
- 92 Strongly Landlord-Friendly · R+14
- County
- — inherits STATE
- City
- — inherits STATE
ZIP-level market 72205
- Rents YoY
- 2.4%
- Active inventory
- 123
- Price-to-rent
- 9.1×
Monthly cashflow live
- Estimated rent
- $1,236 high interval (Pro) →
- Mortgage (P&I)
- −$707
- Tax from tax record
- −$157 /mo · $1,888/yr
- Insurance
- −$56
- HOA
- −$15
- Vacancy / Maint / Mgmt
- −$260
- Net cashflow
- $40
Break-even live
Sensitivity live
| Price | -10% $117 | -5% $79 | +0% $40 | +5% $2 | +10% $-36 |
|---|---|---|---|---|---|
| Rent | -10% $-57 | -5% $-8 | +0% $40 | +5% $89 | +10% $138 |
| Rate | -1.0pp $108 | -0.5pp $75 | base $40 | +0.5pp $6 | +1.0pp $-30 |
UW: 25.0% down · 7.5% · 30yr · 1.5% tax · 5.0% vac · 8.0% maint · 8.0% mgmt
Financing live
Cash to close
- Down payment
- $33,725
- Closing costs
- $4,047
- Reserves months
- —
- Total cash needed
- —
Loan-product check · same deal, 3 products live
Conventional
25% down · 7.5% · 30yr
- Down + closing
- —
- Monthly P&I
- —
- Monthly cashflow
- —
- DSCR
- —
- Eligible?
- —
Personal DTI + credit; lowest rate.
DSCR
20% down · 8.5% · 30yr
- Down + closing
- —
- Monthly P&I
- —
- Monthly cashflow
- —
- DSCR
- —
- Eligible?
- —
No personal income docs; deal must DSCR.
Hard money
10% down · 12.0% · 12mo
- Down + closing
- —
- Monthly P&I
- —
- Monthly cashflow
- —
- DSCR
- —
- Eligible?
- —
Short-term bridge; refi at stabilization.
Rent comps 40 comps
| Address | Beds | Baths | Sqft | Rent | $/sqft | DOM | Units | Dist |
|---|---|---|---|---|---|---|---|---|
| 9910 Brooks Ln Little Rock, AR | 3.0 | 2.0 | 1140 | $1,450 | $1.27 | 45d | 1 | 0.25mi |
| 8 Towne Park Ct #10 Little Rock, AR | 2.0 | 2.0 | 1061 | $975 | $0.92 | 45d | 1 | 0.28mi |
| 13 Rosemunn Dr Little Rock, AR | 2.0 | 1.5 | 992 | $895 | $0.90 | 45d | 1 | 0.33mi |
| 101 Ellis Dr Unit D Little Rock, AR | 2.0 | 1.0 | 904 | $925 | $1.02 | 25d | 1 | 0.39mi |
| 101 Ellis Dr Little Rock, AR | 2.0 | 1.5 | 904 | $925 | $1.02 | 25d | 1 | 0.39mi |
| 10006 Raymond Dr Little Rock, AR | 3.0 | 1.5 | 1450 | $1,400 | $0.97 | 45d | 1 | 0.40mi |
| 6 Brookside Cir Little Rock, AR | 3.0 | 2.0 | 1700 | $1,695 | $1.00 | 25d | 1 | 0.43mi |
| 1400 Old Forge Dr Little Rock, AR | 1.0–3.0 | 1.0–2.5 | 995 | $1,002 | $1.01 | 23d | 16 | 0.44mi |
| 16 Warwick Rd Little Rock, AR | 3.0 | 2.0 | 1580 | $1,650 | $1.04 | 45d | 1 | 0.50mi |
| 51 Wolfbridge Lop Little Rock, AR | 3.0 | 3.0 | 1497 | $1,700 | $1.14 | 23d | 1 | 0.52mi |
| 1001 Breckenridge Dr Little Rock, AR | 2.0 | 1.5 | 909 | $950 | $1.05 | 45d | 1 | 0.55mi |
| 319 Oak Ln Little Rock, AR | 3.0 | 2.0 | 1484 | $1,481 | $1.00 | 45d | 1 | 0.59mi |
| 320 Nebling Rd Unit B Little Rock, AR | 2.0 | 1.5 | 1110 | $995 | $0.90 | 45d | 1 | 0.62mi |
| 9324 Northedge Rd Little Rock, AR | 3.0 | 2.0 | 1435 | $1,600 | $1.11 | 45d | 1 | 0.63mi |
| 1807 Sanford Dr #3 Little Rock, AR | 2.0 | 1.0 | 1056 | $1,100 | $1.04 | 25d | 1 | 0.71mi |
| 1807 Sanford Dr Little Rock, AR | 2.0 | 1.0 | 1056 | $1,200 | $1.14 | 25d | 1 | 0.71mi |
| 1812 Sanford Dr Little Rock, AR | 2.0 | 1.0 | 961 | $995 | $1.04 | 21d | 1 | 0.72mi |
| 1812 Sanford Dr Little Rock, AR | 2.0 | 1.0 | 961 | $995 | $1.04 | 45d | 1 | 0.72mi |
| 1813 Sanford Dr Little Rock, AR | 2.0 | 1.0 | 1056 | $1,100 | $1.04 | 25d | 1 | 0.73mi |
| 1820 Sanford Dr Unit 4 Little Rock, AR | 2.0 | 1.5 | 1170 | $1,300 | $1.11 | 25d | 1 | 0.74mi |
| 1821 Sanford Dr Little Rock, AR | 2.0 | 1.5 | 976 | $925 | $0.95 | 25d | 1 | 0.74mi |
| 9007 Cloverhill Rd Little Rock, AR | 3.0 | 2.0 | 1270 | $1,395 | $1.10 | 45d | 1 | 0.74mi |
| 1812 Reservoir Rd Little Rock, AR | 1.0–3.0 | 1.0–2.0 | 973 | $890 | $0.91 | 16d | 17 | 0.76mi |
| 1901 Sanford Dr Little Rock, AR | 2.0 | 1.5 | 976 | $975 | $1.00 | 25d | 1 | 0.76mi |
| 1912 Sanford Dr Unit 2 Little Rock, AR | 2.0 | 1.5 | 1100 | $1,500 | $1.36 | 45d | 1 | 0.78mi |
| 1912 Sanford Dr Little Rock, AR | 2.0 | 1.5 | 1100 | $1,475 | $1.34 | 23d | 1 | 0.78mi |
| 1809 Reservoir Rd #19 Little Rock, AR | 2.0 | 1.5 | 1122 | $1,095 | $0.98 | 23d | 1 | 0.80mi |
| 10901 Mara Lynn Rd Little Rock, AR | 2.0 | 1.0 | 1000 | $1,050 | $1.05 | 45d | 1 | 0.80mi |
| 2018 Sanford Dr Unit 07 Little Rock, AR | 2.0 | 1.0 | 950 | $775 | $0.82 | 45d | 1 | 0.87mi |
| 28 Pleasant Cv Little Rock, AR | 3.0 | 2.0 | 1444 | $1,500 | $1.04 | 25d | 1 | 0.88mi |
| 11124 Mara Lynn Rd Unit D Little Rock, AR | 2.0 | 1.0 | 1000 | $725 | $0.72 | 45d | 1 | 0.94mi |
| 8120 W Markham St Unit 2 Little Rock, AR | 2.0 | 1.5 | 1000 | $950 | $0.95 | 45d | 1 | 0.96mi |
| 8120 W Markham St Unit 2 Little Rock, AR | 2.0 | 1.5 | 950 | $950 | $1.00 | 25d | 1 | 0.96mi |
| 1601 N Shackleford Rd Little Rock, AR | 1.0–2.0 | 1.0–2.0 | 748 | $990 | $1.32 | 23d | 10 | 1.00mi |
| 18 Cobble Hill Rd Little Rock, AR | 3.0 | 2.0 | 1515 | $2,500 | $1.65 | 25d | 1 | 1.10mi |
| 2221 Wentwood Valley Dr Little Rock, AR | 3.0 | 2.0 | 1247 | $1,372 | $1.10 | 45d | 2 | 1.16mi |
| 2221 Wentwood Valley Dr Apt 48 Little Rock, AR | 3.0 | 2.0 | 1226 | $1,395 | $1.14 | 21d | 1 | 1.16mi |
| 508 Green Mountain Cir #80 Little Rock, AR | 2.0 | 2.0 | 1060 | $1,060 | $1.00 | 45d | 1 | 1.22mi |
| 101 Hiawatha Dr Little Rock, AR | 3.0 | 1.5 | 1251 | $1,250 | $1.00 | 45d | 1 | 1.23mi |
| 801 S Rodney Parham Rd Little Rock, AR | 1.0–2.0 | 1.0–2.0 | 886 | $900 | $1.02 | 16d | 10 | 1.25mi |
HOA detail
- Monthly dues
- $15 · $180/yr
- Likely covers
- pool
Listing history 2 events
-
2026-04-21status Under Contract
-
2026-04-13$134,900 New Listing
ⓘ Source: listings_history table (triggers on properties + properties_extension) + one-shot
backfill from property_details.listing_events for pre-trigger history.
Tax reassessment forecast AR · Resets to sale price
- Current annual tax
- $1,888 · $157/mo
- Projected year-2 tax
- $1,888 · $157/mo
- Expected delta
- $0/yr ($0/mo · 0.0%)
ⓘ Screening estimate from a state-policy table — verify with the county assessor before closing.
Climate risk First Street
- Flood 1/10 Low FEMA zone X (unshaded) · 0% chance over 30 yrs
- Wildfire 1/10 Low
- Heat 6/10 Major 7 d/yr ≥111°F today · 19 d/yr by 30 yrs out
- Wind 4/10 Moderate 9% chance of damaging wind over 30 yrs
- Air quality 2/10 Low 0 unhealthy d/yr today · 1 by 30 yrs out
Nearby sold comps map
Loading sold comps map…
Walkable amenities ~0.75 mi
Loading nearby amenities…
Taxation est. · year 1
- Rental income
- $14,832
- − Mortgage interest
- −$7,556
- − Property taxes
- −$1,888
- − Insurance
- −$674
- − Repairs & maintenance
- −$1,187
- − Management
- −$1,187
- − HOA
- −$180
- − Depreciation
- −$3,924
- Taxable loss
- −$1,764
- Est. tax savings @ 24.0%
- +$423
- After-tax cash flow
- $909/yr
For passive investors: Depreciation is non-cash, so a rental often shows a tax loss while cash-flowing — sheltering income. Rental losses are passive: they offset passive income freely, and up to $25,000/yr can offset ordinary (W-2) income if you actively participate and your MAGI is under $100k (phasing out to $0 by $150k); unused losses carry forward. On sale, claimed depreciation is recaptured at up to 25%, and gains may owe capital-gains tax (a 1031 exchange can defer both). Figures are a year-1 estimate at your 24.0% rate — not tax advice; consult a CPA.
Schools (NCES district)
- District
- Little Rock School District
- NCES district ID
- 0509000
- Math proficiency
- 23% ▼ -12.00%
- Reading proficiency
- 26% ▼ -8.00%
- Median HH income
- $43,346
- Composite
- 21.0/100
- National rank
- #8457
- State rank
- #183 of 238 in AR
Livability — Little Rock
- Score
- 73/100
- State rank
- #22
- US rank
- #5295
Category grades
Schools grade is shown separately in the Schools card above.
Census & demographics
- Census place
- Little Rock, AR
- County
- Pulaski County · 372,764 people
- City population
- 218,896
- Metro
- Little Rock-North Little Rock-Conway, AR
- Population (ZIP)
- 23,043
- Household income
- $68,415
- Rent vs Own
- Severe rent burden
- 1073.0
Population outlook (Pulaski County) Hauer SSP2
- Today (2025)
- 415,378 people
- By 2030
- 423,720 · +2.0%
- By 2040
- 435,182 · +4.8%
- By 2050
- 440,904 · +6.1%
- By 2075
- 445,521 · +7.3%
- By 2100
- 419,173 · +0.9%
Race, ethnicity, and origin ACS 2023
- Neighborhood character
- Majority White (64%)
- Race & ethnicity
- White 64% Black 26% Two or more races 4% Hispanic / Latino 3% Asian 3%
- Common ancestry
- Italian 5% Slovak 3% Lithuanian 1%
- Foreign-born
- 4% · Canada
- Languages at home
- 93% English-only · Spanish 3% Tagalog/Filipino 1% Other Indo-European 1%
Political lean MEDSL · Pulaski
- 2024 margin
- Strong D (+22.1) · D 59.8% · R 37.7% · Other 2.5%
- 2008→2024 swing
- +10.6pp toward D · 2008: 11.6pp · 2024: 22.1pp
- All cycles
- 2024: D+22.1 2020: D+22.5 2016: D+17.9 2012: D+11.4 2008: D+11.6
Not yet ingested
- Civics
- —
Market trends
- HPI YoY
- ▼ -243.61%
- Current HPI
- 215.0083
- Rent YoY
- ▲ 2.40%
- Metro
- Little Rock-North Little Rock-Conway, AR
- State GDP YoY
- ▲ 3.80%
- F500 in state
- 10
Industry mix (Fortune 500 HQ in AR)
| Industry | F500 HQs | Revenue |
|---|---|---|
| Retail | 1 | $681B |
|
||
| Food / Agriculture | 1 | $53B |
|
||
| Retail / Energy | 1 | $22B |
|
||
| Transportation / Logistics | 1 | $12B |
|
||
| Energy | 1 | $4B |
|
||
Price history
2 events — show timeline
- 2026-04-21 Pending — CARMLS
- 2026-04-13 Listed $134,900 CARMLS
Property tax history
+1.0%/yrLatest (2025): $1,888 · +0.0% YoY. Source: county tax records.
Cash-flow waterfall
monthlySold comps — $/sqft
last 12 mo · ≤1 miLoading sold comps…