2495 Culver Rd · Irondequoit, NY
Flood risk 1/10 · Minimal
- FEMA flood zone
- X (unshaded)
- Chance of flooding over 30 yrs
- 0.0%
- Est. flood insurance / yr
- $473 – $860
Fire risk 1/10 · Minimal
- Est. fire insurance / yr
- $691 – $1,283
Heat risk 2/10 · Minimal
- Hot days now (above 95°F)
- 7 days/yr
- Hot days in 30 yrs
- 16 days/yr
Wind risk 1/10 · Minimal
- Chance of severe wind over 30 yrs
- —
Air-quality risk 2/10 · Minimal
- Unhealthy air days now
- 1 days/yr
- Unhealthy air days in 30 yrs
- 2 days/yr
Risk factors via First Street. Map © Google.
Why this score? — see what drove the B+ grade
The composite is a weighted blend of 9 inputs, each scored 0–100. Each bar is that input's sub-score; the figure is the points it added to the 100-point composite (weight × sub-score).
- Cash flow +27.8/30.0
- ARV discount +15.0/15.0
- DSCR +9.8/10.0
- 1% rule +7.6/10.0
- Rent growth +4.5/5.0
- Livability +4.0/5.0
- Schools +3.7/10.0
- Condition / age +2.5/5.0
- Appreciation +0.0/10.0
$139,900
🖨 Deal sheet 📄 Offer letter ✓ Due diligence
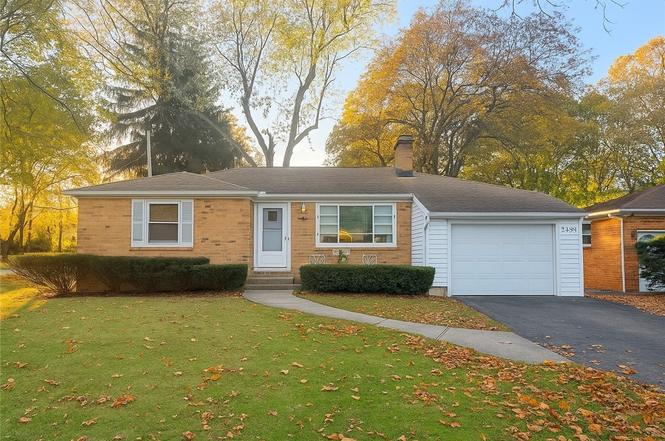
Listing remarks MLS
3 bed 1 bath ranch on Culver Road right off of 104! Property is vacant and easy to show. Call or text today!
Key facts
- 0.29 acre lot
- Garage
- Built 1950
Neighborhood map
What this means for you Summary
Snapshot
- This is a 3-bed/1.0-bath single-family listed at $140k.
Deal economics
- At list price, monthly cash flow is $428 ($5k/yr) — positive.
- The deal already cash-flows at list — no discount required.
- Meets the 1% rule at list price ($2k rent vs $140k).
- Recommended offer: $138k (1.5% below list) — sets the bar for market timing.
- Cap rate 10.0% vs local median 4.5% in Irondequoit — top-decile yield for the area; either an underpriced asset or a hidden risk that comps aren't pricing in. Stress-test before assuming the spread holds.
Location & tenants
- Location reads 81/100 on livability (#92 in NY, #1,414 nationally) — a professional / high-income tenant draw. Strengths: housing A+, health & safety A+, crime B+; Watch: amenities F.
- East Irondequoit Central School District (suburban): math 40% / reading 47% proficiency, ranked #475 of 590 in NY (top 80%) — families likely to look elsewhere, expect single-tenant / working-renter base with shorter leases.
- Market conditions: Rents rising fast (+7.9%/yr); 199 active listings in the ZIP; 23 comparable units currently listed for rent nearby; rentals leasing fast (median 11d on market — plan ~1-2 weeks tenant-placement turnaround); 1,169 units permitted in Monroe County in 2024 (591 in 5+ unit buildings).
- This rent runs 33% of the median local income ($65k/yr) — at the standard rent-burdened threshold; future hikes will face affordability resistance.
Forward outlook
- Local home prices are declining (-3.0%/yr); year-one equity from $967 of loan paydown is wiped out by about $4k of value loss. Plan a longer hold.
- Monroe County population projected to shrink 6% by 2050 — rents likely to lag national; underwrite the cash flow, not the appreciation.
- At projected returns (-3.0% appreciation + 7.9% rent growth), your $39k cash investment doubles in ~7 years — after that, you're playing with house money.
Negotiation context
- It's been on market 22 days — a 2% lower offer ($138k) is reasonable based on typical stale-listing flexibility.
- 3 sale attempts since 8y ago with the ask held roughly flat each time — persistent listings suggest the price (not the market) is what's stuck; bring a comps-based counter.
- Current owner paid $91k; list at $140k implies a 54% gain — meaningful room to come down on a strong offer.
Risks & watch-outs
- Watch-outs: built in 1950 — expect roof / HVAC / electrical / plumbing capex.
Questions for the listing agent
- Built in 1950 — when were the roof, HVAC, electrical panel, plumbing, and water heater last replaced?
- Is there a deadline driving the sale (1031 exchange, divorce, estate, relocation)? That informs how much negotiation room exists.
- Schools are B-rated — typically a magnet for longer-tenancy family renters. What's the average tenant stay here, and is there a school-zone premium baked into asking?
- What's the average days-on-market for RENTAL listings here right now (not sales)? A rising rental-DOM trend means longer vacancies and softer asking-rent achievability than the comps imply.
- What's the recent tenant-quality profile in this submarket — average credit score on applications, eviction rate, late-payment / NSF rate, and stable-employment percentage? A property-management company in the area should have these aggregated.
- How much new for-sale + rental construction is in the pipeline within 1–3 miles? Heavy new supply typically softens prices + rents 12–24 months out; constrained supply supports both.
Investment metrics
- 1% rule
- 1.26% ✓
- Cap rate
- 9.97%
- Cash-on-cash
- 13.12%
- DSCR
- 1.58
- GRM
- 6.6
CMA / ARV
- ARV (on-the-fly)
- $193,050
- Comps found
- 12
Show comp detail 12 sales within ~0.75 mi
| Address | Dist | Beds/Ba | Sqft | Sold | Price | $/sf | Match |
|---|---|---|---|---|---|---|---|
| 74 Heberle Rd | 0.14mi | 2/1.0 (-1) | 1,065 (-9%) | 2mo | $225,000 | $211 | 72 |
| 165 Heberton Rd | 0.40mi | 3/2.0 | 1,146 (-2%) | 4mo | $200,000 | $175 | 70 |
| 276 Wahl Rd | 0.41mi | 3/2.0 | 1,223 (+4%) | 2mo | $314,700 | $257 | 67 |
| 938 Whitlock Rd | 0.19mi | 3/1.0 | 1,008 (-14%) | 4mo | $195,000 | $193 | 64 |
| 443 Crossfield Rd | 0.18mi | 2/1.0 (-1) | 1,001 (-14%) | 2mo | $165,000 | $165 | 61 |
| 50 Bennett Ave | 0.60mi | 3/1.0 | 1,224 (+5%) | 4mo | $134,000 | $109 | 61 |
| 439 Crossfield Rd | 0.18mi | 2/1.0 (-1) | 1,006 (-14%) | 3mo | $145,000 | $144 | 61 |
| 241 Knapp Ave | 0.63mi | 3/1.0 | 1,088 (-7%) | 4mo | $175,000 | $161 | 56 |
| 59 Angelus Dr | 0.51mi | 3/2.0 | 1,286 (+10%) | 2mo | $330,000 | $257 | 54 |
| 109 Crossfield Rd | 0.64mi | 3/1.5 | 1,279 (+9%) | 4mo | $157,000 | $123 | 49 |
| 1863 Norton St | 0.61mi | 4/1.0 (+1) | 1,326 (+13%) | 1mo | $155,000 | $117 | 43 |
| 298 Fieldwood Dr | 0.68mi | 4/2.0 (+1) | 1,320 (+13%) | 2mo | $193,000 | $146 | 36 |
Match score weights: distance 35% · size 25% · config 20% · recency 20%. Top-matched comps best support the ARV.
Projected returns pro-forma
-3.0% appreciation · 7.89% rent growth · sell at horizon
- IRR
- 8.5%
- Equity multiple
- 1.35×
- Total profit
- $13,750
- Equity at exit
- $20,860
- IRR
- 21.5%
- Equity multiple
- 3.26×
- Total profit
- $88,604
- Equity at exit
- $12,096
Cash invested: $39,172 (down + closing). Projections, not guarantees.
Landlord ↔ Tenant lean methodology
- Overall (STATE)
- 15 Strongly Tenant-Friendly
- State New York
- 15 Strongly Tenant-Friendly · D+10
- County
- — inherits STATE
- City
- — inherits STATE
ZIP-level market 14609
- Home prices YoY
- -30.4%
- Rents YoY
- 7.9%
- Active inventory
- 199
- Price-to-rent
- 6.6×
Monthly cashflow live
- Estimated rent
- $1,766 high interval (Pro) →
- Mortgage (P&I)
- −$734
- Tax est. 1.5%
- −$175 /mo · $2,098/yr
- Insurance
- −$58
- HOA
- −$0
- Vacancy / Maint / Mgmt
- −$371
- Net cashflow
- $428
Break-even live
UW: 25.0% down · 7.5% · 30yr · 1.5% tax · 5.0% vac · 8.0% maint · 8.0% mgmt
Financing live
Cash to close
- Down payment
- $34,975
- Closing costs
- $4,197
- Reserves months
- —
- Total cash needed
- —
Loan-product check · same deal, 3 products live
Conventional
25% down · 7.5% · 30yr
- Down + closing
- —
- Monthly P&I
- —
- Monthly cashflow
- —
- DSCR
- —
- Eligible?
- —
Personal DTI + credit; lowest rate.
DSCR
20% down · 8.5% · 30yr
- Down + closing
- —
- Monthly P&I
- —
- Monthly cashflow
- —
- DSCR
- —
- Eligible?
- —
No personal income docs; deal must DSCR.
Hard money
10% down · 12.0% · 12mo
- Down + closing
- —
- Monthly P&I
- —
- Monthly cashflow
- —
- DSCR
- —
- Eligible?
- —
Short-term bridge; refi at stabilization.
Rent comps 23 comps
| Address | Beds | Baths | Sqft | Rent | $/sqft | DOM | Units | Dist |
|---|---|---|---|---|---|---|---|---|
| 2450 Culver Rd Rochester, NY | 3.0 | 1.5 | 1380 | $2,400 | $1.74 | 3d | 1 | 0.06mi |
| 2519 Culver Rd Rochester, NY | 1.0–2.0 | 1.0 | 800 | $1,395 | $1.74 | 10d | 4 | 0.13mi |
| 2362 Culver Rd Irondequoit, NY | 1.0–2.0 | 1.0 | 675 | $1,455 | $2.16 | 2d | 3 | 0.18mi |
| 2145 Norton St Rochester, NY | 2.0 | 1.0 | 700 | $902 | $1.29 | 43d | 1 | 0.34mi |
| 100 Hulda Park Rochester, NY | 1.0–2.0 | 1.0–1.5 | 3759 | $782 | $0.21 | 21d | 1 | 0.38mi |
| 36 Charwood Cir Irondequoit, NY | 2.0 | 1.0–1.5 | 1000 | $1,675 | $1.68 | 43d | 3 | 0.67mi |
| 36 Charwood Cir Irondequoit, NY | 1.0–2.0 | 1.0–1.5 | 930 | $2,005 | $2.16 | 2d | 9 | 0.67mi |
| 326 Northland Ave Rochester, NY | 3.0 | 1.0 | 1168 | $1,500 | $1.28 | 2d | 1 | 0.89mi |
| 2389 E Ridge Rd Rochester, NY | 1.0–2.0 | 1.0 | 871 | $1,515 | $1.74 | 2d | 12 | 0.90mi |
| 95 Onondaga Rd Rochester, NY | 1.0–2.0 | 1.0 | 825 | $1,630 | $1.98 | 2d | 1 | 1.00mi |
| 32 Portland Pkwy Rochester, NY | 2.0 | 1.0 | 652 | $1,485 | $2.28 | 2d | 8 | 1.01mi |
| 21 Portland Ct Rochester, NY | 2.0 | 1.0 | 850 | $1,210 | $1.42 | 43d | 1 | 1.06mi |
| 2 Kings Ct Way Rochester, NY | 1.0–2.0 | 1.0–1.5 | 999 | $1,615 | $1.62 | 2d | 8 | 1.13mi |
| — Rochester, NY | 2.0 | 1.0 | 896 | $1,100 | $1.23 | 14d | 1 | 1.14mi |
| 1890 Clifford Ave Rochester, NY | 3.0 | 1.0 | 936 | $1,800 | $1.92 | 23d | 1 | 1.19mi |
| 50 Harwick Rd Rochester, NY | 1.0–2.0 | 1.0 | 687 | $1,350 | $1.96 | 3d | 3 | 1.25mi |
| 1196 E Ridge Rd Rochester, NY | 1.0–2.0 | 1.0 | 800 | $1,265 | $1.58 | 23d | 1 | 1.30mi |
| 117 Northaven Ter Rochester, NY | 4.0 | 2.0 | 1460 | $1,975 | $1.35 | 10d | 1 | 1.35mi |
| 182 Laurelton Rd Unit 182 Rochester, NY | 2.0 | 1.5 | 1000 | $1,600 | $1.60 | 10d | 1 | 1.36mi |
| 222 Ellison St Rochester, NY | 2.0 | 1.0 | 971 | $1,000 | $1.03 | 14d | 1 | 1.43mi |
| 171 Mohawk St Rochester, NY | 3.0 | 2.0 | 1054 | $1,775 | $1.68 | 43d | 1 | 1.46mi |
| 86-88 Baycliff Dr Unit 86 Rochester, NY | 2.0 | 1.0 | 900 | $1,030 | $1.14 | 21d | 1 | 1.48mi |
| 47 Priscilla St Rochester, NY | 4.0 | 1.5 | 1250 | $1,900 | $1.52 | 21d | 1 | 1.50mi |
Listing history 11 events
-
2025-11-27status Pending
-
2025-11-04$139,900 Active
-
2019-07-11soldstatus $91,000 Closed Sale or Rented 108-char remark
Show marketing remark (108 chars)
3 bed 1 bath ranch on Culver Road right off of 104! Property is vacant and easy to show. Call or text today!
-
2019-07-09soldstatus $91,000
-
2019-06-02status Pending Sale 108-char remark
Show marketing remark (108 chars)
3 bed 1 bath ranch on Culver Road right off of 104! Property is vacant and easy to show. Call or text today!
-
2019-05-07$95,000 Active 108-char remark
Show marketing remark (108 chars)
3 bed 1 bath ranch on Culver Road right off of 104! Property is vacant and easy to show. Call or text today!
-
2019-02-26status Pending Sale
-
2019-02-22historical
-
2018-12-19price $95,000
-
2018-11-29$110,000 Active
-
2014-05-13soldstatus $65,000
ⓘ Source: listings_history table (triggers on properties + properties_extension) + one-shot
backfill from property_details.listing_events for pre-trigger history.
Climate risk First Street
- Flood 1/10 Low FEMA zone X (unshaded) · 0% chance over 30 yrs
- Wildfire 1/10 Low
- Heat 2/10 Low 7 d/yr ≥95°F today · 16 d/yr by 30 yrs out
- Wind 1/10 Low
- Air quality 2/10 Low 1 unhealthy d/yr today · 2 by 30 yrs out
Nearby sold comps map
Loading sold comps map…
Walkable amenities ~0.75 mi
Loading nearby amenities…
Taxation est. · year 1
- Rental income
- $21,191
- − Mortgage interest
- −$7,837
- − Property taxes
- −$2,098
- − Insurance
- −$700
- − Repairs & maintenance
- −$1,695
- − Management
- −$1,695
- − Depreciation
- −$4,070
- Taxable income
- $3,096
- Est. tax owed @ 24.0%
- −$743
- After-tax cash flow
- $4,396/yr
For passive investors: Depreciation is non-cash, so a rental often shows a tax loss while cash-flowing — sheltering income. Rental losses are passive: they offset passive income freely, and up to $25,000/yr can offset ordinary (W-2) income if you actively participate and your MAGI is under $100k (phasing out to $0 by $150k); unused losses carry forward. On sale, claimed depreciation is recaptured at up to 25%, and gains may owe capital-gains tax (a 1031 exchange can defer both). Figures are a year-1 estimate at your 24.0% rate — not tax advice; consult a CPA.
Schools (NCES district)
- District
- East Irondequoit Central School District
- NCES district ID
- 3609690
- Math proficiency
- 40% ▼ -12.00%
- Reading proficiency
- 47% ▲ 8.00%
- Median HH income
- $48,946
- Composite
- 37.27/100
- National rank
- #4451
- State rank
- #475 of 590 in NY
Livability — Irondequoit
- Score
- 81/100
- State rank
- #92
- US rank
- #1414
Category grades
Schools grade is shown separately in the Schools card above.
Census & demographics
- Census place
- Irondequoit, NY
- County
- Monroe County · 674,131 people
- City population
- 74,252
- Metro
- Rochester, NY
- Population (ZIP)
- 40,274
- Household income
- $64,603
- Rent vs Own
- Severe rent burden
- 2183.0
Population outlook (Monroe County) Hauer SSP2
- Today (2025)
- 759,460 people
- By 2030
- 757,154 · -0.3%
- By 2040
- 740,644 · -2.5%
- By 2050
- 714,443 · -5.9%
- By 2075
- 645,883 · -15.0%
- By 2100
- 547,084 · -28.0%
Race, ethnicity, and origin ACS 2023
- Neighborhood character
- Diverse neighborhood (Simpson 0.69)
- Race & ethnicity
- White 44% Black 28% Hispanic / Latino 20% Two or more races 10% Asian 2%
- Hispanic origin (detail)
- Puerto Rican 15% Cuban 1% Dominican 1%
- Common ancestry
- Romanian 4% Lithuanian 2% Iranian 1%
- Foreign-born
- 8% · Canada
- Languages at home
- 81% English-only · Spanish 14% Russian/Polish/Slavic 2% Other Indo-European 1%
Political lean MEDSL · Monroe
- 2024 margin
- D (+19.1) · D 59.5% · R 40.5%
- 2008→2024 swing
- +1.4pp toward D · 2008: 17.7pp · 2024: 19.1pp
- All cycles
- 2024: D+19.1 2020: D+21.0 2016: D+14.1 2012: D+17.4 2008: D+17.7
Not yet ingested
- Civics
- —
Market trends
- HPI YoY
- ▼ -143.57%
- Current HPI
- 328.7053
- Rent YoY
- ▲ 7.89%
- Metro
- Rochester, NY
- State GDP YoY
- ▲ 2.60%
- F500 in state
- 92
Industry mix (Fortune 500 HQ in NY)
| Industry | F500 HQs | Revenue |
|---|---|---|
| Financial Services | 10 | $950B |
|
||
| Consumer Goods | 9 | $162B |
|
||
| Insurance | 4 | $225B |
|
||
| Telecommunications | 2 | $144B |
|
||
| Pharmaceuticals | 2 | $112B |
|
||
| Media / Entertainment | 2 | $69B |
|
||
Price history
+115.2% since first listed11 events — show timeline
- 2025-11-27 Pending — UNYREIS
- 2025-11-04 Listed $139,900 UNYREIS
- 2019-07-11 Sold (MLS) $91,000 UNYREIS
- 2019-07-09 Sold (Public Records) $91,000 Public Records
- 2019-06-02 Pending — UNYREIS
- 2019-05-07 Listed $95,000 UNYREIS
- 2019-02-26 Pending — UNYREIS
- 2019-02-22 Listing Removed — UNYREIS
- 2018-12-19 Price Changed $95,000 UNYREIS
- 2018-11-29 Listed $110,000 UNYREIS
- 2014-05-13 Sold (Public Records) $65,000 Public Records
Property tax history
+6.8%/yrLatest (2025): $7,262 · +0.8% YoY. Source: county tax records.
Cash-flow waterfall
monthlySold comps — $/sqft
last 12 mo · ≤1 miLoading sold comps…