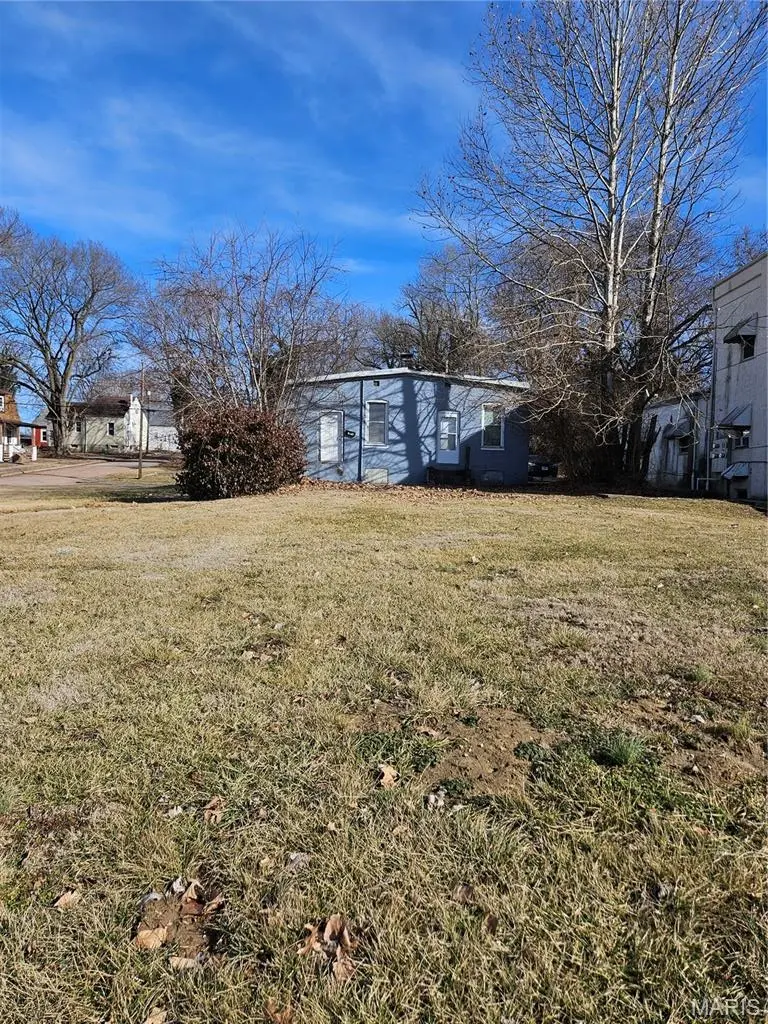
320-322 N 2nd St · Belleville, IL
Flood risk 1/10 · Minimal
- FEMA flood zone
- AE
- Chance of flooding over 30 yrs
- 0.0%
- Est. flood insurance / yr
- $2,026 – $9,024
Fire risk 1/10 · Minimal
- Est. fire insurance / yr
- $804 – $1,492
Heat risk 5/10 · Moderate
- Hot days now (above 107°F)
- 7 days/yr
- Hot days in 30 yrs
- 21 days/yr
Wind risk 2/10 · Minimal
- Chance of severe wind over 30 yrs
- 1.0%
Air-quality risk 4/10 · Minor
- Unhealthy air days now
- 3 days/yr
- Unhealthy air days in 30 yrs
- 6 days/yr
Risk factors via First Street. Map © Google.
Why this score? — see what drove the B grade
The composite is a weighted blend of 9 inputs, each scored 0–100. Each bar is that input's sub-score; the figure is the points it added to the 100-point composite (weight × sub-score).
- Cash flow +30.0/30.0
- 1% rule +10.0/10.0
- DSCR +10.0/10.0
- ARV discount +7.5/15.0
- Rent growth +5.0/5.0
- Livability +3.9/5.0
- Condition / age +2.5/5.0
- Schools +2.2/10.0
- Appreciation +0.0/10.0
$35,000
🖨 Deal sheet 📄 Offer letter ✓ Due diligence
Listing remarks
NEEDS ALOT OF WORK, NEEDS A ROOF. USED AS STORAGE UNIT. SOLD AS-IS. ON 2 LOTS 2 PARCELS
Key facts
- 3,920 sq ft lot
- Built 1901
- Listed 78 days
Property features AI
Exterior
- Utilities: Public water; Public sewer; Electricity (220 volts) available; Natural gas available
- Home design: Single-family residence (attached); Facing/entry level: main level entry; One story
- Construction: Masonite exterior; Basement present
- Exterior features: Open, rectangular lot; No fencing
Interior
- Kitchen: Kitchen on the main level
- Bedrooms: 2 bedrooms, both on the main level
- Bathrooms: 2 full bathrooms, both on the main level
- Heating & cooling: Forced air heating (natural gas); No central air conditioning
- Interior features: Basement with interior and exterior entry; unfinished, full basement; One-level living
Neighborhood map
What this means for you Summary
Snapshot
- This is a 2-bed/4.0-bath single-family listed at $35k.
Deal economics
- At list price, monthly cash flow is $283 ($3k/yr) — positive.
- The deal already cash-flows at list — no discount required.
- Meets the 1% rule at list price ($1k rent vs $35k).
- Recommended offer: $33k (6.0% below list) — sets the bar for market timing.
- Cap rate 31.8% vs local median 5.6% in Belleville — top-decile yield for the area; either an underpriced asset or a hidden risk that comps aren't pricing in. Stress-test before assuming the spread holds.
Location & tenants
- Location reads 78/100 on livability (#142 in IL, #2,604 nationally) — a middle-class / working-renter tenant base. Strengths: commute A+, cost of living A+, housing A+; Watch: crime F, amenities D-.
- Belleville Twp Hsd 201 (suburban): math 21% / reading 28% proficiency, ranked #308 of 620 in IL (top 50%) — low school quality limits family demand, transient renter base, plan for 1-2y turnover.
- Zoned schools: Belleville High School-East (math 23% / reading 30%, grade F, #241 of 693 statewide, top 35%, 2,568 students, 0% FRL).
- Market conditions: Rents rising fast (+14.5%/yr); 148 active listings in the ZIP; 5 comparable units currently listed for rent nearby; rentals at typical pace (median 18d on market — plan ~3-4 weeks tenant-placement turnaround); 783 units permitted in St. Clair County in 2024 (378 in 5+ unit buildings).
Forward outlook
- Local home prices are declining (-3.0%/yr); year-one equity from $242 of loan paydown is wiped out by about $1k of value loss. Plan a longer hold.
- St. Clair County population projected at -23% by 2050 — secular population decline; favor cash flow + early exit over multi-decade hold.
- At projected returns (-3.0% appreciation + 8.0% rent growth), your $10k cash investment doubles in ~3 years — after that, you're playing with house money.
Negotiation context
- It's been on market 78 days — a 6% lower offer ($33k) is reasonable based on typical stale-listing flexibility.
Risks & watch-outs
- Watch-outs: flood insurance adds $460/mo; built in 1901 — expect roof / HVAC / electrical / plumbing capex.
- Climate carrying-cost: in FEMA flood zone AE (mandatory federal flood insurance); extreme-heat days projected 7→21/yr by 2055 (HVAC capex compounding) — expect insurance premiums to compound above CPI over the hold.
Questions for the listing agent
- It's been on market 78 days. Have you received any prior offers? Is the seller open to a 6% concession, seller financing, or rate buy-down credit?
- Built in 1901 — when were the roof, HVAC, electrical panel, plumbing, and water heater last replaced?
- What's the actual annual flood-insurance premium (NFIP or private), and is the property in a SFHA with mandatory coverage?
- Why hasn't it sold? Are there any deal-killer items the seller is aware of (foundation, flood, title, zoning, code violations)?
- Is there a deadline driving the sale (1031 exchange, divorce, estate, relocation)? That informs how much negotiation room exists.
- Crime grade is F in this area — have there been break-ins, vandalism, or insurance claims at this property in the last 3 years? What carrier currently insures it and at what premium?
- What's the average days-on-market for RENTAL listings here right now (not sales)? A rising rental-DOM trend means longer vacancies and softer asking-rent achievability than the comps imply.
- What's the recent tenant-quality profile in this submarket — average credit score on applications, eviction rate, late-payment / NSF rate, and stable-employment percentage? A property-management company in the area should have these aggregated.
- How much new for-sale + rental construction is in the pipeline within 1–3 miles? Heavy new supply typically softens prices + rents 12–24 months out; constrained supply supports both.
Investment metrics
- 1% rule
- 3.56% ✓
- Cap rate
- 31.77%
- Cash-on-cash
- 90.98%
- DSCR
- 5.05
- GRM
- 2.3
CMA / ARV
- ARV (on-the-fly)
- $174,240
- Comps found
- 12
Show comp detail 12 sales within ~0.75 mi
| Address | Dist | Beds/Ba | Sqft | Sold | Price | $/sf | Match |
|---|---|---|---|---|---|---|---|
| 8 Kircher Pl | 0.39mi | 3/1.5 (+1) | 1,763 (-3%) | 2mo | $185,000 | $105 | 60 |
| 508 W C St | 0.29mi | 3/1.5 (+1) | 1,674 (-8%) | 1mo | $125,000 | $75 | 58 |
| 204 W Main St | 0.28mi | 2/2.0 | 2,082 (+15%) | 0mo | $199,000 | $96 | 54 |
| 931 N First St St | 0.46mi | 3/2.0 (+1) | 1,968 (+8%) | 3mo | $187,500 | $95 | 49 |
| 221 N Church St | 0.34mi | 3/1.5 (+1) | 1,582 (-13%) | 1mo | $70,000 | $44 | 47 |
| 244 Brackett St | 0.59mi | 3/3.0 (+1) | 1,700 (-6%) | 7mo | $155,000 | $91 | 47 |
| 300 S Jackson St | 0.55mi | 3/2.0 (+1) | 1,675 (-8%) | 5mo | $175,000 | $104 | 44 |
| 219 N Pennsylvania Ave | 0.70mi | 3/2.0 (+1) | 1,688 (-7%) | 0mo | $225,000 | $133 | 42 |
| 301 N Pennsylvania Ave | 0.68mi | 3/1.5 (+1) | 1,976 (+9%) | 0mo | $258,000 | $131 | 38 |
| 209 N 14th St | 0.70mi | 3/2.0 (+1) | 2,040 (+12%) | 1mo | $40,000 | $20 | 33 |
| 619 E A St | 0.64mi | 3/2.0 (+1) | 1,568 (-14%) | 6mo | $45,000 | $29 | 30 |
| 402 Abend St | 0.72mi | 3/1.5 (+1) | 2,038 (+12%) | 2mo | $239,900 | $118 | 29 |
Match score weights: distance 35% · size 25% · config 20% · recency 20%. Top-matched comps best support the ARV.
Projected returns pro-forma
-3.0% appreciation · 8.0% rent growth · sell at horizon
- IRR
- 40.4%
- Equity multiple
- 2.96×
- Total profit
- $19,214
- Equity at exit
- $5,219
- IRR
- 50.7%
- Equity multiple
- 8.26×
- Total profit
- $71,116
- Equity at exit
- $3,026
Cash invested: $9,800 (down + closing). Projections, not guarantees.
Landlord ↔ Tenant lean methodology
- Overall (STATE)
- 43 Moderately Tenant-Leaning
- State Illinois
- 43 Moderately Tenant-Leaning · D+7
- County
- — inherits STATE
- City
- — inherits STATE
ZIP-level market 62220
- Home prices YoY
- -26.4%
- Rents YoY
- 14.5%
- Active inventory
- 148
- Price-to-rent
- 2.3×
Monthly cashflow live
- Estimated rent
- $1,247 high interval (Pro) →
- Mortgage (P&I)
- −$184
- Tax est. 1.5%
- −$44 /mo · $525/yr
- Insurance
- −$15
- Flood insurance flood zone
- −$460 /mo · $5,525/yr
- HOA
- −$0
- Vacancy / Maint / Mgmt
- −$262
- Net cashflow
- $283
Break-even live
UW: 25.0% down · 7.5% · 30yr · 1.5% tax · 5.0% vac · 8.0% maint · 8.0% mgmt
Financing live
Cash to close
- Down payment
- $8,750
- Closing costs
- $1,050
- Reserves months
- —
- Total cash needed
- —
Loan-product check · same deal, 3 products live
Conventional
25% down · 7.5% · 30yr
- Down + closing
- —
- Monthly P&I
- —
- Monthly cashflow
- —
- DSCR
- —
- Eligible?
- —
Personal DTI + credit; lowest rate.
DSCR
20% down · 8.5% · 30yr
- Down + closing
- —
- Monthly P&I
- —
- Monthly cashflow
- —
- DSCR
- —
- Eligible?
- —
No personal income docs; deal must DSCR.
Hard money
10% down · 12.0% · 12mo
- Down + closing
- —
- Monthly P&I
- —
- Monthly cashflow
- —
- DSCR
- —
- Eligible?
- —
Short-term bridge; refi at stabilization.
Rent comps 5 comps
| Address | Beds | Baths | Sqft | Rent | $/sqft | DOM | Units | Dist |
|---|---|---|---|---|---|---|---|---|
| 310 N 10th St Belleville, IL | 2.0 | 1.0 | 1270 | $1,300 | $1.02 | 2d | 1 | 0.52mi |
| 1107 Bristow St Belleville, IL | 3.0 | 1.0 | 1238 | $1,500 | $1.21 | 12d | 1 | 0.69mi |
| 618 W Monroe St Belleville, IL | 3.0 | 1.0 | 1500 | $1,050 | $0.70 | 24d | 1 | 0.69mi |
| 109 S 13th St Belleville, IL | 3.0 | 1.5 | 1800 | $1,325 | $0.74 | 18d | 1 | 0.80mi |
| 1 Rosehaven Dr Belleville, IL | 3.0 | 2.0 | 1512 | $1,325 | $0.88 | 24d | 1 | 1.44mi |
Listing history 16 events
-
2026-06-18days on market $35,000 Active 78 DOM
-
2026-06-17days on market $35,000 Active 77 DOM
-
2026-06-16days on market $35,000 Active 76 DOM
-
2026-06-15days on market $35,000 Active 75 DOM
-
2026-06-13days on market $35,000 Active 73 DOM
-
2026-06-09days on market $35,000 Active 69 DOM
-
2026-06-08days on market $35,000 Active 68 DOM
-
2026-06-07days on market $35,000 Active 67 DOM
-
2026-06-03days on market $35,000 Active 63 DOM
-
2026-06-02days on market $35,000 Active 62 DOM
-
2026-06-01days on market $35,000 Active 61 DOM
-
2026-05-31days on market $35,000 Active 60 DOM
-
2026-05-05price $35,000
-
2026-04-01$45,000 Active
-
2026-04-01historical $45,000
-
2006-07-19soldstatus $124,000
ⓘ Source: listings_history table (triggers on properties + properties_extension) + one-shot
backfill from property_details.listing_events for pre-trigger history.
Climate risk First Street
- Flood 1/10 Low FEMA zone AE · 0% chance over 30 yrs
- Wildfire 1/10 Low
- Heat 5/10 Major 7 d/yr ≥107°F today · 21 d/yr by 30 yrs out
- Wind 2/10 Low 100% chance of damaging wind over 30 yrs
- Air quality 4/10 Moderate 3 unhealthy d/yr today · 6 by 30 yrs out
Nearby sold comps map
Loading sold comps map…
Walkable amenities ~0.75 mi
Loading nearby amenities…
Taxation est. · year 1
- Rental income
- $14,960
- − Mortgage interest
- −$1,961
- − Property taxes
- −$525
- − Insurance
- −$5,700
- − Repairs & maintenance
- −$1,197
- − Management
- −$1,197
- − Depreciation
- −$1,018
- Taxable income
- $3,362
- Est. tax owed @ 24.0%
- −$807
- After-tax cash flow
- $2,584/yr
For passive investors: Depreciation is non-cash, so a rental often shows a tax loss while cash-flowing — sheltering income. Rental losses are passive: they offset passive income freely, and up to $25,000/yr can offset ordinary (W-2) income if you actively participate and your MAGI is under $100k (phasing out to $0 by $150k); unused losses carry forward. On sale, claimed depreciation is recaptured at up to 25%, and gains may owe capital-gains tax (a 1031 exchange can defer both). Figures are a year-1 estimate at your 24.0% rate — not tax advice; consult a CPA.
Schools (NCES district)
- District
- Belleville Twp Hsd 201
- NCES district ID
- 1705640
- Math proficiency
- 21% ▼ -8.00%
- Reading proficiency
- 28% ▼ -3.00%
- Median HH income
- $58,064
- Composite
- 22.39/100
- National rank
- #8115
- State rank
- #308 of 620 in IL
Livability — Belleville
- Score
- 78/100
- State rank
- #142
- US rank
- #2604
Category grades
Schools grade is shown separately in the Schools card above.
Census & demographics
- Census place
- Belleville, IL
- County
- Saint Clair County · 169,691 people
- City population
- 47,407
- Metro
- St. Louis, MO-IL
- Population (ZIP)
- 19,152
- Household income
- $65,952
- Rent vs Own
- Severe rent burden
- 923.0
Population outlook (St. Clair County) Hauer SSP2
- Today (2025)
- 250,366 people
- By 2030
- 240,511 · -3.9%
- By 2040
- 217,391 · -13.2%
- By 2050
- 192,699 · -23.0%
- By 2075
- 140,637 · -43.8%
- By 2100
- 100,499 · -59.9%
Race, ethnicity, and origin ACS 2023
- Neighborhood character
- Predominantly White (67%)
- Race & ethnicity
- White 67% Black 22% Two or more races 6% Hispanic / Latino 3% Asian 1%
- Common ancestry
- Lithuanian 2% Slovak 2% Romanian 2%
- Foreign-born
- 4% · Canada
- Languages at home
- 95% English-only · Arabic 2% Spanish 1% Other Indo-European 1%
Political lean MEDSL · St. Clair
- 2024 margin
- Lean D (+7.9) · D 53.0% · R 45.1% · Other 1.8%
- 2008→2024 swing
- -14.6pp toward R · 2008: 22.4pp · 2024: 7.9pp
- All cycles
- 2024: D+7.9 2020: D+8.7 2016: D+5.6 2012: D+14.5 2008: D+22.4
Not yet ingested
- Civics
- —
Market trends
- HPI YoY
- ▼ -52.27%
- Current HPI
- 145.9237
- Rent YoY
- ▲ 14.47%
- Metro
- St. Louis, MO-IL
- State GDP YoY
- ▲ 1.59%
- F500 in state
- 60
Industry mix (Fortune 500 HQ in IL)
| Industry | F500 HQs | Revenue |
|---|---|---|
| Insurance | 4 | $201B |
|
||
| Consumer Goods | 4 | $87B |
|
||
| Industrial Machinery | 3 | $64B |
|
||
| Healthcare | 2 | $55B |
|
||
| Retail / Pharmacy | 1 | $148B |
|
||
| Agriculture / Food | 1 | $86B |
|
||
Price history
-71.8% since first listed4 events — show timeline
- 2026-05-05 Price Changed $35,000 MARIS as Distributed by MLS Grid
- 2026-04-01 Listed $45,000 MARIS as Distributed by MLS Grid
- 2026-04-01 Coming Soon $45,000 MARIS as Distributed by MLS Grid
- 2006-07-19 Sold (Public Records) $124,000 Public Records
Property tax history
-0.7%/yrLatest (2024): $2,322 · -4.4% YoY. Source: county tax records.
Cash-flow waterfall
monthlySold comps — $/sqft
last 12 mo · ≤1 miLoading sold comps…