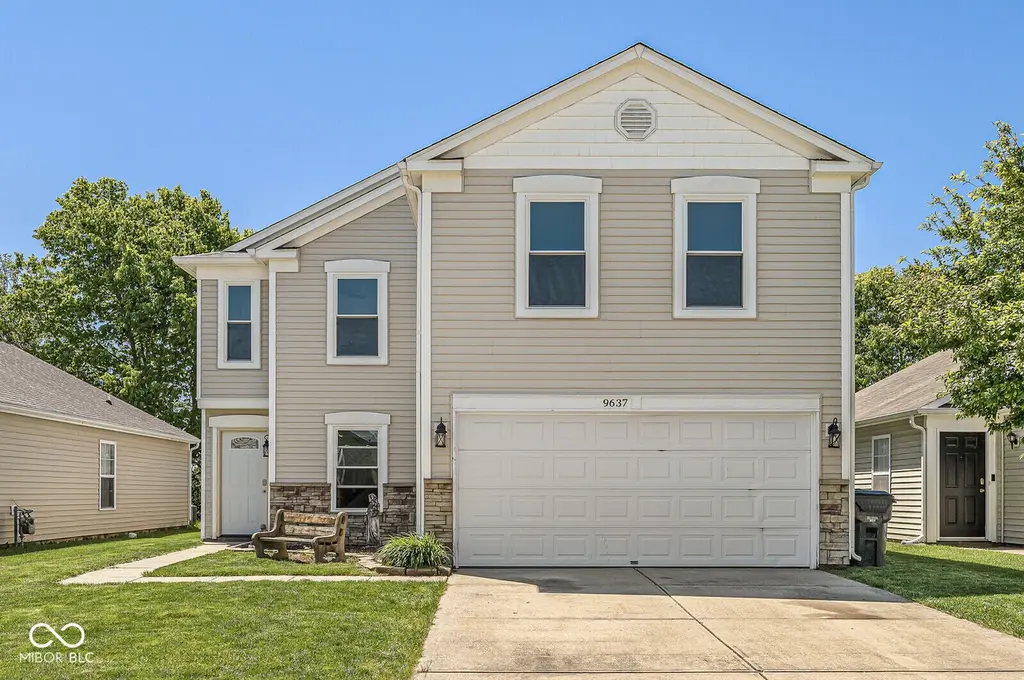
9637 W Stargazer Dr · Ingalls, IN
Flood risk 1/10 · Minimal
- FEMA flood zone
- X (unshaded)
- Chance of flooding over 30 yrs
- 0.0%
- Est. flood insurance / yr
- $507 – $1,088
Fire risk 1/10 · Minimal
- Est. fire insurance / yr
- $717 – $1,331
Heat risk 3/10 · Minor
- Hot days now (above 101°F)
- 7 days/yr
- Hot days in 30 yrs
- 18 days/yr
Wind risk 2/10 · Minimal
- Chance of severe wind over 30 yrs
- 1.0%
Air-quality risk 2/10 · Minimal
- Unhealthy air days now
- 2 days/yr
- Unhealthy air days in 30 yrs
- 2 days/yr
Risk factors via First Street. Map © Google.
Why this score? — see what drove the D+ grade
The composite is a weighted blend of 9 inputs, each scored 0–100. Each bar is that input's sub-score; the figure is the points it added to the 100-point composite (weight × sub-score).
- Cash flow +14.1/30.0
- ARV discount +11.9/15.0
- DSCR +4.3/10.0
- Schools +4.2/10.0
- 1% rule +3.3/10.0
- Livability +3.2/5.0
- Rent growth +2.5/5.0
- Condition / age +2.5/5.0
- Appreciation +0.0/10.0
$293,000
🖨 Deal sheet (PDF) 📄 Offer letter ✓ Due diligence
Listing remarks MLS
GREAT Floor plan! Nice foyer space, front Home office or Formal dining room. Straight ahead to a spacious LR/Great Room w/bricked Gas FP and open to Huge Dining area w/nearby half bath. Mud room entry from garage leads into Large Kitchen w/SS appliances, lots of cabinets & prep-space. Windows galore provide a wide open view, no rear neighbors! Upstairs Loft, Laundry Room for your convenience, 3 Bedrooms PLUS The Master Suite. Community Clubhouse, Pool, Tennis & Playground. Easy access to I-69.
Key facts
- Main floor office
- Updated half bath
- Loft game room
Tags
Property features AI
Finance
- HOA & community: Homeowners association with semi-annual fee; Association fee includes clubhouse, entrance/common areas, insurance, maintenance, nature areas/park/playground, management, snow removal, tennis courts, and walking trails; Community amenities: clubhouse, pool, park, playground, tennis courts, trails
Exterior
- Parking: Attached garage; Two garage spaces (approximately 380 sq ft)
- Security: Smoke alarm
- Utilities: Public water; Municipal sewer connected; Cable available
- Home design: Single-family residence; Two levels; Mandatory HOA
- Construction: Vinyl with brick exterior; Slab foundation
- Exterior features: Gazebo; Patio; Full privacy fencing; Sidewalks
Interior
- Kitchen: Dishwasher; Disposal; Microwave; Electric oven; Refrigerator; Pantry
- Bedrooms: Primary bedroom with walk-in closet; Four bedrooms on the upper level
- Bathrooms: Two full bathrooms (both on upper level); One half bathroom (main level); Primary bathroom is a suite
- Heating & cooling: Forced air heating (natural gas); Central air conditioning
- Interior features: Attic access; Pantry; Walk-in closets; Painted wood trim; Gas log fireplace in the great room; One fireplace total
- Laundry & utility: Upper-level laundry; Gas water heater; Owned water softener
Neighborhood map
What this means for you Summary
Snapshot
- This is a 4-bed/2.5-bath single-family listed at $293k.
Deal economics
- At list price, monthly cash flow is $45 ($540/yr) — positive.
- The deal already cash-flows at list — no discount required.
- To meet the 1% rule (rent ≥ 1% of price), the offer needs to be $242k (17.2% below list).
- Recommended offer: $242k (17.2% below list) — sets the bar for 1% rule.
- Cap rate 6.5% vs local median 4.0% in Ingalls — top-decile yield for the area; either an underpriced asset or a hidden risk that comps aren't pricing in. Stress-test before assuming the spread holds.
Location & tenants
- Location reads 64/100 on livability (#391 in IN) — a middle-class / working-renter tenant base. Strengths: crime A+, cost of living A+, housing A+; Watch: employment C-, amenities F, commute F.
- South Madison Community School Corporation (rural): math 44% / reading 52% proficiency, ranked #60 of 301 in IN (top 20%) — families likely to look elsewhere, expect single-tenant / working-renter base with shorter leases.
- Zoned schools: Maple Ridge Elementary School (math 42% / reading 41%, grade F, #478 of 994 statewide, top 49%, 783 students, 46% FRL); Pendleton Heights Middle School (math 37% / reading 48%, grade D-, #98 of 330 statewide, top 30%, 721 students, 36% FRL); Pendleton Heights High School (math 36% / reading 77%, grade C, #70 of 369 statewide, top 19%, 1,357 students, 31% FRL).
- Market conditions: 237 active listings in the ZIP; 3 comparable units currently listed for rent nearby; rentals leasing fast (median 14d on market — plan ~1-2 weeks tenant-placement turnaround); 184 units permitted in Madison County in 2024 (0 in 5+ unit buildings).
Forward outlook
- Local home prices are declining (-3.0%/yr); year-one equity from $2k of loan paydown is wiped out by about $9k of value loss. Plan a longer hold.
- Madison County population projected at -14% by 2050 — secular population decline; favor cash flow + early exit over multi-decade hold.
Negotiation context
- It's been on market 35 days — a 3% lower offer ($284k) is reasonable based on typical stale-listing flexibility.
- 3 sale attempts since 9y ago with the ask held roughly flat each time — persistent listings suggest the price (not the market) is what's stuck; bring a comps-based counter.
- Current owner paid $180k; list at $293k implies a 63% gain — meaningful room to come down on a strong offer.
Questions for the listing agent
- It's been on market 35 days. Have you received any prior offers? Is the seller open to a 17% concession, seller financing, or rate buy-down credit?
- What does the HOA fee cover, when was the last increase, and are there any pending special assessments or reserve-fund shortfalls?
- Is there a deadline driving the sale (1031 exchange, divorce, estate, relocation)? That informs how much negotiation room exists.
- Schools are F-rated, which usually means shorter tenancies and higher turnover. Who's the typical renter profile here, and what's been the actual vacancy rate?
- The area grade is low — what's the realistic commute time and amenity access for the typical tenant pool here? Any planned neighborhood developments (good or bad) we should know about?
- What's the average days-on-market for RENTAL listings here right now (not sales)? A rising rental-DOM trend means longer vacancies and softer asking-rent achievability than the comps imply.
- What's the recent tenant-quality profile in this submarket — average credit score on applications, eviction rate, late-payment / NSF rate, and stable-employment percentage? A property-management company in the area should have these aggregated.
- How much new for-sale + rental construction is in the pipeline within 1–3 miles? Heavy new supply typically softens prices + rents 12–24 months out; constrained supply supports both.
Investment metrics
- 1% rule
- 0.83% ✗
- Cap rate
- 6.48%
- Cash-on-cash
- 0.66%
- DSCR
- 1.03
- GRM
- 10.1
CMA / ARV
- ARV (on-the-fly)
- $324,540
- Comps found
- 12
Show comp detail 12 sales within ~0.75 mi
| Address | Dist | Beds/Ba | Sqft | Sold | Price | $/sf | Match |
|---|---|---|---|---|---|---|---|
| 8115 S Cricket Ln | 0.39mi | 4/2.5 | 2,328 (-3%) | 7mo | $310,000 | $133 | 71 |
| 9366 W Rising Sun Dr | 0.38mi | 3/2.5 (-1) | 2,318 (-4%) | 2mo | $313,000 | $135 | 69 |
| 8715 Moyer Pl | 0.53mi | 4/2.5 | 2,256 (-6%) | 1mo | $354,900 | $157 | 64 |
| 9399 W Rising Sun Dr | 0.35mi | 3/2.5 (-1) | 2,620 (+9%) | 3mo | $280,000 | $107 | 61 |
| 9543 W Campfire Dr | 0.44mi | 3/2.5 (-1) | 2,226 (-7%) | 2mo | $286,500 | $129 | 60 |
| 8346 S Firefly Dr | 0.17mi | 3/2.5 (-1) | 2,050 (-15%) | 5mo | $268,000 | $131 | 58 |
| 9317 W Quarter Moon Dr | 0.36mi | 3/2.5 (-1) | 2,694 (+12%) | 0mo | $275,000 | $102 | 58 |
| 8032 W Campfire Dr | 0.50mi | 3/2.5 (-1) | 2,174 (-10%) | 2mo | $287,000 | $132 | 54 |
| 9155 Casey Rd | 0.69mi | 4/2.5 | 2,256 (-6%) | 4mo | $375,000 | $166 | 54 |
| 8690 Lester Pl | 0.32mi | 5/3.0 (+1) | 2,736 (+14%) | 2mo | $397,000 | $145 | 54 |
| 9203 Larson Dr | 0.45mi | 5/3.0 (+1) | 2,736 (+14%) | 6mo | $395,000 | $144 | 44 |
| 13367 Champagne St | 0.55mi | 3/2.0 (-1) | 2,052 (-15%) | 6mo | $460,000 | $224 | 38 |
Match score weights: distance 35% · size 25% · config 20% · recency 20%. Top-matched comps best support the ARV.
Projected returns pro-forma
-3.0% appreciation · 3.0% rent growth · sell at horizon
- IRR
- -15.3%
- Equity multiple
- 0.46×
- Total profit
- $-44,673
- Equity at exit
- $43,687
- IRR
- -6.8%
- Equity multiple
- 0.57×
- Total profit
- $-35,449
- Equity at exit
- $25,333
Cash invested: $82,040 (down + closing). Projections, not guarantees.
Landlord ↔ Tenant lean methodology
- Overall (STATE)
- 90 Strongly Landlord-Friendly
- State Indiana
- 90 Strongly Landlord-Friendly · R+11
- County
- — inherits STATE
- City
- — inherits STATE
ZIP-level market 46064
- Active inventory
- 237
- Price-to-rent
- 10.1×
Monthly cashflow live
- Estimated rent
- $2,425 medium interval (Pro) →
- Mortgage (P&I)
- −$1,537
- Tax from tax record
- −$174 /mo · $2,087/yr
- Insurance
- −$122
- HOA
- −$38
- Vacancy / Maint / Mgmt
- −$509
- Net cashflow
- $45
Break-even live
Sensitivity live
| Price | -10% $211 | -5% $128 | +0% $45 | +5% $-38 | +10% $-121 |
|---|---|---|---|---|---|
| Rent | -10% $-147 | -5% $-51 | +0% $45 | +5% $141 | +10% $237 |
| Rate | -1.0pp $193 | -0.5pp $119 | base $45 | +0.5pp $-31 | +1.0pp $-108 |
UW: 25.0% down · 7.5% · 30yr · 1.5% tax · 5.0% vac · 8.0% maint · 8.0% mgmt
Financing live
Cash to close
- Down payment
- $73,250
- Closing costs
- $8,790
- Reserves months
- —
- Total cash needed
- —
Loan-product check · same deal, 3 products live
Conventional
25% down · 7.5% · 30yr
- Down + closing
- —
- Monthly P&I
- —
- Monthly cashflow
- —
- DSCR
- —
- Eligible?
- —
Personal DTI + credit; lowest rate.
DSCR
20% down · 8.5% · 30yr
- Down + closing
- —
- Monthly P&I
- —
- Monthly cashflow
- —
- DSCR
- —
- Eligible?
- —
No personal income docs; deal must DSCR.
Hard money
10% down · 12.0% · 12mo
- Down + closing
- —
- Monthly P&I
- —
- Monthly cashflow
- —
- DSCR
- —
- Eligible?
- —
Short-term bridge; refi at stabilization.
Rent comps 3 comps
| Address | Beds | Baths | Sqft | Rent | $/sqft | DOM | Units | Dist |
|---|---|---|---|---|---|---|---|---|
| 9435 W Quarter Moon Dr Pendleton, IN | 4.0 | 2.5 | 2434 | $2,215 | $0.91 | 0d | 1 | 0.23mi |
| 9160 Larson Dr Pendleton, IN | 5.0 | 3.5 | 3059 | $2,796 | $0.91 | 25d | 1 | 0.52mi |
| 15905 Tharp Woods Dr Fishers, IN | 4.0 | 3.0 | 2442 | $2,850 | $1.17 | 13d | 1 | 1.26mi |
HOA detail
- Monthly dues
- $38 · $456/yr
- Likely covers
- gaspool
Listing history 21 events
-
2026-06-17status $293,000 Pending 35 DOM
-
2026-06-17days on market $293,000 Active 35 DOM
-
2026-06-16pricedays on market $293,000 Active 34 DOM
-
2026-06-15days on market $298,000 Active 33 DOM
-
2026-06-13days on market $298,000 Active 31 DOM
-
2026-06-13days on market $298,000 Active 30 DOM
-
2026-06-09pricedays on market $298,000 Active 27 DOM
-
2026-06-08days on market $302,000 Active 26 DOM
-
2026-06-07days on market $302,000 Active 25 DOM
-
2026-06-05days on market $302,000 Active 22 DOM
-
2026-06-03days on market $302,000 Active 21 DOM
-
2026-06-02days on market $302,000 Active 20 DOM
-
2026-06-01days on market $302,000 Active 19 DOM
-
2026-05-31days on market $302,000 Active 18 DOM
-
2026-05-12$305,000 Active
-
2019-11-18soldstatus $180,000 Sold
-
2019-11-09$180,000
-
2019-11-08historical
-
2017-06-05soldstatus $154,000 Sold 507-char remark
Show marketing remark (507 chars)
GREAT Floor plan! Nice foyer space, front Home office or Formal dining room. Straight ahead to a spacious LR/Great Room w/bricked Gas FP and open to Huge Dining area w/nearby half bath. Mud room entry from garage leads into Large Kitchen w/SS appliances, lots of cabinets & prep-space. Windows galore provide a wide open view, no rear neighbors! Upstairs Loft, Laundry Room for your convenience, 3 Bedrooms PLUS The Master Suite. Community Clubhouse, Pool, Tennis & Playground. Easy access to I-69.
-
2017-04-25status Pending 507-char remark
Show marketing remark (507 chars)
GREAT Floor plan! Nice foyer space, front Home office or Formal dining room. Straight ahead to a spacious LR/Great Room w/bricked Gas FP and open to Huge Dining area w/nearby half bath. Mud room entry from garage leads into Large Kitchen w/SS appliances, lots of cabinets & prep-space. Windows galore provide a wide open view, no rear neighbors! Upstairs Loft, Laundry Room for your convenience, 3 Bedrooms PLUS The Master Suite. Community Clubhouse, Pool, Tennis & Playground. Easy access to I-69.
-
2017-04-12$154,000 Active 507-char remark
Show marketing remark (507 chars)
GREAT Floor plan! Nice foyer space, front Home office or Formal dining room. Straight ahead to a spacious LR/Great Room w/bricked Gas FP and open to Huge Dining area w/nearby half bath. Mud room entry from garage leads into Large Kitchen w/SS appliances, lots of cabinets & prep-space. Windows galore provide a wide open view, no rear neighbors! Upstairs Loft, Laundry Room for your convenience, 3 Bedrooms PLUS The Master Suite. Community Clubhouse, Pool, Tennis & Playground. Easy access to I-69.
ⓘ Source: listings_history table (triggers on properties + properties_extension) + one-shot
backfill from property_details.listing_events for pre-trigger history.
Tax reassessment forecast IN · Partial reset (capped growth)
- Current annual tax
- $2,087 · $174/mo
- Projected year-2 tax
- $2,289 · $191/mo
- Expected delta
- +$202/yr (+$17/mo · 9.7%)
ⓘ Screening estimate from a state-policy table — verify with the county assessor before closing.
Climate risk First Street
- Flood 1/10 Low FEMA zone X (unshaded) · 0% chance over 30 yrs
- Wildfire 1/10 Low
- Heat 3/10 Moderate 7 d/yr ≥101°F today · 18 d/yr by 30 yrs out
- Wind 2/10 Low 100% chance of damaging wind over 30 yrs
- Air quality 2/10 Low 2 unhealthy d/yr today · 2 by 30 yrs out
Nearby sold comps map
Loading sold comps map…
Walkable amenities ~0.75 mi
Loading nearby amenities…
Taxation est. · year 1
- Rental income
- $29,097
- − Mortgage interest
- −$16,413
- − Property taxes
- −$2,087
- − Insurance
- −$1,465
- − Repairs & maintenance
- −$2,328
- − Management
- −$2,328
- − HOA
- −$456
- − Depreciation
- −$8,524
- Taxable loss
- −$4,503
- Est. tax savings @ 24.0%
- +$1,081
- After-tax cash flow
- $1,620/yr
For passive investors: Depreciation is non-cash, so a rental often shows a tax loss while cash-flowing — sheltering income. Rental losses are passive: they offset passive income freely, and up to $25,000/yr can offset ordinary (W-2) income if you actively participate and your MAGI is under $100k (phasing out to $0 by $150k); unused losses carry forward. On sale, claimed depreciation is recaptured at up to 25%, and gains may owe capital-gains tax (a 1031 exchange can defer both). Figures are a year-1 estimate at your 24.0% rate — not tax advice; consult a CPA.
Schools (NCES district)
- District
- South Madison Community School Corporation
- NCES district ID
- 1810440
- Math proficiency
- 44% ▼ -13.00%
- Reading proficiency
- 52% ▼ -6.00%
- Median HH income
- $63,565
- Composite
- 42.4/100
- National rank
- #3231
- State rank
- #60 of 301 in IN
Livability — Ingalls
- Score
- 64/100
- State rank
- #391
- US rank
- #14479
Category grades
Schools grade is shown separately in the Schools card above.
Census & demographics
- City population
- 2,209
- Population (ZIP)
- 17,730
Population outlook (Madison County) Hauer SSP2
- Today (2025)
- 125,800 people
- By 2030
- 122,640 · -2.5%
- By 2040
- 115,420 · -8.3%
- By 2050
- 108,148 · -14.0%
- By 2075
- 91,838 · -27.0%
- By 2100
- 75,670 · -39.8%
Race, ethnicity, and origin ACS 2023
- Neighborhood character
- Predominantly White (86%)
- Race & ethnicity
- White 86% Two or more races 6% Black 5% Hispanic / Latino 3% Asian 1%
- Common ancestry
- Slovak 3% Italian 2% Romanian 1%
- Foreign-born
- 2% · Canada
- Languages at home
- 96% English-only · Spanish 2% Other Indo-European 1%
Political lean MEDSL · Madison
- 2024 margin
- Strong R (+26.9) · D 35.6% · R 62.5% · Other 1.9%
- 2008→2024 swing
- -33.5pp toward R · 2008: 6.5pp · 2024: -26.9pp
- All cycles
- 2024: R+26.9 2020: R+22.6 2016: R+25.7 2012: R+4.5 2008: D+6.5
Not yet ingested
- Civics
- —
Market trends
- HPI YoY
- ▼ -160.39%
- Current HPI
- 227.4921
- Rent YoY
- —
- Metro
- —
- State GDP YoY
- ▲ 2.90%
- F500 in state
- 18
Industry mix (Fortune 500 HQ in IN)
| Industry | F500 HQs | Revenue |
|---|---|---|
| Industrial Machinery | 2 | $37B |
|
||
| Healthcare | 1 | $177B |
|
||
| Pharmaceuticals | 1 | $45B |
|
||
| Metals / Steel | 1 | $18B |
|
||
| Agriculture | 1 | $17B |
|
||
| Packaging | 1 | $12B |
|
||
Price history
+98.1% since first listed7 events — show timeline
- 2026-05-12 Listed $305,000 MIBOR as Distributed by MLS Grid
- 2019-11-18 Sold (MLS) $180,000 MIBOR as Distributed by MLS Grid
- 2019-11-09 Listed $180,000 MIBOR as Distributed by MLS Grid
- 2019-11-08 Listing Removed — MIBOR as Distributed by MLS Grid
- 2017-06-05 Sold (MLS) $154,000 MIBOR as Distributed by MLS Grid
- 2017-04-25 Pending — MIBOR as Distributed by MLS Grid
- 2017-04-12 Listed $154,000 MIBOR as Distributed by MLS Grid
Property tax history
-1.5%/yrLatest (2024): $2,087 · -0.1% YoY. Source: county tax records.
Cash-flow waterfall
monthlySold comps — $/sqft
last 12 mo · ≤1 miLoading sold comps…