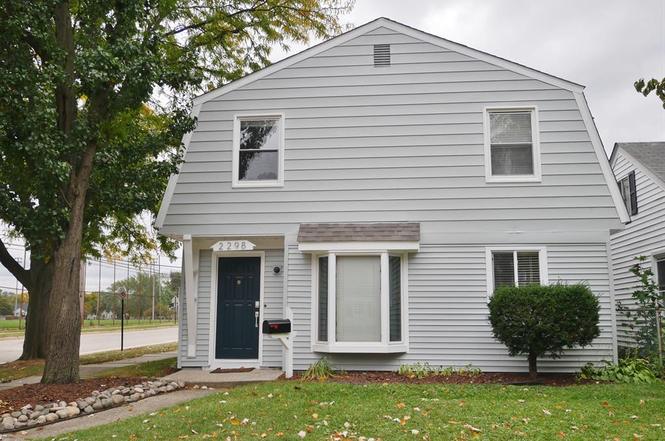
2298 Browning St · Ferndale, MI
Flood risk 1/10 · Minimal
- FEMA flood zone
- X (unshaded)
- Chance of flooding over 30 yrs
- 0.0%
- Est. flood insurance / yr
- $473 – $860
Fire risk 1/10 · Minimal
- Est. fire insurance / yr
- $784 – $1,456
Heat risk 3/10 · Minor
- Hot days now (above 97°F)
- 7 days/yr
- Hot days in 30 yrs
- 15 days/yr
Wind risk 2/10 · Minimal
- Chance of severe wind over 30 yrs
- —
Air-quality risk 3/10 · Minor
- Unhealthy air days now
- 3 days/yr
- Unhealthy air days in 30 yrs
- 5 days/yr
Risk factors via First Street. Map © Google.
Why this score? — see what drove the C+ grade
The composite is a weighted blend of 9 inputs, each scored 0–100. Each bar is that input's sub-score; the figure is the points it added to the 100-point composite (weight × sub-score).
- Cash flow +25.3/30.0
- DSCR +8.3/10.0
- ARV discount +7.5/15.0
- 1% rule +6.5/10.0
- Livability +4.5/5.0
- Rent growth +4.1/5.0
- Condition / age +2.5/5.0
- Schools +1.4/10.0
- Appreciation +0.0/10.0
$215,000
🖨 Deal sheet 📄 Offer letter ✓ Due diligence
Listing remarks MLS
Property sold AS IS, FHA 203K or cash only. Fix up and flip, rent or fix yourself and create your own equity. Great location and floor plan for this 4 bedroom 2 bath home on corner lot next to a park. Large fenced lot with shed and concrete patio. Roof and AC approximately 8 yrs. Close to freeway. Call listing agent for additional details and access. Photos represent home before drywall removed for floor plan purposes only.
Key facts
- Next to a park
- Concrete patio
- Fenced lot
Tags
Property features AI
Finance
- Other: Corner lot; Paved road frontage; Lot dimensions approximately 34 x 120; Approximately 0.1 acre lot; No pool
- HOA & community: Sidewalks
Exterior
- Parking: Driveway; No garage
- Security: Smoke detector(s)
- Utilities: Public water; Public sewer; Cable available; Gas water heater
- Home design: Single family residence; Two levels; Ground-level entry with steps; Aluminum siding
- Construction: Asphalt roof; Slab foundation; Built with aluminum siding
- Exterior features: Patio; Porch; Lighting; Fenced yard; Shed(s)
Interior
- Kitchen: Dishwasher; Disposal; Free-standing gas range; Free-standing refrigerator
- Bathrooms: 2 full bathrooms
- Heating & cooling: Central air conditioning; Forced air heating; Natural gas heating
- Interior features: Smart thermostat; Smoke detector(s)
- Laundry & utility: Laundry room; Washer; Dryer; Gas water heater
Neighborhood map
What this means for you Summary
Snapshot
- This is a 6-bed/1.0-bath single-family listed at $215k.
Deal economics
- At list price, monthly cash flow is $488 ($6k/yr) — positive.
- The deal already cash-flows at list — no discount required.
- Meets the 1% rule at list price ($2k rent vs $215k).
- Recommended offer: $196k (9.0% below list) — sets the bar for market timing.
- Cap rate 9.0% vs local median 4.5% in Ferndale — top-decile yield for the area; either an underpriced asset or a hidden risk that comps aren't pricing in. Stress-test before assuming the spread holds.
Location & tenants
- Location reads 90/100 on livability (#8 in MI, #103 nationally) — a professional / high-income tenant draw. Strengths: amenities A+, commute A+, employment A+; Watch: schools D+.
- Hazel Park School District (suburban): math 10% / reading 24% proficiency, ranked #490 of 540 in MI (top 91%) — low school quality limits family demand, transient renter base, plan for 1-2y turnover; 70% free/reduced lunch — lower-income household profile, screen leases tightly.
- Market conditions: Rents rising fast (+6.2%/yr); 171 active listings in the ZIP; solid renter incomes; 2,614 units permitted in Oakland County in 2024 (721 in 5+ unit buildings).
- This rent runs 33% of the median local income ($90k/yr) — at the standard rent-burdened threshold; future hikes will face affordability resistance.
Forward outlook
- Local home prices are declining (-3.0%/yr); year-one equity from $1k of loan paydown is wiped out by about $6k of value loss. Plan a longer hold.
- Oakland County population projected at +10% by 2050 — modest demand growth; plan on rents tracking national, not racing it.
- At projected returns (-3.0% appreciation + 6.2% rent growth), your $60k cash investment doubles in ~9 years — after that, you're playing with house money.
Negotiation context
- It's been on market 118 days — a 9% lower offer ($196k) is reasonable based on typical stale-listing flexibility.
- 14 sale attempts since 30y ago; this cycle's ask has dropped $15k (7%) from the opening price — seller is motivated, your offer sets the floor, not the list.
- Current owner paid $24k; list at $215k implies a 815% gain — meaningful room to come down on a strong offer.
Risks & watch-outs
- Watch-outs: built in 1950 — expect roof / HVAC / electrical / plumbing capex.
Questions for the listing agent
- It's been on market 118 days. Have you received any prior offers? Is the seller open to a 9% concession, seller financing, or rate buy-down credit?
- Built in 1950 — when were the roof, HVAC, electrical panel, plumbing, and water heater last replaced?
- Why hasn't it sold? Are there any deal-killer items the seller is aware of (foundation, flood, title, zoning, code violations)?
- Is there a deadline driving the sale (1031 exchange, divorce, estate, relocation)? That informs how much negotiation room exists.
- Schools are D-rated, which usually means shorter tenancies and higher turnover. Who's the typical renter profile here, and what's been the actual vacancy rate?
- What's the average days-on-market for RENTAL listings here right now (not sales)? A rising rental-DOM trend means longer vacancies and softer asking-rent achievability than the comps imply.
- What's the recent tenant-quality profile in this submarket — average credit score on applications, eviction rate, late-payment / NSF rate, and stable-employment percentage? A property-management company in the area should have these aggregated.
- How much new for-sale + rental construction is in the pipeline within 1–3 miles? Heavy new supply typically softens prices + rents 12–24 months out; constrained supply supports both.
Investment metrics
- 1% rule
- 1.15% ✓
- Cap rate
- 9.02%
- Cash-on-cash
- 9.73%
- DSCR
- 1.43
- GRM
- 7.2
CMA / ARV
No comps found within radius.
Projected returns pro-forma
-3.0% appreciation · 6.24% rent growth · sell at horizon
- IRR
- 1.9%
- Equity multiple
- 1.08×
- Total profit
- $4,613
- Equity at exit
- $32,057
- IRR
- 14.5%
- Equity multiple
- 2.34×
- Total profit
- $80,749
- Equity at exit
- $18,589
Cash invested: $60,200 (down + closing). Projections, not guarantees.
Landlord ↔ Tenant lean methodology
- Overall (STATE)
- 62 Landlord-Friendly
- State Michigan
- 62 Landlord-Friendly · EVEN
- County
- — inherits STATE
- City
- — inherits STATE
ZIP-level market 48220
- Rents YoY
- 6.2%
- Active inventory
- 171
- Price-to-rent
- 7.2×
Monthly cashflow live
- Estimated rent
- $2,479 medium interval (Pro) →
- Mortgage (P&I)
- −$1,127
- Tax from tax record
- −$253 /mo · $3,041/yr
- Insurance
- −$90
- HOA
- −$0
- Vacancy / Maint / Mgmt
- −$521
- Net cashflow
- $488
Break-even live
UW: 25.0% down · 7.5% · 30yr · 1.5% tax · 5.0% vac · 8.0% maint · 8.0% mgmt
Financing live
Cash to close
- Down payment
- $53,750
- Closing costs
- $6,450
- Reserves months
- —
- Total cash needed
- —
Loan-product check · same deal, 3 products live
Conventional
25% down · 7.5% · 30yr
- Down + closing
- —
- Monthly P&I
- —
- Monthly cashflow
- —
- DSCR
- —
- Eligible?
- —
Personal DTI + credit; lowest rate.
DSCR
20% down · 8.5% · 30yr
- Down + closing
- —
- Monthly P&I
- —
- Monthly cashflow
- —
- DSCR
- —
- Eligible?
- —
No personal income docs; deal must DSCR.
Hard money
10% down · 12.0% · 12mo
- Down + closing
- —
- Monthly P&I
- —
- Monthly cashflow
- —
- DSCR
- —
- Eligible?
- —
Short-term bridge; refi at stabilization.
Listing history 49 events
-
2026-06-04status $215,000 Pending 118 DOM
-
2026-06-03days on market $215,000 Active 118 DOM
-
2026-06-02days on market $215,000 Active 117 DOM
-
2026-06-01days on market $215,000 Active 116 DOM
-
2026-05-31days on market $215,000 Active 115 DOM
-
2026-05-24price $215,000 427-char remark
Show marketing remark (427 chars)
Property sold AS IS, FHA 203K or cash only. Fix up and flip, rent or fix yourself and create your own equity. Great location and floor plan for this 4 bedroom 2 bath home on corner lot next to a park. Large fenced lot with shed and concrete patio. Roof and AC approximately 8 yrs. Close to freeway. Call listing agent for additional details and access. Photos represent home before drywall removed for floor plan purposes only.
-
2026-05-23price $215,000
-
2026-04-04price $199,900 427-char remark
Show marketing remark (427 chars)
Property sold AS IS, FHA 203K or cash only. Fix up and flip, rent or fix yourself and create your own equity. Great location and floor plan for this 4 bedroom 2 bath home on corner lot next to a park. Large fenced lot with shed and concrete patio. Roof and AC approximately 8 yrs. Close to freeway. Call listing agent for additional details and access. Photos represent home before drywall removed for floor plan purposes only.
-
2026-04-04price $199,900
Show marketing remark (427 chars)
Property sold AS IS, FHA 203K or cash only. Fix up and flip, rent or fix yourself and create your own equity. Great location and floor plan for this 4 bedroom 2 bath home on corner lot next to a park. Large fenced lot with shed and concrete patio. Roof and AC approximately 8 yrs. Close to freeway. Call listing agent for additional details and access. Photos represent home before drywall removed for floor plan purposes only.
-
2026-02-05$230,000 Active
Show marketing remark (427 chars)
Property sold AS IS, FHA 203K or cash only. Fix up and flip, rent or fix yourself and create your own equity. Great location and floor plan for this 4 bedroom 2 bath home on corner lot next to a park. Large fenced lot with shed and concrete patio. Roof and AC approximately 8 yrs. Close to freeway. Call listing agent for additional details and access. Photos represent home before drywall removed for floor plan purposes only.
-
2026-02-05$230,000 Active 427-char remark
Show marketing remark (427 chars)
Property sold AS IS, FHA 203K or cash only. Fix up and flip, rent or fix yourself and create your own equity. Great location and floor plan for this 4 bedroom 2 bath home on corner lot next to a park. Large fenced lot with shed and concrete patio. Roof and AC approximately 8 yrs. Close to freeway. Call listing agent for additional details and access. Photos represent home before drywall removed for floor plan purposes only.
-
2025-12-24historical $2,075
-
2025-11-09price $2,075
-
2025-10-23price $2,150
-
2025-10-09price $2,250
-
2025-09-30price $2,350
-
2025-07-26price $2,450
-
2025-05-20$2,500
-
2025-05-20historical $2,500
-
2025-05-20$2,500
-
2024-06-09historical $2,250
-
2024-03-28$2,250
-
2024-03-28historical $2,250
-
2024-03-03$2,250
-
2024-03-03historical $2,250
-
2024-01-27price $2,250
-
2023-12-16price $2,295
-
2023-10-10price $2,495
-
2023-09-04$2,895
-
2011-11-30soldstatus $23,500 303-char remark
Show marketing remark (303 chars)
* * CORP OWNED * * MIN EMD $1000 TO BE HELD BY LIST OFFICE IN CERTIFIED FUNDS. PROOF OF FUNDS OR PRE APPROVAL LETTER REQUIRED FOR ALL OFFERS. BUYER RESPONSIBLE FOR ALL CITY CERTS AND INSPECTIONS, INCLUDING BUT NOT LIMITED TO ACR, WELL, SEPTIC AND CERT OF OCCUPANCY. DIMMINSIONS ARE APPROXIMATE. BATVAI
-
2011-11-30soldstatus $23,500
Show marketing remark (303 chars)
* * CORP OWNED * * MIN EMD $1000 TO BE HELD BY LIST OFFICE IN CERTIFIED FUNDS. PROOF OF FUNDS OR PRE APPROVAL LETTER REQUIRED FOR ALL OFFERS. BUYER RESPONSIBLE FOR ALL CITY CERTS AND INSPECTIONS, INCLUDING BUT NOT LIMITED TO ACR, WELL, SEPTIC AND CERT OF OCCUPANCY. DIMMINSIONS ARE APPROXIMATE. BATVAI
-
2011-10-31historical 303-char remark
Show marketing remark (303 chars)
* * CORP OWNED * * MIN EMD $1000 TO BE HELD BY LIST OFFICE IN CERTIFIED FUNDS. PROOF OF FUNDS OR PRE APPROVAL LETTER REQUIRED FOR ALL OFFERS. BUYER RESPONSIBLE FOR ALL CITY CERTS AND INSPECTIONS, INCLUDING BUT NOT LIMITED TO ACR, WELL, SEPTIC AND CERT OF OCCUPANCY. DIMMINSIONS ARE APPROXIMATE. BATVAI
-
2011-07-26$29,900 303-char remark
Show marketing remark (303 chars)
* * CORP OWNED * * MIN EMD $1000 TO BE HELD BY LIST OFFICE IN CERTIFIED FUNDS. PROOF OF FUNDS OR PRE APPROVAL LETTER REQUIRED FOR ALL OFFERS. BUYER RESPONSIBLE FOR ALL CITY CERTS AND INSPECTIONS, INCLUDING BUT NOT LIMITED TO ACR, WELL, SEPTIC AND CERT OF OCCUPANCY. DIMMINSIONS ARE APPROXIMATE. BATVAI
-
2011-07-26$29,900
Show marketing remark (303 chars)
* * CORP OWNED * * MIN EMD $1000 TO BE HELD BY LIST OFFICE IN CERTIFIED FUNDS. PROOF OF FUNDS OR PRE APPROVAL LETTER REQUIRED FOR ALL OFFERS. BUYER RESPONSIBLE FOR ALL CITY CERTS AND INSPECTIONS, INCLUDING BUT NOT LIMITED TO ACR, WELL, SEPTIC AND CERT OF OCCUPANCY. DIMMINSIONS ARE APPROXIMATE. BATVAI
-
2011-03-31soldstatus $28,000
-
2011-03-31soldstatus $28,000
-
2010-11-16$28,000
-
2010-11-16$28,000
-
2010-05-13historical
-
2010-02-15$59,900
-
1997-07-03soldstatus $74,000
-
1997-06-06soldstatus $74,000
-
1997-05-07historical
-
1997-03-24$79,900
-
1996-10-12historical
-
1996-07-15$79,000
-
1987-12-01soldstatus $42,000
-
1975-04-01soldstatus $19,400
-
1973-03-01soldstatus $17,600
ⓘ Source: listings_history table (triggers on properties + properties_extension) + one-shot
backfill from property_details.listing_events for pre-trigger history.
Tax reassessment forecast MI · Partial reset (capped growth)
- Current annual tax
- $3,041 · $253/mo
- Projected year-2 tax
- $3,176 · $265/mo
- Expected delta
- +$135/yr (+$11/mo · 4.4%)
ⓘ Screening estimate from a state-policy table — verify with the county assessor before closing.
Climate risk First Street
- Flood 1/10 Low FEMA zone X (unshaded) · 0% chance over 30 yrs
- Wildfire 1/10 Low
- Heat 3/10 Moderate 7 d/yr ≥97°F today · 15 d/yr by 30 yrs out
- Wind 2/10 Low
- Air quality 3/10 Moderate 3 unhealthy d/yr today · 5 by 30 yrs out
Nearby sold comps map
Loading sold comps map…
Walkable amenities ~0.75 mi
Loading nearby amenities…
Taxation est. · year 1
- Rental income
- $29,749
- − Mortgage interest
- −$12,043
- − Property taxes
- −$3,041
- − Insurance
- −$1,075
- − Repairs & maintenance
- −$2,380
- − Management
- −$2,380
- − Depreciation
- −$6,255
- Taxable income
- $2,575
- Est. tax owed @ 24.0%
- −$618
- After-tax cash flow
- $5,238/yr
For passive investors: Depreciation is non-cash, so a rental often shows a tax loss while cash-flowing — sheltering income. Rental losses are passive: they offset passive income freely, and up to $25,000/yr can offset ordinary (W-2) income if you actively participate and your MAGI is under $100k (phasing out to $0 by $150k); unused losses carry forward. On sale, claimed depreciation is recaptured at up to 25%, and gains may owe capital-gains tax (a 1031 exchange can defer both). Figures are a year-1 estimate at your 24.0% rate — not tax advice; consult a CPA.
Schools (NCES district)
- District
- Hazel Park School District
- NCES district ID
- 2618030
- Math proficiency
- 10% ▼ -2.00%
- Reading proficiency
- 24% ▲ 1.00%
- Median HH income
- $36,181
- Composite
- 14.05/100
- National rank
- #9466
- State rank
- #490 of 540 in MI
Livability — Ferndale
- Score
- 90/100
- State rank
- #8
- US rank
- #103
Category grades
Schools grade is shown separately in the Schools card above.
Census & demographics
- Census place
- Ferndale, MI
- County
- Oakland County · 1,009,092 people
- City population
- 21,527
- Metro
- Detroit-Warren-Dearborn, MI
- Population (ZIP)
- 21,527
- Household income
- $89,881
- Rent vs Own
- Severe rent burden
- 670.0
Population outlook (Oakland County) Hauer SSP2
- Today (2025)
- 1,335,747 people
- By 2030
- 1,375,100 · +2.9%
- By 2040
- 1,435,385 · +7.5%
- By 2050
- 1,469,250 · +10.0%
- By 2075
- 1,531,946 · +14.7%
- By 2100
- 1,450,485 · +8.6%
Race, ethnicity, and origin ACS 2023
- Neighborhood character
- Predominantly White (72%)
- Race & ethnicity
- White 72% Black 15% Two or more races 6% Hispanic / Latino 5% Asian 3%
- Common ancestry
- Romanian 11% Lithuanian 6% Slovak 3%
- Foreign-born
- 4% · Canada, South Korea
- Languages at home
- 95% English-only · Spanish 2% Other Indo-European 1% German/W. Germanic 1%
Political lean MEDSL · Oakland
- 2024 margin
- D (+10.6) · D 54.4% · R 43.8% · Other 1.9%
- 2008→2024 swing
- -3.9pp toward R · 2008: 14.5pp · 2024: 10.6pp
- All cycles
- 2024: D+10.6 2020: D+14.1 2016: D+8.1 2012: D+8.1 2008: D+14.5
Not yet ingested
- Civics
- —
Market trends
- HPI YoY
- ▼ -394.92%
- Current HPI
- 273.0986
- Rent YoY
- ▲ 6.24%
- Metro
- Detroit-Warren-Dearborn, MI
- State GDP YoY
- ▲ 1.37%
- F500 in state
- 28
Industry mix (Fortune 500 HQ in MI)
| Industry | F500 HQs | Revenue |
|---|---|---|
| Automotive Parts | 3 | $48B |
|
||
| Automotive | 2 | $372B |
|
||
| Chemicals | 1 | $45B |
|
||
| Automotive Retail | 1 | $29B |
|
||
| Healthcare / Medical Devices | 1 | $23B |
|
||
| Automotive Technology | 1 | $20B |
|
||
Price history
+1121.6% since first listed44 events — show timeline
- 2026-05-24 Price Changed $215,000 MiRealSource-MiMLS
- 2026-05-23 Price Changed $215,000 REALCOMP
- 2026-04-04 Price Changed $199,900 MiRealSource-MiMLS
- 2026-04-04 Price Changed $199,900 REALCOMP
- 2026-02-05 Listed $230,000 REALCOMP
- 2026-02-05 Listed $230,000 MiRealSource-MiMLS
- 2025-12-24 Rental Removed $2,075 REALSOURCE
- 2025-11-09 Price Changed $2,075 REALSOURCE
- 2025-10-23 Price Changed $2,150 REALSOURCE
- 2025-10-09 Price Changed $2,250 REALSOURCE
- 2025-09-30 Price Changed $2,350 REALSOURCE
- 2025-07-26 Price Changed $2,450 REALSOURCE
- 2025-05-20 Listed for Rent $2,500 REALSOURCE
- 2025-05-20 Rental Removed $2,500 REALCOMP
- 2025-05-20 Listed for Rent $2,500 REALCOMP
- 2024-06-09 Rental Removed $2,250 REALSOURCE
- 2024-03-28 Listed for Rent $2,250 REALSOURCE
- 2024-03-28 Rental Removed $2,250 REALCOMP
- 2024-03-03 Listed for Rent $2,250 REALCOMP
- 2024-03-03 Rental Removed $2,250 REALSOURCE
- 2024-01-27 Price Changed $2,250 REALSOURCE
- 2023-12-16 Price Changed $2,295 REALSOURCE
- 2023-10-10 Price Changed $2,495 REALSOURCE
- 2023-09-04 Listed for Rent $2,895 REALSOURCE
- 2011-11-30 Sold (MLS) $23,500 REALCOMP
- 2011-11-30 Sold (MLS) $23,500 MiRealSource-MiMLS
- 2011-10-31 Listing Removed — MiRealSource-MiMLS
- 2011-07-26 Listed $29,900 REALCOMP
- 2011-07-26 Listed $29,900 MiRealSource-MiMLS
- 2011-03-31 Sold (MLS) $28,000 MiRealSource-MiMLS
- 2011-03-31 Sold (MLS) $28,000 REALCOMP
- 2010-11-16 Listed $28,000 MiRealSource-MiMLS
- 2010-11-16 Listed $28,000 REALCOMP
- 2010-05-13 Listing Removed — REALCOMP
- 2010-02-15 Listed $59,900 REALCOMP
- 1997-07-03 Sold (Public Records) $74,000 Public Records
- 1997-06-06 Sold (MLS) $74,000 MiRealSource-MiMLS
- 1997-05-07 Listing Removed — MiRealSource-MiMLS
- 1997-03-24 Listed $79,900 MiRealSource-MiMLS
- 1996-10-12 Listing Removed — REALCOMP
- 1996-07-15 Listed $79,000 REALCOMP
- 1987-12-01 Sold (Public Records) $42,000 Public Records
- 1975-04-01 Sold (Public Records) $19,400 Public Records
- 1973-03-01 Sold (Public Records) $17,600 Public Records
Property tax history
+1.6%/yrLatest (2025): $3,041 · +2.2% YoY. Source: county tax records.
Cash-flow waterfall
monthlySold comps — $/sqft
last 12 mo · ≤1 miLoading sold comps…