985 Mosely Rd · Maynard, AR
Flood risk 1/10 · Minimal
- FEMA flood zone
- X (unshaded)
- Chance of flooding over 30 yrs
- 0.0%
- Est. flood insurance / yr
- $507 – $1,088
Fire risk 5/10 · Moderate
- Est. fire insurance / yr
- $1,499 – $2,785
Heat risk 5/10 · Moderate
- Hot days now (above 109°F)
- 7 days/yr
- Hot days in 30 yrs
- 20 days/yr
Wind risk 2/10 · Minimal
- Chance of severe wind over 30 yrs
- 4.0%
Air-quality risk 2/10 · Minimal
- Unhealthy air days now
- 0 days/yr
- Unhealthy air days in 30 yrs
- 2 days/yr
Risk factors via First Street. Map © Google.
Why this score? — see what drove the C grade
The composite is a weighted blend of 9 inputs, each scored 0–100. Each bar is that input's sub-score; the figure is the points it added to the 100-point composite (weight × sub-score).
- Cash flow +19.0/30.0
- ARV discount +15.0/15.0
- DSCR +6.0/10.0
- Appreciation +6.0/10.0
- 1% rule +5.1/10.0
- Livability +2.8/5.0
- Rent growth +2.5/5.0
- Schools +2.0/10.0
- Condition / age +1.0/5.0
$110,000
🖨 Deal sheet 📄 Offer letter ✓ Due diligence
Key facts
- 10 acre lot
- Built 1990
- Listed 66 days
Neighborhood map
What this means for you Summary
Snapshot
- This is a 3-bed/1.0-bath single-family listed at $110k. Condition is rated poor.
Deal economics
- At list price, monthly cash flow is $114 ($1k/yr) — positive.
- The deal already cash-flows at list — no discount required.
- Meets the 1% rule at list price ($1k rent vs $110k).
- Recommended offer: $103k (6.0% below list) — sets the bar for market timing.
Location & tenants
- Location reads 55/100 on livability (#414 in AR) — a working-class tenant base; expect higher turnover. Strengths: cost of living A+, housing B+; Watch: health & safety C-, schools F, crime F.
- Maynard School District (rural): math 19% / reading 29% proficiency, ranked #197 of 238 in AR (top 83%) — low school quality limits family demand, transient renter base, plan for 1-2y turnover; 90% free/reduced lunch — lower-income household profile, screen leases tightly.
- Market conditions: 11 active listings in the ZIP; 6 units permitted in Randolph County in 2024 (5 in 5+ unit buildings).
Forward outlook
- In year one you build about $3k of equity ($761 loan paydown + $2k appreciation (1.9% local appreciation)).
- Randolph County population projected at -22% by 2050 — secular population decline; favor cash flow + early exit over multi-decade hold.
- At projected returns (1.9% appreciation + 3.0% rent growth), your $31k cash investment doubles in ~6 years — after that, you're playing with house money.
Negotiation context
- It's been on market 66 days — a 6% lower offer ($103k) is reasonable based on typical stale-listing flexibility.
Risks & watch-outs
- Climate carrying-cost: moderate wildfire risk; extreme-heat days projected 7→20/yr by 2055 (HVAC capex compounding) — expect insurance premiums to compound above CPI over the hold.
Questions for the listing agent
- It's been on market 66 days. Have you received any prior offers? Is the seller open to a 6% concession, seller financing, or rate buy-down credit?
- Have any recent inspections been done? Can we get a copy of the seller's disclosures and any deferred-maintenance estimates?
- Why hasn't it sold? Are there any deal-killer items the seller is aware of (foundation, flood, title, zoning, code violations)?
- Is there a deadline driving the sale (1031 exchange, divorce, estate, relocation)? That informs how much negotiation room exists.
- Schools are F-rated, which usually means shorter tenancies and higher turnover. Who's the typical renter profile here, and what's been the actual vacancy rate?
- Crime grade is F in this area — have there been break-ins, vandalism, or insurance claims at this property in the last 3 years? What carrier currently insures it and at what premium?
- What's the average days-on-market for RENTAL listings here right now (not sales)? A rising rental-DOM trend means longer vacancies and softer asking-rent achievability than the comps imply.
- What's the recent tenant-quality profile in this submarket — average credit score on applications, eviction rate, late-payment / NSF rate, and stable-employment percentage? A property-management company in the area should have these aggregated.
- How much new for-sale + rental construction is in the pipeline within 1–3 miles? Heavy new supply typically softens prices + rents 12–24 months out; constrained supply supports both.
Investment metrics
- 1% rule
- 1.01% ✓
- Cap rate
- 7.54%
- Cash-on-cash
- 4.44%
- DSCR
- 1.20
- GRM
- 8.3
CMA / ARV
- ARV (median comp)
- $174,022
- List price
- $110,000
- Delta
- -36.79%
- Verdict
- UNDERPRICED
- Comps
- 1 within 2.0 mi
Show comp detail 1 sale within ~0.75 mi
| Address | Dist | Beds/Ba | Sqft | Sold | Price | $/sf | Match |
|---|---|---|---|---|---|---|---|
| 13391 Highway 115 | 0.71mi | 3/2.0 | 1,305 (+2%) | 24mo | $168,000 | $129 | 40 |
Match score weights: distance 35% · size 25% · config 20% · recency 20%. Top-matched comps best support the ARV.
Projected returns pro-forma
1.94% appreciation · 3.0% rent growth · sell at horizon
- IRR
- 8.7%
- Equity multiple
- 1.47×
- Total profit
- $14,482
- Equity at exit
- $43,024
- IRR
- 11.9%
- Equity multiple
- 2.60×
- Total profit
- $49,278
- Equity at exit
- $61,679
Cash invested: $30,800 (down + closing). Projections, not guarantees.
Landlord ↔ Tenant lean methodology
- Overall (STATE)
- 92 Strongly Landlord-Friendly
- State Arkansas
- 92 Strongly Landlord-Friendly · R+14
- County
- — inherits STATE
- City
- — inherits STATE
ZIP-level market 72444
- Home prices YoY
- 1.6%
- Active inventory
- 11
- Price-to-rent
- 8.3×
Monthly cashflow live
- Estimated rent
- $1,107 medium interval (Pro) →
- Mortgage (P&I)
- −$577
- Tax est. 1.5%
- −$138 /mo · $1,650/yr
- Insurance
- −$46
- HOA
- −$0
- Vacancy / Maint / Mgmt
- −$232
- Net cashflow
- $114
Break-even live
UW: 25.0% down · 7.5% · 30yr · 1.5% tax · 5.0% vac · 8.0% maint · 8.0% mgmt
Financing live
Cash to close
- Down payment
- $27,500
- Closing costs
- $3,300
- Reserves months
- —
- Total cash needed
- —
Loan-product check · same deal, 3 products live
Conventional
25% down · 7.5% · 30yr
- Down + closing
- —
- Monthly P&I
- —
- Monthly cashflow
- —
- DSCR
- —
- Eligible?
- —
Personal DTI + credit; lowest rate.
DSCR
20% down · 8.5% · 30yr
- Down + closing
- —
- Monthly P&I
- —
- Monthly cashflow
- —
- DSCR
- —
- Eligible?
- —
No personal income docs; deal must DSCR.
Hard money
10% down · 12.0% · 12mo
- Down + closing
- —
- Monthly P&I
- —
- Monthly cashflow
- —
- DSCR
- —
- Eligible?
- —
Short-term bridge; refi at stabilization.
Listing history 17 events
-
2026-06-19days on market $110,000 Active 66 DOM
-
2026-06-18days on market $110,000 Active 65 DOM
-
2026-06-17days on market $110,000 Active 64 DOM
-
2026-06-16days on market $110,000 Active 63 DOM
-
2026-06-15days on market $110,000 Active 62 DOM
-
2026-06-14days on market $110,000 Active 60 DOM
-
2026-06-12days on market $110,000 Active 59 DOM
-
2026-06-09days on market $110,000 Active 56 DOM
-
2026-06-08days on market $110,000 Active 55 DOM
-
2026-06-07days on market $110,000 Active 54 DOM
-
2026-06-07days on market $110,000 Active 53 DOM
-
2026-06-04days on market $110,000 Active 50 DOM
-
2026-06-02days on market $110,000 Active 49 DOM
-
2026-06-01days on market $110,000 Active 48 DOM
-
2026-05-31days on market $110,000 Active 47 DOM
-
2026-05-31days on market $110,000 Active 46 DOM
-
2026-04-14$110,000 Active
ⓘ Source: listings_history table (triggers on properties + properties_extension) + one-shot
backfill from property_details.listing_events for pre-trigger history.
Climate risk First Street
- Flood 1/10 Low FEMA zone X (unshaded) · 0% chance over 30 yrs
- Wildfire 5/10 Major
- Heat 5/10 Major 7 d/yr ≥109°F today · 20 d/yr by 30 yrs out
- Wind 2/10 Low 4% chance of damaging wind over 30 yrs
- Air quality 2/10 Low 0 unhealthy d/yr today · 2 by 30 yrs out
Nearby sold comps map
Loading sold comps map…
Walkable amenities ~0.75 mi
Loading nearby amenities…
Taxation est. · year 1
- Rental income
- $13,280
- − Mortgage interest
- −$6,162
- − Property taxes
- −$1,650
- − Insurance
- −$550
- − Repairs & maintenance
- −$1,062
- − Management
- −$1,062
- − Depreciation
- −$3,200
- Taxable loss
- −$407
- Est. tax savings @ 24.0%
- +$98
- After-tax cash flow
- $1,466/yr
For passive investors: Depreciation is non-cash, so a rental often shows a tax loss while cash-flowing — sheltering income. Rental losses are passive: they offset passive income freely, and up to $25,000/yr can offset ordinary (W-2) income if you actively participate and your MAGI is under $100k (phasing out to $0 by $150k); unused losses carry forward. On sale, claimed depreciation is recaptured at up to 25%, and gains may owe capital-gains tax (a 1031 exchange can defer both). Figures are a year-1 estimate at your 24.0% rate — not tax advice; consult a CPA.
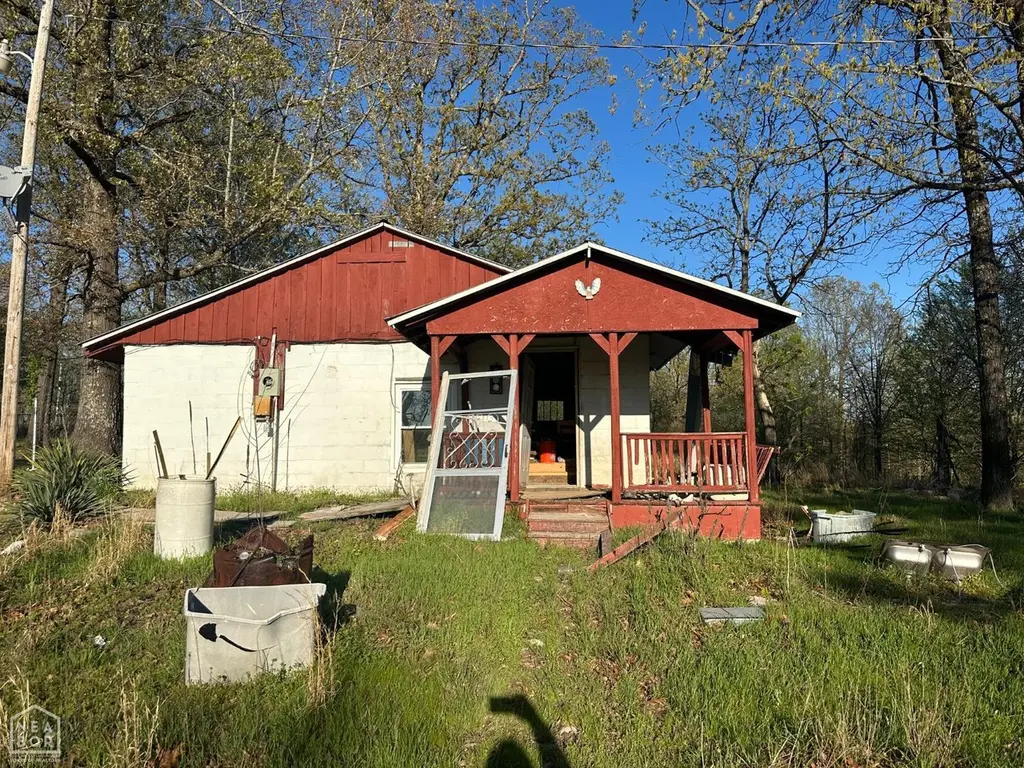
Condition & rehab AI · 1 photo
This property requires extensive repairs and maintenance to bring it up to a livable condition. Immediate focus should be on the roof and exterior to improve safety and curb appeal.
Repairs flagged
- Major roof — Signs of significant damage
- Major exterior siding — Severe overgrowth and debris
- Major interior walls — Visible wear and tear
- Major HVAC/mechanicals — No visible photos, but likely outdated
Value-add opportunities
- Both Landscaping and exterior cleaning — Enhances curb appeal and property value
- Both Roof repair — Critical to safety and property value
- Both Exterior siding repair — Improves appearance and value
- Both Interior wall repair and painting — Enhances interior appearance and value
- Both HVAC upgrade — Improves comfort and energy efficiency
Renovation cost estimate screening
| Repair item | Severity | Est. cost |
|---|---|---|
| roof · Signs of significant damage | Major | $15,000–50,000 |
| exterior siding · Severe overgrowth and debris | Major | $15,000–50,000 |
| interior walls · Visible wear and tear | Major | $15,000–50,000 |
| HVAC/mechanicals · No visible photos, but likely outdated | Major | $15,000–50,000 |
| Total estimated repair cost · 4 items | $60,000–200,000 |
Value-add ROI direction
- Both Landscaping and exterior cleaning — Enhances curb appeal and property value ↑
- Both Roof repair — Critical to safety and property value ↑
- Both Exterior siding repair — Improves appearance and value ↑
- Both Interior wall repair and painting — Enhances interior appearance and value ↑
- Both HVAC upgrade — Improves comfort and energy efficiency ↑
ⓘ Cost ranges are severity-bucket heuristics (US national rule-of-thumb). Get contractor quotes + a written scope before underwriting a rehab budget.
Schools (NCES district)
- District
- Maynard School District
- NCES district ID
- 0509570
- Math proficiency
- 19% ▼ -16.00%
- Reading proficiency
- 29% ▼ -2.00%
- Median HH income
- $32,489
- Composite
- 19.52/100
- National rank
- #8768
- State rank
- #197 of 238 in AR
Livability — Maynard
- Score
- 55/100
- State rank
- #414
- US rank
- #23648
Category grades
Schools grade is shown separately in the Schools card above.
Census & demographics
- Population (ZIP)
- 1,670
Population outlook (Randolph County) Hauer SSP2
- Today (2025)
- 16,421 people
- By 2030
- 15,733 · -4.2%
- By 2040
- 14,296 · -12.9%
- By 2050
- 12,884 · -21.5%
- By 2075
- 9,535 · -41.9%
- By 2100
- 6,520 · -60.3%
Race, ethnicity, and origin ACS 2023
- Neighborhood character
- Predominantly White (97%)
- Race & ethnicity
- White 97% Two or more races 3%
- Common ancestry
- Lithuanian 6% Slovak 1% Czech 1%
- Foreign-born
- 2% · Canada
- Languages at home
- 97% English-only · Other Indo-European 2% Spanish 2%
Political lean MEDSL · Randolph
- 2024 margin
- Solid R (+63.7) · D 17.1% · R 80.9% · Other 2.0%
- 2008→2024 swing
- -45.6pp toward R · 2008: -18.1pp · 2024: -63.7pp
- All cycles
- 2024: R+63.7 2020: R+60.8 2016: R+48.8 2012: R+27.9 2008: R+18.1
Not yet ingested
- Civics
- —
Market trends
- HPI YoY
- ▲ 1.94%
- Current HPI
- 121.7367
- Rent YoY
- —
- Metro
- —
- State GDP YoY
- ▲ 3.80%
- F500 in state
- 10
Industry mix (Fortune 500 HQ in AR)
| Industry | F500 HQs | Revenue |
|---|---|---|
| Retail | 1 | $681B |
|
||
| Food / Agriculture | 1 | $53B |
|
||
| Retail / Energy | 1 | $22B |
|
||
| Transportation / Logistics | 1 | $12B |
|
||
| Energy | 1 | $4B |
|
||
Price history
1 event — show timeline
- 2026-04-14 Listed $110,000 NEABOR MLS
Property tax history
+115.6%/yrLatest (2025): $202 · +0.0% YoY. Source: county tax records.
Cash-flow waterfall
monthlySold comps — $/sqft
last 12 mo · ≤1 miLoading sold comps…