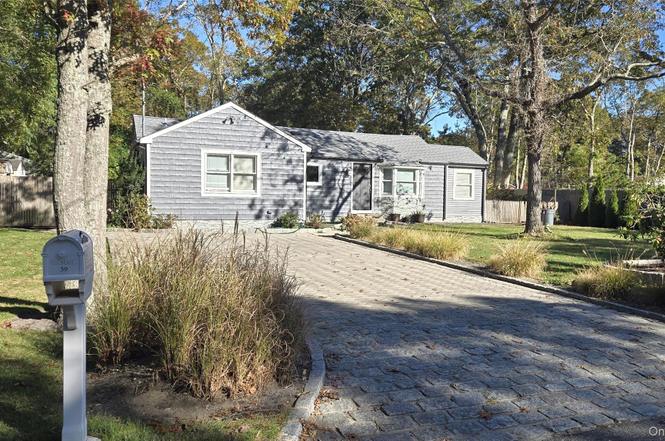
39 Lynncliff Rd · Hampton Bays, NY
Flood risk 1/10 · Minimal
- FEMA flood zone
- X (unshaded)
- Chance of flooding over 30 yrs
- 0.0%
- Est. flood insurance / yr
- $473 – $860
Fire risk 1/10 · Minimal
- Est. fire insurance / yr
- $691 – $1,283
Heat risk 4/10 · Minor
- Hot days now (above 90°F)
- 7 days/yr
- Hot days in 30 yrs
- 20 days/yr
Wind risk 8/10 · Major
- Chance of severe wind over 30 yrs
- 80.0%
Air-quality risk 3/10 · Minor
- Unhealthy air days now
- 2 days/yr
- Unhealthy air days in 30 yrs
- 3 days/yr
Risk factors via First Street. Map © Google.
Why this score? — see what drove the C- grade
The composite is a weighted blend of 9 inputs, each scored 0–100. Each bar is that input's sub-score; the figure is the points it added to the 100-point composite (weight × sub-score).
- Cash flow +20.7/30.0
- DSCR +6.6/10.0
- Rent growth +5.0/5.0
- 1% rule +4.5/10.0
- ARV discount +4.0/15.0
- Schools +4.0/10.0
- Livability +3.4/5.0
- Condition / age +2.5/5.0
- Appreciation +0.0/10.0
$825,000
🖨 Deal sheet 📄 Offer letter ✓ Due diligence
Listing remarks
Have you ever dreamed of living just minutes from the beach? Now’s your chance. Perfectly situated in the heart of Hampton Bays just 7 minutes from the ocean this beautifully maintained and recently updated ranch is truly move-in ready and offers the ideal Hamptons retreat. Step inside to a bright and airy open-concept living space featuring soaring cathedral ceilings, abundant natural light, and effortless flow from the living room to the kitchen, complete with sleek stainless steel appliances. Double French doors lead out to a spacious deck and a meticulously landscaped backyard, creating the perfect setting for seamless indoor-outdoor living and summer entertaining. The exterior fe
Key facts
- 0.31 acre lot
- Built 1992
- Listed 165 days
Property features AI
Exterior
- Parking: Driveway
- Utilities: Cesspool sewer; Electricity connected; Propane
- Home design: Single family residence
- Construction: Partial basement; Crawl and partial attic
- Exterior features: Frame, stone and vinyl siding exterior; Not waterfront
Interior
- Kitchen: Dishwasher; Electric oven; Gas cooktop; Refrigerator; Stainless steel appliances
- Bedrooms: Includes a first-floor bedroom
- Flooring: Laminate
- Bathrooms: 2 full bathrooms
- Heating & cooling: Electric heating; No central cooling
- Interior features: First-floor bedroom; First-floor full bath; Cathedral ceilings; Kitchen island; Open floor plan; Primary bathroom; Washer/dryer hookup; Partial basement
- Laundry & utility: Washer/dryer hookup
Neighborhood map
What this means for you Summary
Snapshot
- This is a 2-bed/2.0-bath single-family listed at $825k.
Deal economics
- At list price, monthly cash flow is $1k ($13k/yr) — positive.
- The deal already cash-flows at list — no discount required.
- To meet the 1% rule (rent ≥ 1% of price), the offer needs to be $784k (5.0% below list).
- Recommended offer: $726k (12.0% below list) — sets the bar for market timing.
- Cap rate 7.9% vs local median 6.4% in Hampton Bays — meaningfully above typical; check what's discounted (condition, days-on-market, listing class) to confirm the premium yield is real.
Location & tenants
- Location reads 68/100 on livability (#551 in NY) — a middle-class / working-renter tenant base. Strengths: crime A+, employment A+, health & safety B+; Watch: amenities F, commute F, cost of living F.
- Hampton Bays Union Free School District (suburban): math 45% / reading 44% proficiency, ranked #434 of 590 in NY (top 74%) — families likely to look elsewhere, expect single-tenant / working-renter base with shorter leases.
- Zoned schools: Hampton Bays Elementary School (math 32% / reading 52%, grade F, #1,361 of 2,108 statewide, top 67%, 682 students, 55% FRL); Hampton Bays Middle School (math 25% / reading 38%, grade F, #522 of 729 statewide, top 73%, 597 students, 64% FRL); Hampton Bays High School (math 98% / reading 57%, grade A-, #580 of 1,100 statewide, top 53%, 769 students, 53% FRL) — zoned schools average 58% FRL vs 38% district-wide (20 pts higher); higher-poverty schools than district average — tighter screening recommended.
- Market conditions: Rents rising fast (+16.1%/yr); 172 active listings in the ZIP; 17 comparable units currently listed for rent nearby; rentals at typical pace (median 25d on market — plan ~3-4 weeks tenant-placement turnaround); high-income renter base; 1,366 units permitted in Suffolk County in 2024 (216 in 5+ unit buildings).
- At $7,838/mo this rent would consume 70% of the median local household income ($134k/yr) (locally 199% of renters already pay >50% of income on rent) — very limited rent-growth headroom before tenants either downsize or default.
Forward outlook
- Local home prices are declining (-3.0%/yr); year-one equity from $6k of loan paydown is wiped out by about $25k of value loss. Plan a longer hold.
- Suffolk County population projected to shrink 5% by 2050 — rents likely to lag national; underwrite the cash flow, not the appreciation.
- At projected returns (-3.0% appreciation + 8.0% rent growth), your $231k cash investment doubles in ~9 years — after that, you're playing with house money.
Negotiation context
- It's been on market 165 days — a 12% lower offer ($726k) is reasonable based on typical stale-listing flexibility.
- Current owner paid $330k; list at $825k implies a 150% gain — meaningful room to come down on a strong offer.
Risks & watch-outs
- Climate carrying-cost: severe wind risk, 80% chance of damaging wind over 30y — expect insurance premiums to compound above CPI over the hold.
Questions for the listing agent
- It's been on market 165 days. Have you received any prior offers? Is the seller open to a 12% concession, seller financing, or rate buy-down credit?
- Why hasn't it sold? Are there any deal-killer items the seller is aware of (foundation, flood, title, zoning, code violations)?
- Is there a deadline driving the sale (1031 exchange, divorce, estate, relocation)? That informs how much negotiation room exists.
- Schools are B-rated — typically a magnet for longer-tenancy family renters. What's the average tenant stay here, and is there a school-zone premium baked into asking?
- What's the average days-on-market for RENTAL listings here right now (not sales)? A rising rental-DOM trend means longer vacancies and softer asking-rent achievability than the comps imply.
- What's the recent tenant-quality profile in this submarket — average credit score on applications, eviction rate, late-payment / NSF rate, and stable-employment percentage? A property-management company in the area should have these aggregated.
- How much new for-sale + rental construction is in the pipeline within 1–3 miles? Heavy new supply typically softens prices + rents 12–24 months out; constrained supply supports both.
Investment metrics
- 1% rule
- 0.95% ✗
- Cap rate
- 7.91%
- Cash-on-cash
- 5.79%
- DSCR
- 1.26
- GRM
- 8.8
CMA / ARV
- ARV (on-the-fly)
- $765,056
- Comps found
- 12
Show comp detail 12 sales within ~0.75 mi
| Address | Dist | Beds/Ba | Sqft | Sold | Price | $/sf | Match |
|---|---|---|---|---|---|---|---|
| 39 Lynncliff Rd | 0.00mi | 3/2.0 (+1) | 1,112 (0%) | 0mo | $790,000 | $710 | 95 |
| 4 Holiday Ct | 0.12mi | 3/2.0 (+1) | 1,097 (-1%) | 6mo | $700,000 | $638 | 82 |
| 7 Harvard Dr | 0.33mi | 2/2.0 | 1,228 (+10%) | 2mo | $815,000 | $664 | 66 |
| 28 Kyle Rd | 0.19mi | 3/2.0 (+1) | 1,008 (-9%) | 12mo | $770,000 | $764 | 60 |
| 18 Lovell Rd | 0.52mi | 3/1.5 (+1) | 1,100 (-1%) | 12mo | $818,000 | $744 | 57 |
| 12 Harvard Dr | 0.30mi | 3/1.0 (+1) | 1,016 (-9%) | 10mo | $717,000 | $706 | 54 |
| 8 Park Ln | 0.49mi | 2/2.0 | 1,000 (-10%) | 9mo | $685,000 | $685 | 53 |
| 6 Westerly Ct | 0.34mi | 3/1.0 (+1) | 1,276 (+15%) | 6mo | $755,000 | $592 | 45 |
| 23 Chevy Chase Rd | 0.54mi | 3/1.0 (+1) | 1,025 (-8%) | 10mo | $699,000 | $682 | 45 |
| 38 Woodridge Rd | 0.65mi | 3/1.0 (+1) | 1,200 (+8%) | 6mo | $825,000 | $688 | 42 |
| 5 Chevy Chase Rd | 0.71mi | 2/1.0 | 1,025 (-8%) | 11mo | $643,500 | $628 | 40 |
| 10 Argonne Rd W | 0.65mi | 3/1.0 (+1) | 980 (-12%) | 6mo | $707,000 | $721 | 36 |
Match score weights: distance 35% · size 25% · config 20% · recency 20%. Top-matched comps best support the ARV.
Projected returns pro-forma
-3.0% appreciation · 8.0% rent growth · sell at horizon
- IRR
- -2.4%
- Equity multiple
- 0.91×
- Total profit
- $-21,548
- Equity at exit
- $123,010
- IRR
- 11.8%
- Equity multiple
- 2.13×
- Total profit
- $260,089
- Equity at exit
- $71,331
Cash invested: $231,000 (down + closing). Projections, not guarantees.
Landlord ↔ Tenant lean methodology
- Overall (STATE)
- 15 Strongly Tenant-Friendly
- State New York
- 15 Strongly Tenant-Friendly · D+10
- County
- — inherits STATE
- City
- — inherits STATE
ZIP-level market 11946
- Home prices YoY
- -20.3%
- Rents YoY
- 16.1%
- Active inventory
- 172
- Price-to-rent
- 8.8×
Monthly cashflow live
- Estimated rent
- $7,838 high interval (Pro) →
- Mortgage (P&I)
- −$4,326
- Tax from tax record
- −$408 /mo · $4,890/yr
- Insurance
- −$344
- HOA
- −$0
- Vacancy / Maint / Mgmt
- −$1,646
- Net cashflow
- $1,114
Break-even live
UW: 25.0% down · 7.5% · 30yr · 1.5% tax · 5.0% vac · 8.0% maint · 8.0% mgmt
Financing live
Cash to close
- Down payment
- $206,250
- Closing costs
- $24,750
- Reserves months
- —
- Total cash needed
- —
Loan-product check · same deal, 3 products live
Conventional
25% down · 7.5% · 30yr
- Down + closing
- —
- Monthly P&I
- —
- Monthly cashflow
- —
- DSCR
- —
- Eligible?
- —
Personal DTI + credit; lowest rate.
DSCR
20% down · 8.5% · 30yr
- Down + closing
- —
- Monthly P&I
- —
- Monthly cashflow
- —
- DSCR
- —
- Eligible?
- —
No personal income docs; deal must DSCR.
Hard money
10% down · 12.0% · 12mo
- Down + closing
- —
- Monthly P&I
- —
- Monthly cashflow
- —
- DSCR
- —
- Eligible?
- —
Short-term bridge; refi at stabilization.
Rent comps 17 comps
| Address | Beds | Baths | Sqft | Rent | $/sqft | DOM | Units | Dist |
|---|---|---|---|---|---|---|---|---|
| 6 Long Ln Hampton Bays, NY | 2.0 | 2.0 | 1163 | $40,000 | $34.39 | 24d | 1 | 0.14mi |
| 40 Kyle Rd Hampton Bays, NY | 3.0 | 2.0 | 1320 | $5,000 | $3.79 | 43d | 1 | 0.21mi |
| 121 Ponquogue Ave Hampton Bays, NY | 3.0 | 3.0 | 1316 | $27,000 | $20.52 | 24d | 1 | 0.43mi |
| 94 Bay Ave E Hampton Bays, NY | 2.0 | 2.0 | 1000 | $20,000 | $20.00 | 15d | 1 | 0.53mi |
| 71 Hampton Rd Hampton Bays, NY | 3.0 | 2.5 | 1500 | $18,000 | $12.00 | 24d | 1 | 0.61mi |
| 38 Woodridge Rd Hampton Bays, NY | 3.0 | 1.0 | 1398 | $8,000 | $5.72 | 24d | 1 | 0.66mi |
| 3 Foster Ave Hampton Bays, NY | 2.0 | 2.0 | 1400 | $5,000 | $3.57 | 43d | 1 | 0.67mi |
| 111 Fanning Ave Hampton Bays, NY | 3.0 | 2.0 | 1474 | $20,000 | $13.57 | 5d | 1 | 0.74mi |
| 28 Bay Ave W Hampton Bays, NY | 3.0 | 2.5 | 945 | $66,000 | $69.84 | 43d | 1 | 0.79mi |
| 6 Lynn Ct Hampton Bays, NY | 2.0 | 2.0 | 1212 | $2,900 | $2.39 | 43d | 1 | 0.82mi |
| 229 Springville Rd Hampton Bays, NY | 2.0 | 2.0 | 1200 | $6,000 | $5.00 | 19d | 1 | 0.89mi |
| 3 Debbie Trl Hampton Bays, NY | 3.0 | 2.0 | 1375 | $5,500 | $4.00 | 20d | 1 | 0.91mi |
| 18 Old Riverhead Rd Hampton Bays, NY | 3.0 | 2.0 | 1056 | $13,500 | $12.78 | 24d | 1 | 0.96mi |
| 25 Gardners Ln Unit A Hampton Bays, NY | 2.0 | 1.5 | 1000 | $3,750 | $3.75 | 24d | 1 | 1.12mi |
| 68 Foster Ave #12 Hampton Bays, NY | 2.0 | 1.5 | 1125 | $18,000 | $16.00 | 43d | 1 | 1.16mi |
| 129 Lamplight Cir Hampton Bays, NY | 1.0 | 1.0 | 734 | $3,245 | $4.42 | 6d | 12 | 1.24mi |
| 51 Ocean Ave Hampton Bays, NY | 3.0 | 2.0 | 1200 | $5,000 | $4.17 | 43d | 1 | 1.30mi |
Listing history 7 events
-
2026-04-14status Pending
-
2026-02-26price $825,000
-
2025-12-29price $875,000
-
2025-11-01$895,000 Active
-
2025-10-27historical $895,000
-
2017-05-26soldstatus $330,000
-
1997-05-22soldstatus $68,500
ⓘ Source: listings_history table (triggers on properties + properties_extension) + one-shot
backfill from property_details.listing_events for pre-trigger history.
Tax reassessment forecast NY · Partial reset (capped growth)
- Current annual tax
- $4,890 · $408/mo
- Projected year-2 tax
- $9,416 · $785/mo
- Expected delta
- +$4,526/yr (+$377/mo · 92.6%)
ⓘ Screening estimate from a state-policy table — verify with the county assessor before closing.
Climate risk First Street
- Flood 1/10 Low FEMA zone X (unshaded) · 0% chance over 30 yrs
- Wildfire 1/10 Low
- Heat 4/10 Moderate 7 d/yr ≥90°F today · 20 d/yr by 30 yrs out
- Wind 8/10 Severe 80% chance of damaging wind over 30 yrs
- Air quality 3/10 Moderate 2 unhealthy d/yr today · 3 by 30 yrs out
Nearby sold comps map
Loading sold comps map…
Walkable amenities ~0.75 mi
Loading nearby amenities…
Taxation est. · year 1
- Rental income
- $94,057
- − Mortgage interest
- −$46,213
- − Property taxes
- −$4,890
- − Insurance
- −$4,125
- − Repairs & maintenance
- −$7,525
- − Management
- −$7,525
- − Depreciation
- −$24,000
- Taxable loss
- −$220
- Est. tax savings @ 24.0%
- +$53
- After-tax cash flow
- $13,426/yr
For passive investors: Depreciation is non-cash, so a rental often shows a tax loss while cash-flowing — sheltering income. Rental losses are passive: they offset passive income freely, and up to $25,000/yr can offset ordinary (W-2) income if you actively participate and your MAGI is under $100k (phasing out to $0 by $150k); unused losses carry forward. On sale, claimed depreciation is recaptured at up to 25%, and gains may owe capital-gains tax (a 1031 exchange can defer both). Figures are a year-1 estimate at your 24.0% rate — not tax advice; consult a CPA.
Schools (NCES district)
- District
- Hampton Bays Union Free School District
- NCES district ID
- 3613530
- Math proficiency
- 45% ▼ -8.00%
- Reading proficiency
- 44% ▼ -1.00%
- Median HH income
- $70,274
- Composite
- 40.18/100
- National rank
- #3788
- State rank
- #434 of 590 in NY
Livability — Hampton Bays
- Score
- 68/100
- State rank
- #551
- US rank
- #9894
Category grades
Schools grade is shown separately in the Schools card above.
Census & demographics
- Census place
- Hampton Bays, NY
- County
- Suffolk County · 679,920 people
- City population
- 15,819
- Metro
- New York-Newark-Jersey City, NY-NJ-PA
- Population (ZIP)
- 15,819
- Household income
- $133,918
- Rent vs Own
- Severe rent burden
- 199.0
Population outlook (Suffolk County) Hauer SSP2
- Today (2025)
- 1,505,262 people
- By 2030
- 1,498,318 · -0.5%
- By 2040
- 1,471,101 · -2.3%
- By 2050
- 1,424,848 · -5.3%
- By 2075
- 1,337,157 · -11.2%
- By 2100
- 1,217,720 · -19.1%
Race, ethnicity, and origin ACS 2023
- Neighborhood character
- Majority White (62%)
- Race & ethnicity
- White 62% Hispanic / Latino 32% Two or more races 13% Asian 3% Black 2%
- Hispanic origin (detail)
- Mexican 6%
- Common ancestry
- Romanian 4% Slovak 2% Portuguese 2%
- Foreign-born
- 26% · Canada, Jamaica, Guatemala
- Languages at home
- 64% English-only · Spanish 29% Other Indo-European 2% French/Haitian/Cajun 2%
Political lean MEDSL · Suffolk
- 2024 margin
- Lean R (+10.0) · D 45.0% · R 55.0%
- 2008→2024 swing
- -16.0pp toward R · 2008: 6.0pp · 2024: -10.0pp
- All cycles
- 2024: R+10.0 2020: R+0.0 2016: R+8.2 2012: D+2.9 2008: D+6.0
Not yet ingested
- Civics
- —
Market trends
- HPI YoY
- ▼ -118.82%
- Current HPI
- 467.2466
- Rent YoY
- ▲ 16.07%
- Metro
- New York-Newark-Jersey City, NY-NJ-PA
- State GDP YoY
- ▲ 2.60%
- F500 in state
- 92
Industry mix (Fortune 500 HQ in NY)
| Industry | F500 HQs | Revenue |
|---|---|---|
| Financial Services | 10 | $950B |
|
||
| Consumer Goods | 9 | $162B |
|
||
| Insurance | 4 | $225B |
|
||
| Telecommunications | 2 | $144B |
|
||
| Pharmaceuticals | 2 | $112B |
|
||
| Media / Entertainment | 2 | $69B |
|
||
Price history
+1104.4% since first listed7 events — show timeline
- 2026-04-14 Pending — OneKey® MLS as Distributed by MLS Grid
- 2026-02-26 Price Changed $825,000 OneKey® MLS as Distributed by MLS Grid
- 2025-12-29 Price Changed $875,000 OneKey® MLS as Distributed by MLS Grid
- 2025-11-01 Listed $895,000 OneKey® MLS as Distributed by MLS Grid
- 2025-10-27 Coming Soon $895,000 OneKey® MLS as Distributed by MLS Grid
- 2017-05-26 Sold (Public Records) $330,000 Public Records
- 1997-05-22 Sold (Public Records) $68,500 Public Records
Property tax history
+0.3%/yrLatest (2024): $4,890 · +0.0% YoY. Source: county tax records.
Cash-flow waterfall
monthlySold comps — $/sqft
last 12 mo · ≤1 miLoading sold comps…