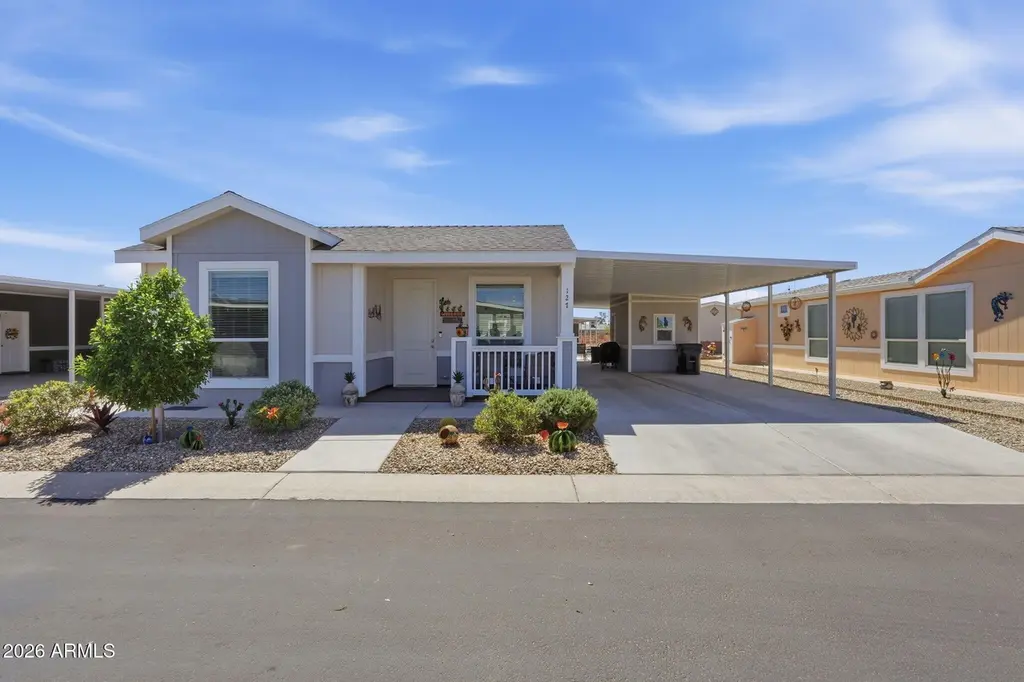
312 E O'neil Dr #127 · Casa Grande, AZ
Flood risk 1/10 · Minimal
- FEMA flood zone
- X (unshaded)
- Chance of flooding over 30 yrs
- 0.0%
- Est. flood insurance / yr
- $507 – $1,088
Fire risk 6/10 · Moderate
- Est. fire insurance / yr
- $610 – $1,132
Heat risk 9/10 · Severe
- Hot days now (above 113°F)
- 7 days/yr
- Hot days in 30 yrs
- 20 days/yr
Wind risk 1/10 · Minimal
- Chance of severe wind over 30 yrs
- —
Air-quality risk 2/10 · Minimal
- Unhealthy air days now
- 1 days/yr
- Unhealthy air days in 30 yrs
- 1 days/yr
Risk factors via First Street. Map © Google.
Why this score? — see what drove the C- grade
The composite is a weighted blend of 9 inputs, each scored 0–100. Each bar is that input's sub-score; the figure is the points it added to the 100-point composite (weight × sub-score).
- Cash flow +19.5/30.0
- ARV discount +7.6/15.0
- DSCR +6.2/10.0
- 1% rule +5.2/10.0
- Condition / age +3.8/5.0
- Rent growth +3.7/5.0
- Livability +2.9/5.0
- Schools +1.5/10.0
- Appreciation +0.0/10.0
$179,900
🖨 Deal sheet (PDF) 📄 Offer letter ✓ Due diligence
Listing remarks
This beautifully maintained home has been meticulously cared for and truly shows pride of ownership throughout. Enjoy your morning coffee on the inviting front porch as you greet your new neighbors and take in the peaceful surroundings of this welcoming community. Step inside to an open and airy floor plan featuring 2 bedrooms and 2 bathrooms, perfectly designed for both everyday living and entertaining. The charming eat-in kitchen offers bay windows that fill the space with natural light, abundant cabinetry, generous counter space, and a bar, ideal for gathering with family and friends. Luxury vinyl flooring flows through the kitchen, bathrooms, and hallway, adding both style and durabilit
Key facts
- Gated community
- Front porch
- Covered patio
Tags
Property features AI
Finance
- Other: Directions: From Pinal, go east on O'Neil and the park entrance will be on the left. Enter through gates and take second left; house will be on the left.
- HOA & community: Land lease of $450 monthly; No association fees included; Community pool; Pickleball courts; Biking/walking path; Fitness center
Exterior
- Parking: 2 covered parking spaces; RV access/parking; Off-site parking; 2 carport spaces
- Security: Gated community
- Utilities: City water; Public sewer
- Home design: Leasehold ownership; Manufactured/Mobile home
- Construction: Board & batten siding; Wood frame construction; Painted exterior
- Exterior features: Storage; No fencing; Front sprinklers; Desert landscaping in front; Natural desert in back; Composition roof
Interior
- Kitchen: Built-in microwave; Pantry; Eat-in kitchen; Refrigerator; Dishwasher; Disposal
- Bedrooms: 2 bedrooms (possible)
- Flooring: Carpet; Vinyl
- Bathrooms: 2 full bathrooms
- Heating & cooling: Heat pump heating; Electric heating; Ceiling heating; Heat pump cooling; Ceiling fan(s); Programmable thermostat
- Interior features: High-speed internet; Double vanity in bathroom; Eat-in kitchen; No interior steps; Pantry; Master bedroom with 3/4 bath; Low-emissivity, dual-pane windows; Zero-grade (no-step) entry; Refrigerator, Dishwasher, Disposal
- Laundry & utility: Laundry located inside
Neighborhood map
What this means for you Summary
Snapshot
- This is a 2-bed/2.0-bath manufactured listed at $180k. Condition is rated good.
Deal economics
- At list price, monthly cash flow is $203 ($2k/yr) — positive.
- The deal already cash-flows at list — no discount required.
- Meets the 1% rule at list price ($2k rent vs $180k).
- Recommended offer: $169k (6.0% below list) — sets the bar for market timing.
- Cap rate 7.6% vs local median 4.0% in Casa Grande — top-decile yield for the area; either an underpriced asset or a hidden risk that comps aren't pricing in. Stress-test before assuming the spread holds.
Location & tenants
- Location reads 58/100 on livability (#220 in AZ) — a working-class tenant base; expect higher turnover. Strengths: cost of living A+, housing A+; Watch: crime D+, employment D+, amenities F.
- Casa Grande Union High School District (4453) (suburban): math 14% / reading 21% proficiency, ranked #193 of 249 in AZ (top 78%) — low school quality limits family demand, transient renter base, plan for 1-2y turnover.
- Zoned schools: Cottonwood Elementary School (math 8% / reading 8%, grade F, #1,056 of 1,109 statewide, top 96%, 451 students, 89% FRL); Casa Grande Middle School (math 7% / reading 12%, grade F, #197 of 218 statewide, top 91%, 645 students, 84% FRL); Casa Grande Union High School (math 18% / reading 25%, grade F, #217 of 381 statewide, top 57%, 2,132 students, 52% FRL).
- Market conditions: Rents rising fast (+4.6%/yr); 632 active listings in the ZIP; 26 comparable units currently listed for rent nearby; rentals at typical pace (median 26d on market — plan ~3-4 weeks tenant-placement turnaround); 9,504 units permitted in Pinal County in 2024 (776 in 5+ unit buildings).
- This rent runs 32% of the median local income ($68k/yr) — at the standard rent-burdened threshold; future hikes will face affordability resistance.
Forward outlook
- Local home prices are declining (-3.0%/yr); year-one equity from $1k of loan paydown is wiped out by about $5k of value loss. Plan a longer hold.
Negotiation context
- It's been on market 75 days — a 6% lower offer ($169k) is reasonable based on typical stale-listing flexibility.
Risks & watch-outs
- Climate carrying-cost: major wildfire risk; extreme-heat days projected 7→20/yr by 2055 (HVAC capex compounding) — expect insurance premiums to compound above CPI over the hold.
Questions for the listing agent
- It's been on market 75 days. Have you received any prior offers? Is the seller open to a 6% concession, seller financing, or rate buy-down credit?
- Why hasn't it sold? Are there any deal-killer items the seller is aware of (foundation, flood, title, zoning, code violations)?
- Is there a deadline driving the sale (1031 exchange, divorce, estate, relocation)? That informs how much negotiation room exists.
- Schools are F-rated, which usually means shorter tenancies and higher turnover. Who's the typical renter profile here, and what's been the actual vacancy rate?
- Crime grade is D in this area — have there been break-ins, vandalism, or insurance claims at this property in the last 3 years? What carrier currently insures it and at what premium?
- What's the average days-on-market for RENTAL listings here right now (not sales)? A rising rental-DOM trend means longer vacancies and softer asking-rent achievability than the comps imply.
- What's the recent tenant-quality profile in this submarket — average credit score on applications, eviction rate, late-payment / NSF rate, and stable-employment percentage? A property-management company in the area should have these aggregated.
- How much new for-sale + rental construction is in the pipeline within 1–3 miles? Heavy new supply typically softens prices + rents 12–24 months out; constrained supply supports both.
Investment metrics
- 1% rule
- 1.02% ✓
- Cap rate
- 7.65%
- Cash-on-cash
- 4.83%
- DSCR
- 1.22
- GRM
- 8.2
CMA / ARV
- ARV (on-the-fly)
- $180,336
- Comps found
- 12
Show comp detail 12 sales within ~0.75 mi
| Address | Dist | Beds/Ba | Sqft | Sold | Price | $/sf | Match |
|---|---|---|---|---|---|---|---|
| 312 E O'neil Dr #161 | 0.00mi | 2/2.0 | 1,296 (-2%) | 12mo | $175,000 | $135 | 86 |
| 312 E O'neil Dr #112 | 0.00mi | 3/2.0 (+1) | 1,379 (+4%) | 14mo | $189,000 | $137 | 76 |
| 312 E O'neil Dr #115 | 0.00mi | 2/2.0 | 1,166 (-12%) | 5mo | $160,000 | $137 | 76 |
| 312 E O'neil Dr #113 | 0.00mi | 2/2.0 | 1,166 (-12%) | 11mo | $179,000 | $154 | 70 |
| 120 W O'neil Dr #84 | 0.46mi | 2/2.0 | 1,352 (+2%) | 7mo | $70,000 | $52 | 70 |
| 312 E O'neil Dr #123 | 0.00mi | 2/2.0 | 1,486 (+12%) | 12mo | $189,000 | $127 | 70 |
| 312 E O'neil Dr #103 | 0.49mi | 3/2.0 (+1) | 1,344 (+1%) | 1mo | $140,000 | $104 | 69 |
| 312 E O'neil Dr #159 | 0.00mi | 2/2.0 | 1,486 (+12%) | 14mo | $200,000 | $135 | 68 |
| 312 E O'neil Dr #156 | 0.49mi | 2/2.0 | 1,260 (-5%) | 11mo | $183,000 | $145 | 60 |
| 312 E O'neil Dr #121 | 0.49mi | 2/2.0 | 1,274 (-4%) | 14mo | $173,000 | $136 | 59 |
| 312 E O'neil Dr #130 | 0.49mi | 2/2.0 | 1,260 (-5%) | 12mo | $175,000 | $139 | 59 |
| 312 E O'neil Dr #148 | 0.44mi | 3/2.0 (+1) | 1,512 (+14%) | 18mo | $169,500 | $112 | 36 |
Match score weights: distance 35% · size 25% · config 20% · recency 20%. Top-matched comps best support the ARV.
Projected returns pro-forma
-3.0% appreciation · 4.6% rent growth · sell at horizon
- IRR
- -7.0%
- Equity multiple
- 0.74×
- Total profit
- $-13,209
- Equity at exit
- $26,824
- IRR
- 4.5%
- Equity multiple
- 1.36×
- Total profit
- $17,942
- Equity at exit
- $15,554
Cash invested: $50,372 (down + closing). Projections, not guarantees.
Landlord ↔ Tenant lean methodology
- Overall (STATE)
- 87 Strongly Landlord-Friendly
- State Arizona
- 87 Strongly Landlord-Friendly · R+3
- County
- — inherits STATE
- City
- — inherits STATE
ZIP-level market 85122
- Home prices YoY
- -22.4%
- Rents YoY
- 4.6%
- Active inventory
- 632
- Price-to-rent
- 8.2×
Monthly cashflow live
- Estimated rent
- $1,831 high interval (Pro) →
- Mortgage (P&I)
- −$943
- Tax est. 1.5%
- −$225 /mo · $2,698/yr
- Insurance
- −$75
- HOA
- −$0
- Vacancy / Maint / Mgmt
- −$384
- Net cashflow
- $203
Break-even live
Sensitivity live
| Price | -10% $327 | -5% $265 | +0% $203 | +5% $141 | +10% $79 |
|---|---|---|---|---|---|
| Rent | -10% $58 | -5% $131 | +0% $203 | +5% $275 | +10% $347 |
| Rate | -1.0pp $293 | -0.5pp $249 | base $203 | +0.5pp $156 | +1.0pp $109 |
UW: 25.0% down · 7.5% · 30yr · 1.5% tax · 5.0% vac · 8.0% maint · 8.0% mgmt
Financing live
Cash to close
- Down payment
- $44,975
- Closing costs
- $5,397
- Reserves months
- —
- Total cash needed
- —
Loan-product check · same deal, 3 products live
Conventional
25% down · 7.5% · 30yr
- Down + closing
- —
- Monthly P&I
- —
- Monthly cashflow
- —
- DSCR
- —
- Eligible?
- —
Personal DTI + credit; lowest rate.
DSCR
20% down · 8.5% · 30yr
- Down + closing
- —
- Monthly P&I
- —
- Monthly cashflow
- —
- DSCR
- —
- Eligible?
- —
No personal income docs; deal must DSCR.
Hard money
10% down · 12.0% · 12mo
- Down + closing
- —
- Monthly P&I
- —
- Monthly cashflow
- —
- DSCR
- —
- Eligible?
- —
Short-term bridge; refi at stabilization.
Rent comps 26 comps
| Address | Beds | Baths | Sqft | Rent | $/sqft | DOM | Units | Dist |
|---|---|---|---|---|---|---|---|---|
| 1858 N Center Ave Casa Grande, AZ | 2.0 | 2.0 | 1146 | $1,500 | $1.31 | 26d | 1 | 0.11mi |
| 1926 N Avenida de Palmas Casa Grande, AZ | 2.0 | 2.0 | 1106 | $1,199 | $1.08 | 23d | 3 | 0.58mi |
| 520 W Casa Mirage Ct Casa Grande, AZ | 3.0 | 2.0 | 1536 | $1,600 | $1.04 | 6d | 1 | 0.59mi |
| 2094 N Sweetwater Dr Casa Grande, AZ | 3.0 | 2.0 | 1266 | $1,700 | $1.34 | 26d | 1 | 0.65mi |
| 1775 N Terrace Cir Casa Grande, AZ | 3.0 | 2.0 | 1628 | $1,699 | $1.04 | 16d | 1 | 0.67mi |
| 645 W Jardin Dr Casa Grande, AZ | 3.0 | 2.0 | 1309 | $1,650 | $1.26 | 26d | 1 | 0.68mi |
| 1640 N Cameron St Casa Grande, AZ | 3.0 | 2.0 | 1577 | $3,250 | $2.06 | 25d | 1 | 0.72mi |
| 1640 N Cameron St Casa Grande, AZ | 3.0 | 2.0 | 1577 | $3,250 | $2.06 | 23d | 1 | 0.72mi |
| 1640 N Cameron St Unit 1640 Casa Grande, AZ | 3.0 | 2.5 | 1577 | $3,250 | $2.06 | 26d | 1 | 0.72mi |
| 1642 N Cameron St Casa Grande, AZ | 3.0 | 2.5 | 1577 | $3,250 | $2.06 | 26d | 1 | 0.73mi |
| 1641 N Kadota Ave Casa Grande, AZ | 1.0–2.0 | 1.0–2.0 | 750 | $1,100 | $1.47 | 0d | 3 | 0.74mi |
| 1936 N Trekell Rd Casa Grande, AZ | 1.0–4.0 | 1.0–2.0 | 1033 | $1,492 | $1.44 | 0d | 31 | 0.78mi |
| 736 W Palo Verde Dr Casa Grande, AZ | 3.0 | 2.0 | 1810 | $3,550 | $1.96 | 26d | 1 | 0.88mi |
| 2060 N Trekell Rd Casa Grande, AZ | 2.0 | 1.0–2.0 | 670 | $1,300 | $1.94 | 26d | 4 | 0.91mi |
| 1564 N Morrison Ave Casa Grande, AZ | 2.0–3.0 | 2.0 | 871 | $956 | $1.10 | 0d | 19 | 0.92mi |
| 767 W Barrus Dr Casa Grande, AZ | 3.0 | 2.0 | 1463 | $1,695 | $1.16 | 26d | 1 | 0.95mi |
| 803 W Jardin Dr Casa Grande, AZ | 3.0 | 2.0 | 1491 | $1,725 | $1.16 | 6d | 1 | 0.98mi |
| 1161 E O'Neil Dr Casa Grande, AZ | 2.0–4.0 | 2.0 | 1144 | $1,295 | $1.13 | 0d | 13 | 0.98mi |
| 776 W Fairlane Ct Casa Grande, AZ | 3.0 | 2.0 | 1489 | $3,200 | $2.15 | 26d | 1 | 1.01mi |
| 1620 N Trekell Rd Casa Grande, AZ | 1.0–3.0 | 1.0–2.5 | 1090 | $2,165 | $1.99 | 0d | 1 | 1.01mi |
| 845 W Crooked Stick Dr Casa Grande, AZ | 3.0 | 2.0 | 1601 | $2,000 | $1.25 | 26d | 1 | 1.05mi |
| 541 W Melrose Dr Casa Grande, AZ | 3.0 | 2.0 | 1101 | $1,600 | $1.45 | 26d | 1 | 1.16mi |
| 1139 E Yucca St Casa Grande, AZ | 3.0 | 3.0 | 1300 | $1,800 | $1.38 | 26d | 1 | 1.27mi |
| 1100 N Brown Ave Casa Grande, AZ | 3.0 | 2.0 | 1609 | $1,950 | $1.21 | 0d | 1 | 1.42mi |
| 700 E Rodeo Rd Casa Grande, AZ | 2.0 | 1.0–2.0 | 828 | $1,436 | $1.73 | 0d | 24 | 1.45mi |
| 1010 N Park Ave Casa Grande, AZ | 2.0 | 1.0 | 920 | $1,100 | $1.20 | 14d | 1 | 1.48mi |
Listing history 16 events
-
2026-06-21days on market $179,900 Active 75 DOM
-
2026-06-18days on market $179,900 Active 72 DOM
-
2026-06-17days on market $179,900 Active 71 DOM
-
2026-06-16days on market $179,900 Active 70 DOM
-
2026-06-15days on market $179,900 Active 69 DOM
-
2026-06-13days on market $179,900 Active 67 DOM
-
2026-06-13days on market $179,900 Active 66 DOM
-
2026-06-09days on market $179,900 Active 63 DOM
-
2026-06-08days on market $179,900 Active 62 DOM
-
2026-06-07days on market $179,900 Active 61 DOM
-
2026-06-04days on market $179,900 Active 58 DOM
-
2026-06-03days on market $179,900 Active 57 DOM
-
2026-06-02days on market $179,900 Active 56 DOM
-
2026-06-01days on market $179,900 Active 55 DOM
-
2026-05-31days on market $179,900 Active 54 DOM
-
2026-04-06$179,900 Active
ⓘ Source: listings_history table (triggers on properties + properties_extension) + one-shot
backfill from property_details.listing_events for pre-trigger history.
Climate risk First Street
- Flood 1/10 Low FEMA zone X (unshaded) · 0% chance over 30 yrs
- Wildfire 6/10 Major
- Heat 9/10 Extreme 7 d/yr ≥113°F today · 20 d/yr by 30 yrs out
- Wind 1/10 Low
- Air quality 2/10 Low 1 unhealthy d/yr today · 1 by 30 yrs out
Nearby sold comps map
Loading sold comps map…
Walkable amenities ~0.75 mi
Loading nearby amenities…
Taxation est. · year 1
- Rental income
- $21,966
- − Mortgage interest
- −$10,077
- − Property taxes
- −$2,698
- − Insurance
- −$900
- − Repairs & maintenance
- −$1,757
- − Management
- −$1,757
- − Depreciation
- −$5,233
- Taxable loss
- −$457
- Est. tax savings @ 24.0%
- +$110
- After-tax cash flow
- $2,544/yr
For passive investors: Depreciation is non-cash, so a rental often shows a tax loss while cash-flowing — sheltering income. Rental losses are passive: they offset passive income freely, and up to $25,000/yr can offset ordinary (W-2) income if you actively participate and your MAGI is under $100k (phasing out to $0 by $150k); unused losses carry forward. On sale, claimed depreciation is recaptured at up to 25%, and gains may owe capital-gains tax (a 1031 exchange can defer both). Figures are a year-1 estimate at your 24.0% rate — not tax advice; consult a CPA.
Condition & rehab AI · 12 photos
This well-maintained mobile home in a desirable community offers a good investment opportunity with minimal repairs and updates needed.
Value-add opportunities
- Both Paint exterior — Enhances curb appeal and value.
- Resale Replace carpet with tile — Improves durability and appearance.
- Resale Update kitchen appliances — Modernizes the space and adds value.
- Both Install smart home features — Enhances convenience and marketability.
Renovation cost estimate screening
Value-add ROI direction
- Both Paint exterior — Enhances curb appeal and value. ↑
- Resale Replace carpet with tile — Improves durability and appearance. ↑
- Resale Update kitchen appliances — Modernizes the space and adds value. ↑
- Both Install smart home features — Enhances convenience and marketability. ↑
ⓘ Cost ranges are severity-bucket heuristics (US national rule-of-thumb). Get contractor quotes + a written scope before underwriting a rehab budget.
Schools (NCES district)
- District
- Casa Grande Union High School District (4453)
- NCES district ID
- 0401740
- Math proficiency
- 14% ▼ -15.00%
- Reading proficiency
- 21% ▼ -10.00%
- Median HH income
- $45,373
- Composite
- 15.38/100
- National rank
- #9319
- State rank
- #193 of 249 in AZ
Livability — Casa Grande
- Score
- 58/100
- State rank
- #220
- US rank
- #21534
Category grades
Schools grade is shown separately in the Schools card above.
Census & demographics
- Census place
- Casa Grande, AZ
- County
- Pinal County · 399,947 people
- City population
- 69,701
- Metro
- Phoenix-Mesa-Chandler, AZ
- Population (ZIP)
- 61,624
- Household income
- $68,443
- Rent vs Own
- Severe rent burden
- 1250.0
Population outlook (Pinal County) Hauer SSP2
- Today (2025)
- 437,574 people
- By 2030
- 446,903 · +2.1%
- By 2040
- 452,589 · +3.4%
- By 2050
- 444,126 · +1.5%
- By 2075
- 430,300 · -1.7%
- By 2100
- 393,536 · -10.1%
Race, ethnicity, and origin ACS 2023
- Neighborhood character
- Diverse neighborhood (Simpson 0.63)
- Race & ethnicity
- Hispanic / Latino 44% White 42% Two or more races 21% Black 4% Native American 4% Asian 1%
- Hispanic origin (detail)
- Mexican 40%
- Common ancestry
- Lithuanian 1% Slovak 1% Portuguese 1%
- Foreign-born
- 12% · Canada
- Languages at home
- 75% English-only · Spanish 23% Tagalog/Filipino 1% Other Indo-European 1%
Political lean MEDSL · Pinal
- 2024 margin
- Strong R (+22.1) · D 38.5% · R 60.6%
- 2008→2024 swing
- -7.6pp toward R · 2008: -14.5pp · 2024: -22.1pp
- All cycles
- 2024: R+22.1 2020: R+17.3 2016: R+19.3 2012: R+17.1 2008: R+14.5
Not yet ingested
- Civics
- —
Market trends
- HPI YoY
- ▼ -67.32%
- Current HPI
- 233.148
- Rent YoY
- ▲ 4.60%
- Metro
- Phoenix-Mesa-Chandler, AZ
- State GDP YoY
- ▲ 4.54%
- F500 in state
- 20
Industry mix (Fortune 500 HQ in AZ)
| Industry | F500 HQs | Revenue |
|---|---|---|
| Technology | 2 | $13B |
|
||
| Mining / Metals | 1 | $23B |
|
||
| Environmental Services | 1 | $16B |
|
||
| Metals / Steel | 1 | $14B |
|
||
| Technology Distribution | 1 | $9B |
|
||
| Homebuilding | 1 | $8B |
|
||
Price history
1 event — show timeline
- 2026-04-06 Listed $179,900 ARMLS
Cash-flow waterfall
monthlySold comps — $/sqft
last 12 mo · ≤1 miLoading sold comps…