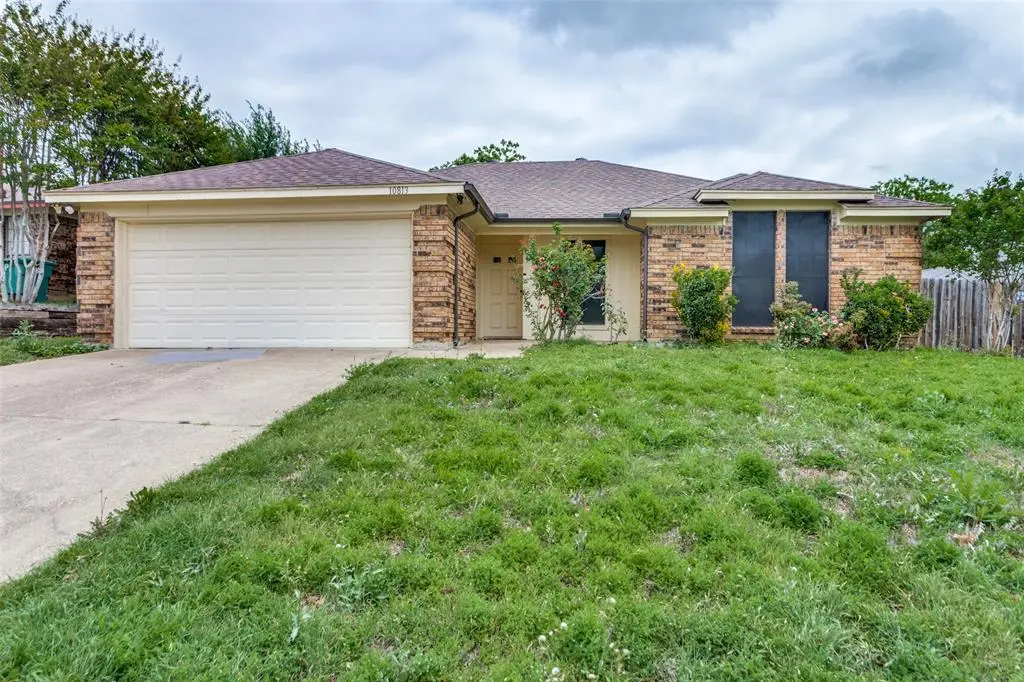
10813 Tall Oak Dr · Fort Worth, TX
Flood risk 1/10 · Minimal
- FEMA flood zone
- X (unshaded)
- Chance of flooding over 30 yrs
- 0.0%
- Est. flood insurance / yr
- $507 – $1,088
Fire risk 5/10 · Moderate
- Est. fire insurance / yr
- $1,222 – $2,270
Heat risk 7/10 · Major
- Hot days now (above 108°F)
- 7 days/yr
- Hot days in 30 yrs
- 23 days/yr
Wind risk 4/10 · Minor
- Chance of severe wind over 30 yrs
- 24.0%
Air-quality risk 3/10 · Minor
- Unhealthy air days now
- 3 days/yr
- Unhealthy air days in 30 yrs
- 4 days/yr
Risk factors via First Street. Map © Google.
Why this score? — see what drove the D+ grade
The composite is a weighted blend of 9 inputs, each scored 0–100. Each bar is that input's sub-score; the figure is the points it added to the 100-point composite (weight × sub-score).
- ARV discount +15.0/15.0
- Cash flow +12.3/30.0
- 1% rule +4.7/10.0
- Livability +4.0/5.0
- DSCR +3.7/10.0
- Schools +3.5/10.0
- Rent growth +2.5/5.0
- Condition / age +2.5/5.0
- Appreciation +0.0/10.0
$199,900
🖨 Deal sheet (PDF) 📄 Offer letter ✓ Due diligence
Listing remarks
Maintained home in a desirable Fort Worth location with convenient access to major highways, shopping, and dining. This property features a functional and inviting layout with spacious living areas, ideal for both everyday living and entertaining. The kitchen offers ample storage and workspace, opening to comfortable living and dining areas. Enjoy a generously sized backyard with plenty of room for outdoor activities, pets, or future customization. A great opportunity for homeowners or investors seeking value and location in a growing area. This home is being sold AS-IS.
Key facts
- Convenient access
- Fort worth location
- Outdoor activities
Tags
Property features AI
Finance
- Other: Property listed under standard conditions; Possession at closing/funding
- Financial info: No second mortgage; Loan type treated as clear
- HOA & community: No homeowners association
Exterior
- Parking: Attached garage; 2 covered/garage spaces
- Utilities: City sewer; No municipal utility district
- Home design: Single-family residence; Residential property; Built in 1986; One story
- Construction: Year built: 1986
- Exterior features: Lot under 0.5 acre (about 0.171 acre); Subdivision: Chapel Creek
Interior
- Kitchen: Electric water heater
- Bedrooms: 3 bedrooms; Primary bedroom on level 1 (approx. 8 x 9)
- Bathrooms: 2 full bathrooms
- Interior features: One-level layout; One living area; One dining area; Other interior features
- Laundry & utility: Washer/dryer not specified
Neighborhood map
What this means for you Summary
Snapshot
- This is a 3-bed/2.0-bath single-family listed at $200k.
Deal economics
- At list price, monthly cash flow is $-36 ($-429/yr) — negative.
- To cash-flow at today's rent, offer at most $194k (3.2% below list).
- To meet the 1% rule (rent ≥ 1% of price), the offer needs to be $195k (2.7% below list).
- Recommended offer: $194k (3.2% below list) — sets the bar for cash-flow.
- Cap rate 6.1% vs local median 3.9% in Fort Worth — top-decile yield for the area; either an underpriced asset or a hidden risk that comps aren't pricing in. Stress-test before assuming the spread holds.
Location & tenants
- Location reads 80/100 on livability (#49 in TX, #1,954 nationally) — a professional / high-income tenant draw. Strengths: amenities A+, cost of living A+, housing A+; Watch: crime F.
- White Settlement ISD (rural): math 35% / reading 44% proficiency, ranked #396 of 826 in TX (top 48%) — families likely to look elsewhere, expect single-tenant / working-renter base with shorter leases.
- Zoned schools: Liberty El (math 38% / reading 42%, grade F, #1,514 of 4,322 statewide, top 36%, 546 students, 81% FRL); Brewer Middle (math 33% / reading 48%, grade F, #637 of 1,662 statewide, top 39%, 1,047 students, 63% FRL); Brewer H S (math 25% / reading 45%, grade F, #954 of 1,632 statewide, top 59%, 2,183 students, 56% FRL) — zoned schools average 67% FRL vs 49% district-wide (17 pts higher); higher-poverty schools than district average — tighter screening recommended.
- Market conditions: Rents soft (-0.2%/yr); 553 active listings in the ZIP; 40 comparable units currently listed for rent nearby; rentals at typical pace (median 27d on market — plan ~3-4 weeks tenant-placement turnaround); 45% of comp listings sitting > 30 days — soft ceiling on asking rent; solid renter incomes; 18,938 units permitted in Tarrant County in 2024 (8,336 in 5+ unit buildings).
Forward outlook
- Local home prices are declining (-3.0%/yr); year-one equity from $1k of loan paydown is wiped out by about $6k of value loss. Plan a longer hold.
- Tarrant County population projected at +41% by 2050 — long-run rental-demand tailwind backs the buy-and-hold thesis.
Negotiation context
- It's been on market 15 days — a 2% lower offer ($197k) is reasonable based on typical stale-listing flexibility.
Risks & watch-outs
- Watch-outs: property tax is 2.6% of price.
- Climate carrying-cost: moderate wildfire risk; extreme-heat days projected 7→23/yr by 2055 (HVAC capex compounding) — expect insurance premiums to compound above CPI over the hold.
Questions for the listing agent
- What do current leases actually rent for vs. the listed asking? Can we see a recent rent roll and the last 12 months of T-12 income?
- Property tax is high relative to price — has the assessment been appealed recently, and will the sale trigger a re-assessment?
- Is there a deadline driving the sale (1031 exchange, divorce, estate, relocation)? That informs how much negotiation room exists.
- Schools are D-rated, which usually means shorter tenancies and higher turnover. Who's the typical renter profile here, and what's been the actual vacancy rate?
- Crime grade is F in this area — have there been break-ins, vandalism, or insurance claims at this property in the last 3 years? What carrier currently insures it and at what premium?
- The area grade is low — what's the realistic commute time and amenity access for the typical tenant pool here? Any planned neighborhood developments (good or bad) we should know about?
- What's the average days-on-market for RENTAL listings here right now (not sales)? A rising rental-DOM trend means longer vacancies and softer asking-rent achievability than the comps imply.
- What's the recent tenant-quality profile in this submarket — average credit score on applications, eviction rate, late-payment / NSF rate, and stable-employment percentage? A property-management company in the area should have these aggregated.
- How much new for-sale + rental construction is in the pipeline within 1–3 miles? Heavy new supply typically softens prices + rents 12–24 months out; constrained supply supports both.
Investment metrics
- 1% rule
- 0.97% ✗
- Cap rate
- 6.08%
- Cash-on-cash
- -0.77%
- DSCR
- 0.97
- GRM
- 8.6
CMA / ARV
- ARV (on-the-fly)
- $284,208
- Comps found
- 12
Show comp detail 12 sales within ~0.75 mi
| Address | Dist | Beds/Ba | Sqft | Sold | Price | $/sf | Match |
|---|---|---|---|---|---|---|---|
| 10813 Tall Oak Dr | 0.00mi | 3/2.0 | 1,488 (0%) | 1mo | $199,900 | $134 | 99 |
| 604 Lionel Way | 0.27mi | 3/2.0 | 1,508 (+1%) | 3mo | $284,900 | $189 | 83 |
| 10304 Gray Oak Ln | 0.41mi | 3/2.0 | 1,520 (+2%) | 2mo | $290,000 | $191 | 75 |
| 717 Long Iron Dr | 0.40mi | 3/2.0 | 1,627 (+9%) | 1mo | $335,000 | $206 | 64 |
| 10129 Buffalo Grove Rd | 0.70mi | 3/2.0 | 1,486 (-0%) | 4mo | $269,000 | $181 | 64 |
| 10864 Live Oak Creek Dr | 0.49mi | 3/2.0 | 1,612 (+8%) | 3mo | $315,500 | $196 | 61 |
| 10508 Holly Grv | 0.29mi | 3/2.0 | 1,711 (+15%) | 2mo | $309,900 | $181 | 60 |
| 700 Blue Haze Dr | 0.63mi | 3/2.0 | 1,392 (-6%) | 2mo | $280,000 | $201 | 59 |
| 10323 Lone Pine Ln | 0.37mi | 3/2.0 | 1,706 (+15%) | 3mo | $289,900 | $170 | 55 |
| 10159 Powder Horn Rd | 0.67mi | 3/2.0 | 1,594 (+7%) | 3mo | $280,000 | $176 | 54 |
| 817 Long Iron Dr | 0.49mi | 3/2.0 | 1,694 (+14%) | 3mo | $330,000 | $195 | 52 |
| 425 Little Fox Ln | 0.73mi | 3/2.0 | 1,322 (-11%) | 1mo | $264,900 | $200 | 47 |
Match score weights: distance 35% · size 25% · config 20% · recency 20%. Top-matched comps best support the ARV.
Projected returns pro-forma
-3.0% appreciation · 0.0% rent growth · sell at horizon
- IRR
- -21.4%
- Equity multiple
- 0.28×
- Total profit
- $-40,221
- Equity at exit
- $29,806
- IRR
- -26.1%
- Equity multiple
- -0.06×
- Total profit
- $-59,386
- Equity at exit
- $17,284
Cash invested: $55,972 (down + closing). Projections, not guarantees.
Landlord ↔ Tenant lean methodology
- Overall (STATE)
- 87 Strongly Landlord-Friendly
- State Texas
- 87 Strongly Landlord-Friendly · R+5
- County
- — inherits STATE
- City
- — inherits STATE
ZIP-level market 76108
- Home prices YoY
- -32.5%
- Rents YoY
- -0.2%
- Active inventory
- 553
- Price-to-rent
- 8.6×
Monthly cashflow live
- Estimated rent
- $1,945 high interval (Pro) →
- Mortgage (P&I)
- −$1,048
- Tax from tax record
- −$441 /mo · $5,289/yr
- Insurance
- −$83
- HOA
- −$0
- Vacancy / Maint / Mgmt
- −$408
- Net cashflow
- $-36
Break-even live
Sensitivity live
| Price | -10% $77 | -5% $21 | +0% $-36 | +5% $-92 | +10% $-149 |
|---|---|---|---|---|---|
| Rent | -10% $-189 | -5% $-113 | +0% $-36 | +5% $41 | +10% $118 |
| Rate | -1.0pp $65 | -0.5pp $15 | base $-36 | +0.5pp $-88 | +1.0pp $-140 |
UW: 25.0% down · 7.5% · 30yr · 1.5% tax · 5.0% vac · 8.0% maint · 8.0% mgmt
Financing live
Cash to close
- Down payment
- $49,975
- Closing costs
- $5,997
- Reserves months
- —
- Total cash needed
- —
Loan-product check · same deal, 3 products live
Conventional
25% down · 7.5% · 30yr
- Down + closing
- —
- Monthly P&I
- —
- Monthly cashflow
- —
- DSCR
- —
- Eligible?
- —
Personal DTI + credit; lowest rate.
DSCR
20% down · 8.5% · 30yr
- Down + closing
- —
- Monthly P&I
- —
- Monthly cashflow
- —
- DSCR
- —
- Eligible?
- —
No personal income docs; deal must DSCR.
Hard money
10% down · 12.0% · 12mo
- Down + closing
- —
- Monthly P&I
- —
- Monthly cashflow
- —
- DSCR
- —
- Eligible?
- —
Short-term bridge; refi at stabilization.
Rent comps 40 comps
| Address | Beds | Baths | Sqft | Rent | $/sqft | DOM | Units | Dist |
|---|---|---|---|---|---|---|---|---|
| 10517 Lone Pine Ln Fort Worth, TX | 3.0 | 2.0 | 1706 | $2,145 | $1.26 | 46d | 1 | 0.22mi |
| 613 Deauville Dr Unit rent one bd-one bath Fort Worth, TX | 3.0 | 2.0 | 1460 | $900 | $0.62 | 46d | 1 | 0.26mi |
| 459 Little Valley Ct Fort Worth, TX | 3.0 | 2.0 | 1382 | $1,895 | $1.37 | 1d | 1 | 0.37mi |
| 453 Little Valley Ct Fort Worth, TX | 3.0 | 2.0 | 1300 | $1,795 | $1.38 | 1d | 1 | 0.37mi |
| 10317 Lone Pine Ln Fort Worth, TX | 3.0 | 2.0 | 1180 | $1,750 | $1.48 | 7d | 1 | 0.38mi |
| 10721 Deauville Dr Fort Worth, TX | 3.0 | 1.5 | 1091 | $1,695 | $1.55 | 1d | 1 | 0.39mi |
| 10307 Lone Pine Ln Fort Worth, TX | 3.0 | 2.0 | 1174 | $1,500 | $1.28 | 9d | 1 | 0.42mi |
| 10248 Westward Dr Fort Worth, TX | 3.0 | 2.0 | 1575 | $2,250 | $1.43 | 15d | 1 | 0.48mi |
| 10913 Ives St Fort Worth, TX | 3.0 | 2.0 | 1575 | $1,751 | $1.11 | 24d | 1 | 0.49mi |
| 10275 Aurora Dr Fort Worth, TX | 2.0 | 2.0 | 880 | $1,450 | $1.65 | 46d | 1 | 0.49mi |
| 10917 Ives St Fort Worth, TX | 4.0 | 2.0 | 1772 | $2,170 | $1.22 | 26d | 1 | 0.50mi |
| 10258 Aurora Dr Fort Worth, TX | 2.0 | 2.0 | 1231 | $1,150 | $0.93 | 46d | 1 | 0.51mi |
| 10253 Sunset View Dr Fort Worth, TX | 4.0 | 2.0 | 1640 | $2,095 | $1.28 | 46d | 1 | 0.52mi |
| 10258 Maverick Dr Unit 58 Fort Worth, TX | 3.0 | 2.0 | 940 | $1,595 | $1.70 | 4d | 1 | 0.52mi |
| 851 Village Point Ln Fort Worth, TX | 3.0 | 2.5 | 1322 | $1,799 | $1.36 | 24d | 1 | 0.53mi |
| 10909 Deauville Cir S Fort Worth, TX | 3.0 | 2.0 | 1360 | $1,900 | $1.40 | 23d | 1 | 0.57mi |
| 556 Blue Haze Dr Fort Worth, TX | 3.0 | 2.0 | 1402 | $1,980 | $1.41 | 46d | 1 | 0.59mi |
| 10205 Lone Pine Ln Fort Worth, TX | 3.0 | 2.0 | 1681 | $1,850 | $1.10 | 46d | 1 | 0.63mi |
| 10217 Maverick Dr Fort Worth, TX | 3.0 | 2.0 | 1492 | $2,045 | $1.37 | 46d | 1 | 0.63mi |
| 11012 Gray Mare Dr Fort Worth, TX | 3.0 | 2.0 | 1316 | $2,010 | $1.53 | 26d | 1 | 0.66mi |
| 10116 Bugle Dr Fort Worth, TX | 3.0 | 2.0 | 1341 | $1,850 | $1.38 | 46d | 1 | 0.68mi |
| 904 Burlington Ave Fort Worth, TX | 3.0–5.0 | 2.0–2.5 | 1895 | $2,220 | $1.17 | 0d | 1 | 0.68mi |
| 120 Flaxseed Ln Fort Worth, TX | 3.0 | 2.0 | 1406 | $1,950 | $1.39 | 46d | 1 | 0.70mi |
| 217 N Bugle Dr Fort Worth, TX | 3.0 | 2.0 | 1170 | $1,900 | $1.62 | 15d | 1 | 0.73mi |
| 101 N Bugle Dr Fort Worth, TX | 4.0 | 1.0 | 1231 | $1,650 | $1.34 | 5d | 1 | 0.75mi |
| 933 Burlington Ave Fort Worth, TX | 3.0 | 2.0 | 1316 | $2,010 | $1.53 | 46d | 1 | 0.76mi |
| 10124 Lone Eagle Dr Fort Worth, TX | 3.0 | 2.0 | 1040 | $1,495 | $1.44 | 26d | 1 | 0.79mi |
| 10008 Buffalo Grove Rd Fort Worth, TX | 3.0 | 2.0 | 1801 | $1,979 | $1.10 | 5d | 1 | 0.80mi |
| 10129 Peppertree Ln Fort Worth, TX | 3.0 | 2.0 | 1094 | $1,795 | $1.64 | 5d | 1 | 0.86mi |
| 108 Prospector Ct Fort Worth, TX | 3.0 | 1.5 | 1143 | $1,695 | $1.48 | 46d | 1 | 0.89mi |
| 616 Reveille Rd Fort Worth, TX | 3.0 | 2.0 | 1100 | $1,695 | $1.54 | 4d | 1 | 0.89mi |
| 701 Admiralty Way Fort Worth, TX | 3.0 | 2.0 | 1265 | $1,775 | $1.40 | 26d | 1 | 0.94mi |
| 9984 Lone Eagle Dr Fort Worth, TX | 3.0 | 1.5 | 1324 | $1,650 | $1.25 | 7d | 1 | 0.97mi |
| 120 Callender Dr Fort Worth, TX | 3.0 | 2.0 | 1574 | $1,767 | $1.12 | 46d | 1 | 0.99mi |
| 132 Callender Dr Fort Worth, TX | 3.0 | 2.5 | 1739 | $1,810 | $1.04 | 46d | 1 | 1.00mi |
| 1144 Terrace View Dr Fort Worth, TX | 3.0 | 2.0 | 1680 | $1,975 | $1.18 | 15d | 1 | 1.00mi |
| 11100 Santana Dr Fort Worth, TX | 3.0 | 2.0 | 1229 | $2,340 | $1.90 | 46d | 1 | 1.01mi |
| 9904 Ivy Leaf Ln Fort Worth, TX | 3.0 | 2.0 | 1697 | $2,195 | $1.29 | 46d | 1 | 1.07mi |
| 708 Annapolis Dr Fort Worth, TX | 3.0 | 2.0 | 1360 | $1,700 | $1.25 | 46d | 1 | 1.07mi |
| 533 Annapolis Dr Fort Worth, TX | 3.0 | 2.0 | 1323 | $1,795 | $1.36 | 46d | 1 | 1.09mi |
Listing history 5 events
-
2026-05-05status Pending
-
2026-04-27historical Active Option Contract
-
2026-04-20$199,900 Active
-
2026-04-01soldstatus
-
1986-05-22soldstatus
ⓘ Source: listings_history table (triggers on properties + properties_extension) + one-shot
backfill from property_details.listing_events for pre-trigger history.
Tax reassessment forecast TX · Resets to sale price
- Current annual tax
- $5,289 · $441/mo
- Projected year-2 tax
- $5,289 · $441/mo
- Expected delta
- $0/yr ($0/mo · 0.0%)
ⓘ Screening estimate from a state-policy table — verify with the county assessor before closing.
Climate risk First Street
- Flood 1/10 Low FEMA zone X (unshaded) · 0% chance over 30 yrs
- Wildfire 5/10 Major
- Heat 7/10 Severe 7 d/yr ≥108°F today · 23 d/yr by 30 yrs out
- Wind 4/10 Moderate 24% chance of damaging wind over 30 yrs
- Air quality 3/10 Moderate 3 unhealthy d/yr today · 4 by 30 yrs out
Nearby sold comps map
Loading sold comps map…
Walkable amenities ~0.75 mi
Loading nearby amenities…
Taxation est. · year 1
- Rental income
- $23,341
- − Mortgage interest
- −$11,198
- − Property taxes
- −$5,289
- − Insurance
- −$1,000
- − Repairs & maintenance
- −$1,867
- − Management
- −$1,867
- − Depreciation
- −$5,815
- Taxable loss
- −$3,695
- Est. tax savings @ 24.0%
- +$887
- After-tax cash flow
- $458/yr
For passive investors: Depreciation is non-cash, so a rental often shows a tax loss while cash-flowing — sheltering income. Rental losses are passive: they offset passive income freely, and up to $25,000/yr can offset ordinary (W-2) income if you actively participate and your MAGI is under $100k (phasing out to $0 by $150k); unused losses carry forward. On sale, claimed depreciation is recaptured at up to 25%, and gains may owe capital-gains tax (a 1031 exchange can defer both). Figures are a year-1 estimate at your 24.0% rate — not tax advice; consult a CPA.
Schools (NCES district)
- District
- White Settlement ISD
- NCES district ID
- 4845540
- Math proficiency
- 35% ▼ -10.00%
- Reading proficiency
- 44% ▼ -4.00%
- Median HH income
- $56,055
- Composite
- 34.63/100
- National rank
- #5151
- State rank
- #396 of 826 in TX
Livability — Fort Worth
- Score
- 80/100
- State rank
- #49
- US rank
- #1954
Category grades
Schools grade is shown separately in the Schools card above.
Census & demographics
- Census place
- Fort Worth, TX
- County
- Tarrant County · 2,033,669 people
- City population
- 911,619
- Metro
- Dallas-Fort Worth-Arlington, TX
- Population (ZIP)
- 45,537
- Household income
- $80,412
- Rent vs Own
- Severe rent burden
- 774.0
Population outlook (Tarrant County) Hauer SSP2
- Today (2025)
- 2,380,417 people
- By 2030
- 2,578,900 · +8.3%
- By 2040
- 2,974,995 · +25.0%
- By 2050
- 3,350,489 · +40.8%
- By 2075
- 4,216,909 · +77.2%
- By 2100
- 4,741,527 · +99.2%
Race, ethnicity, and origin ACS 2023
- Neighborhood character
- Diverse neighborhood (Simpson 0.62)
- Race & ethnicity
- White 52% Hispanic / Latino 32% Two or more races 17% Black 8% Asian 3% Native American 1%
- Hispanic origin (detail)
- Mexican 26% Puerto Rican 1%
- Common ancestry
- Slovak 2% Lithuanian 1% Romanian 1%
- Foreign-born
- 11% · Canada, Vietnam
- Languages at home
- 76% English-only · Spanish 21% Vietnamese 1% Tagalog/Filipino 1%
Political lean MEDSL · Tarrant
- 2024 margin
- Lean R (+5.1) · D 46.7% · R 51.9% · Other 1.4%
- 2008→2024 swing
- +6.6pp toward D · 2008: -11.7pp · 2024: -5.1pp
- All cycles
- 2024: R+5.1 2020: D+0.2 2016: R+8.7 2012: R+15.7 2008: R+11.7
Not yet ingested
- Civics
- —
Market trends
- HPI YoY
- ▼ -141.39%
- Current HPI
- 294.2459
- Rent YoY
- ▼ -0.18%
- Metro
- Dallas-Fort Worth-Arlington, TX
- State GDP YoY
- ▲ 3.95%
- F500 in state
- 110
Industry mix (Fortune 500 HQ in TX)
| Industry | F500 HQs | Revenue |
|---|---|---|
| Energy | 16 | $1,198B |
|
||
| Technology | 5 | $198B |
|
||
| Engineering / Construction | 4 | $72B |
|
||
| Energy Services | 3 | $60B |
|
||
| Utilities | 3 | $41B |
|
||
| Healthcare | 2 | $330B |
|
||
Price history
5 events — show timeline
- 2026-05-05 Pending — NTREIS
- 2026-04-27 Contingent — NTREIS
- 2026-04-20 Listed $199,900 NTREIS
- 2026-04-01 Sold (Public Records) — Public Records
- 1986-05-22 Sold (Public Records) — Public Records
Property tax history
+4.1%/yrLatest (2025): $5,289 · -2.4% YoY. Source: county tax records.
Cash-flow waterfall
monthlySold comps — $/sqft
last 12 mo · ≤1 miLoading sold comps…