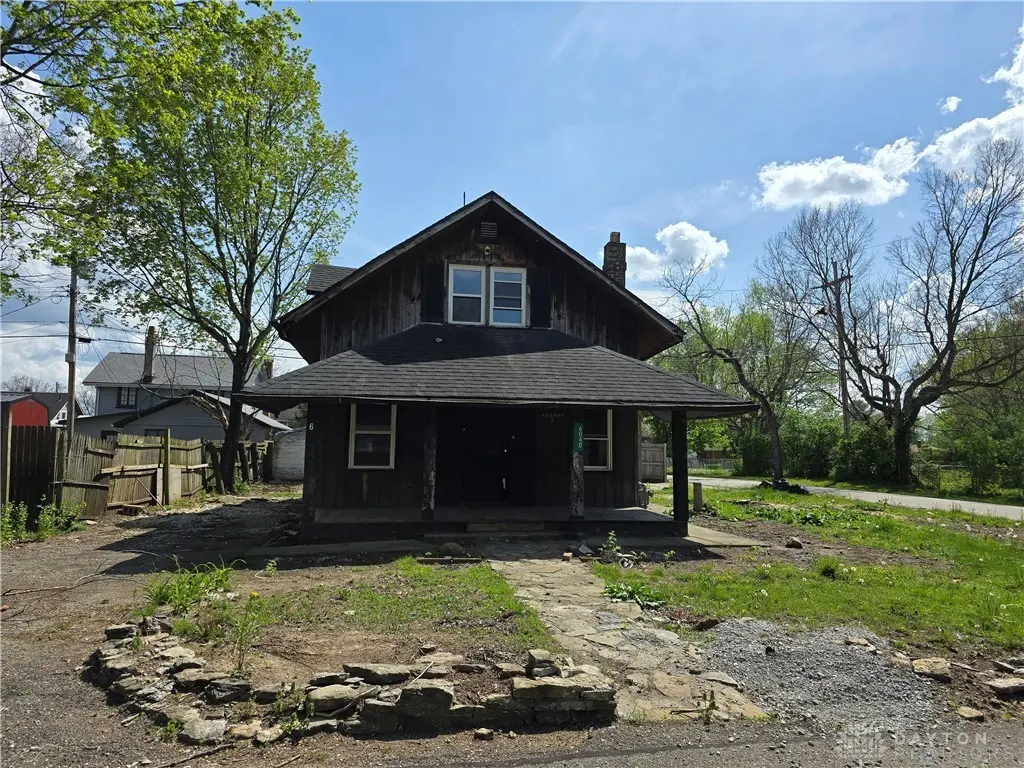
6040 6th Ave · Carlisle, OH
Flood risk 1/10 · Minimal
- FEMA flood zone
- X (shaded)
- Chance of flooding over 30 yrs
- 0.0%
- Est. flood insurance / yr
- $507 – $1,088
Fire risk 1/10 · Minimal
- Est. fire insurance / yr
- $713 – $1,323
Heat risk 4/10 · Minor
- Hot days now (above 101°F)
- 7 days/yr
- Hot days in 30 yrs
- 19 days/yr
Wind risk 2/10 · Minimal
- Chance of severe wind over 30 yrs
- 1.0%
Air-quality risk 3/10 · Minor
- Unhealthy air days now
- 2 days/yr
- Unhealthy air days in 30 yrs
- 4 days/yr
Risk factors via First Street. Map © Google.
Why this score? — see what drove the B grade
The composite is a weighted blend of 9 inputs, each scored 0–100. Each bar is that input's sub-score; the figure is the points it added to the 100-point composite (weight × sub-score).
- Cash flow +30.0/30.0
- 1% rule +10.0/10.0
- DSCR +10.0/10.0
- ARV discount +7.5/15.0
- Schools +5.1/10.0
- Livability +3.6/5.0
- Rent growth +3.3/5.0
- Condition / age +2.5/5.0
- Appreciation +0.0/10.0
$65,000
🖨 Deal sheet 📄 Offer letter ✓ Due diligence
Listing remarks MLS
This home is definitely a diamond in the rough, but the possibilities are endless to create your dream home. Bring your imagination and your tool belt! Being sold As Is. Won't pass FHA/VA/USDA.
Key facts
- 3,376 sq ft lot
- Built 1930
- Listed 420 days
Neighborhood map
What this means for you Summary
Snapshot
- This is a 2-bed/1.0-bath single-family listed at $65k.
Deal economics
- At list price, monthly cash flow is $410 ($5k/yr) — positive.
- The deal already cash-flows at list — no discount required.
- Meets the 1% rule at list price ($1k rent vs $65k).
- Recommended offer: $57k (12.0% below list) — sets the bar for market timing.
- Cap rate 13.9% vs local median 3.6% in Carlisle — top-decile yield for the area; either an underpriced asset or a hidden risk that comps aren't pricing in. Stress-test before assuming the spread holds.
Location & tenants
- Location reads 72/100 on livability (#365 in OH) — a middle-class / working-renter tenant base. Strengths: cost of living A+, housing A+, schools B+; Watch: amenities F, commute F, health & safety F.
- Carlisle Local (suburban): math 57% / reading 62% proficiency, ranked #287 of 656 in OH (top 44%) — acceptable for families but not a draw, mixed tenant base, ~2y average lease.
- Market conditions: Rents rising (+3.3%/yr); 113 active listings in the ZIP; 1 comparable units currently listed for rent nearby; solid renter incomes; 907 units permitted in Montgomery County in 2024 (416 in 5+ unit buildings).
- This rent is only 18% of the median local income ($85k/yr) — well below the 30% rent-burden line; pricing power to push rent on renewal without tenant pushback.
Forward outlook
- Local home prices are declining (-3.0%/yr); year-one equity from $449 of loan paydown is wiped out by about $2k of value loss. Plan a longer hold.
- Montgomery County population projected at -10% by 2050 — secular population decline; favor cash flow + early exit over multi-decade hold.
- At projected returns (-3.0% appreciation + 3.3% rent growth), your $18k cash investment doubles in ~5 years — after that, you're playing with house money.
Negotiation context
- It's been on market 420 days — a 12% lower offer ($57k) is reasonable based on typical stale-listing flexibility.
- 2 sale attempts since 2y ago with the ask held roughly flat each time — persistent listings suggest the price (not the market) is what's stuck; bring a comps-based counter.
Risks & watch-outs
- Watch-outs: property tax is 3.9% of price; built in 1930 — expect roof / HVAC / electrical / plumbing capex.
Questions for the listing agent
- It's been on market 420 days. Have you received any prior offers? Is the seller open to a 12% concession, seller financing, or rate buy-down credit?
- Built in 1930 — when were the roof, HVAC, electrical panel, plumbing, and water heater last replaced?
- Property tax is high relative to price — has the assessment been appealed recently, and will the sale trigger a re-assessment?
- Why hasn't it sold? Are there any deal-killer items the seller is aware of (foundation, flood, title, zoning, code violations)?
- Is there a deadline driving the sale (1031 exchange, divorce, estate, relocation)? That informs how much negotiation room exists.
- Schools are B-rated — typically a magnet for longer-tenancy family renters. What's the average tenant stay here, and is there a school-zone premium baked into asking?
- What's the average days-on-market for RENTAL listings here right now (not sales)? A rising rental-DOM trend means longer vacancies and softer asking-rent achievability than the comps imply.
- What's the recent tenant-quality profile in this submarket — average credit score on applications, eviction rate, late-payment / NSF rate, and stable-employment percentage? A property-management company in the area should have these aggregated.
- How much new for-sale + rental construction is in the pipeline within 1–3 miles? Heavy new supply typically softens prices + rents 12–24 months out; constrained supply supports both.
Investment metrics
- 1% rule
- 1.92% ✓
- Cap rate
- 13.86%
- Cash-on-cash
- 27.02%
- DSCR
- 2.20
- GRM
- 4.3
CMA / ARV
- ARV (median comp)
- $152,777
- List price
- $65,000
- Delta
- -57.45%
- Verdict
- UNDERPRICED
- Comps
- 20 within 1.0 mi
Show comp detail 11 sales within ~0.75 mi
| Address | Dist | Beds/Ba | Sqft | Sold | Price | $/sf | Match |
|---|---|---|---|---|---|---|---|
| 6042 Tenth Ave | 0.17mi | 3/1.5 (+1) | 1,008 (+6%) | 6mo | $245,000 | $243 | 69 |
| 6086 First Ave | 0.18mi | 2/1.0 | 986 (+4%) | 20mo | $86,000 | $87 | 68 |
| 6138 12th Ave | 0.23mi | 2/1.0 | 828 (-13%) | 8mo | $145,000 | $175 | 62 |
| 6011 Eighth Ave | 0.08mi | 3/1.0 (+1) | 1,044 (+10%) | 16mo | $140,000 | $134 | 61 |
| 153 Arthur Ave | 0.59mi | 2/1.0 | 912 (-4%) | 8mo | $160,000 | $175 | 59 |
| 250 Dale Ave | 0.63mi | 2/1.0 | 1,008 (+6%) | 4mo | $165,000 | $164 | 56 |
| 142 Willard Ave | 0.60mi | 3/1.0 (+1) | 912 (-4%) | 18mo | $40,000 | $44 | 46 |
| 140 Walnut Ave | 0.40mi | 3/1.0 (+1) | 1,056 (+11%) | 17mo | $215,000 | $204 | 43 |
| 157 Montgomery Ave | 0.55mi | 3/1.0 (+1) | 1,008 (+6%) | 20mo | $172,000 | $171 | 42 |
| 110 Fairview Dr | 0.65mi | 3/1.0 (+1) | 1,060 (+12%) | 9mo | $217,350 | $205 | 38 |
| 59 Janet Ave | 0.59mi | 3/1.5 (+1) | 1,075 (+13%) | 13mo | $235,000 | $219 | 32 |
Match score weights: distance 35% · size 25% · config 20% · recency 20%. Top-matched comps best support the ARV.
Projected returns pro-forma
-3.0% appreciation · 3.29% rent growth · sell at horizon
- IRR
- 21.4%
- Equity multiple
- 1.88×
- Total profit
- $16,032
- Equity at exit
- $9,692
- IRR
- 29.8%
- Equity multiple
- 3.72×
- Total profit
- $49,477
- Equity at exit
- $5,620
Cash invested: $18,200 (down + closing). Projections, not guarantees.
Landlord ↔ Tenant lean methodology
- Overall (STATE)
- 73 Landlord-Friendly
- State Ohio
- 73 Landlord-Friendly · R+6
- County
- — inherits STATE
- City
- — inherits STATE
ZIP-level market 45342
- Rents YoY
- 3.3%
- Active inventory
- 113
- Price-to-rent
- 4.3×
Monthly cashflow live
- Estimated rent
- $1,250 medium interval (Pro) →
- Mortgage (P&I)
- −$341
- Tax from tax record
- −$210 /mo · $2,515/yr
- Insurance
- −$27
- HOA
- −$0
- Vacancy / Maint / Mgmt
- −$262
- Net cashflow
- $410
Break-even live
Sensitivity live
| Price | -10% $447 | -5% $428 | +0% $410 | +5% $391 | +10% $373 |
|---|---|---|---|---|---|
| Rent | -10% $311 | -5% $360 | +0% $410 | +5% $459 | +10% $509 |
| Rate | -1.0pp $443 | -0.5pp $426 | base $410 | +0.5pp $393 | +1.0pp $376 |
UW: 25.0% down · 7.5% · 30yr · 1.5% tax · 5.0% vac · 8.0% maint · 8.0% mgmt
Financing live
Cash to close
- Down payment
- $16,250
- Closing costs
- $1,950
- Reserves months
- —
- Total cash needed
- —
Loan-product check · same deal, 3 products live
Conventional
25% down · 7.5% · 30yr
- Down + closing
- —
- Monthly P&I
- —
- Monthly cashflow
- —
- DSCR
- —
- Eligible?
- —
Personal DTI + credit; lowest rate.
DSCR
20% down · 8.5% · 30yr
- Down + closing
- —
- Monthly P&I
- —
- Monthly cashflow
- —
- DSCR
- —
- Eligible?
- —
No personal income docs; deal must DSCR.
Hard money
10% down · 12.0% · 12mo
- Down + closing
- —
- Monthly P&I
- —
- Monthly cashflow
- —
- DSCR
- —
- Eligible?
- —
Short-term bridge; refi at stabilization.
Rent comps 1 comps
| Address | Beds | Baths | Sqft | Rent | $/sqft | DOM | Units | Dist |
|---|---|---|---|---|---|---|---|---|
| 8778 Dayton Oxford Rd Franklin, OH | 2.0 | 1.0 | 800 | $954 | $1.19 | 2d | 18 | 0.81mi |
Listing history 17 events
-
2026-06-18days on market $65,000 Active 420 DOM
-
2026-06-17days on market $65,000 Active 419 DOM
-
2026-06-16days on market $65,000 Active 418 DOM
-
2026-06-15days on market $65,000 Active 417 DOM
-
2026-06-13days on market $65,000 Active 415 DOM
-
2026-06-13days on market $65,000 Active 414 DOM
-
2026-06-09days on market $65,000 Active 411 DOM
-
2026-06-08days on market $65,000 Active 410 DOM
-
2026-06-07days on market $65,000 Active 409 DOM
-
2026-06-05days on market $65,000 Active 406 DOM
-
2026-06-03days on market $65,000 Active 405 DOM
-
2026-06-02days on market $65,000 Active 404 DOM
-
2026-06-01days on market $65,000 Active 403 DOM
-
2026-05-31days on market $65,000 Active 402 DOM
-
2025-04-24$65,000 Active 194-char remark
Show marketing remark (194 chars)
This home is definitely a diamond in the rough, but the possibilities are endless to create your dream home. Bring your imagination and your tool belt! Being sold As Is. Won't pass FHA/VA/USDA.
-
2024-02-27historical
-
2024-02-19$55,000 Active
ⓘ Source: listings_history table (triggers on properties + properties_extension) + one-shot
backfill from property_details.listing_events for pre-trigger history.
Tax reassessment forecast OH · Partial reset (capped growth)
- Current annual tax
- $2,515 · $210/mo
- Projected year-2 tax
- $2,515 · $210/mo
- Expected delta
- $0/yr ($0/mo · 0.0%)
ⓘ Screening estimate from a state-policy table — verify with the county assessor before closing.
Climate risk First Street
- Flood 1/10 Low FEMA zone X (shaded) · 0% chance over 30 yrs
- Wildfire 1/10 Low
- Heat 4/10 Moderate 7 d/yr ≥101°F today · 19 d/yr by 30 yrs out
- Wind 2/10 Low 100% chance of damaging wind over 30 yrs
- Air quality 3/10 Moderate 2 unhealthy d/yr today · 4 by 30 yrs out
Nearby sold comps map
Loading sold comps map…
Walkable amenities ~0.75 mi
Loading nearby amenities…
Taxation est. · year 1
- Rental income
- $14,998
- − Mortgage interest
- −$3,641
- − Property taxes
- −$2,515
- − Insurance
- −$325
- − Repairs & maintenance
- −$1,200
- − Management
- −$1,200
- − Depreciation
- −$1,891
- Taxable income
- $4,226
- Est. tax owed @ 24.0%
- −$1,014
- After-tax cash flow
- $3,904/yr
For passive investors: Depreciation is non-cash, so a rental often shows a tax loss while cash-flowing — sheltering income. Rental losses are passive: they offset passive income freely, and up to $25,000/yr can offset ordinary (W-2) income if you actively participate and your MAGI is under $100k (phasing out to $0 by $150k); unused losses carry forward. On sale, claimed depreciation is recaptured at up to 25%, and gains may owe capital-gains tax (a 1031 exchange can defer both). Figures are a year-1 estimate at your 24.0% rate — not tax advice; consult a CPA.
Schools (NCES district)
- District
- Carlisle Local
- NCES district ID
- 3905041
- Math proficiency
- 57% ▼ -13.00%
- Reading proficiency
- 62% ▼ -11.00%
- Median HH income
- $57,519
- Composite
- 51.37/100
- National rank
- #1736
- State rank
- #287 of 656 in OH
Livability — Carlisle
- Score
- 72/100
- State rank
- #365
- US rank
- #5904
Category grades
Schools grade is shown separately in the Schools card above.
Census & demographics
- County
- Montgomery County · 459,541 people
- Metro
- Dayton-Kettering, OH
- Population (ZIP)
- 36,152
- Household income
- $84,907
- Rent vs Own
- Severe rent burden
- 790.0
Population outlook (Montgomery County) Hauer SSP2
- Today (2025)
- 523,241 people
- By 2030
- 514,948 · -1.6%
- By 2040
- 493,378 · -5.7%
- By 2050
- 469,639 · -10.2%
- By 2075
- 418,360 · -20.0%
- By 2100
- 353,315 · -32.5%
Race, ethnicity, and origin ACS 2023
- Neighborhood character
- Predominantly White (83%)
- Race & ethnicity
- White 83% Black 6% Two or more races 4% Asian 4% Hispanic / Latino 3%
- Common ancestry
- Slovak 2% Italian 2% Serbian 2%
- Foreign-born
- 6% · Canada, China
- Languages at home
- 93% English-only · Other Asian/Pacific 3% Spanish 2% Other Indo-European 1%
Political lean MEDSL · Montgomery
- 2024 margin
- Toss-up / Even · D 49.8% · R 49.3%
- 2008→2024 swing
- -5.8pp toward R · 2008: 6.2pp · 2024: 0.5pp
- All cycles
- 2024: D+0.5 2020: D+2.2 2016: R+1.2 2012: D+3.1 2008: D+6.2
Not yet ingested
- Civics
- —
Market trends
- HPI YoY
- ▼ -183.01%
- Current HPI
- 227.3999
- Rent YoY
- ▲ 3.29%
- Metro
- Dayton-Kettering, OH
- State GDP YoY
- ▲ 1.98%
- F500 in state
- 48
Industry mix (Fortune 500 HQ in OH)
| Industry | F500 HQs | Revenue |
|---|---|---|
| Insurance | 3 | $145B |
|
||
| Industrial Machinery | 3 | $49B |
|
||
| Financial Services | 3 | $24B |
|
||
| Consumer Goods | 2 | $93B |
|
||
| Aerospace / Defense | 2 | $47B |
|
||
| Utilities | 2 | $33B |
|
||
Price history
+18.2% since first listed3 events — show timeline
- 2025-04-24 Listed $65,000 Dayton MLS
- 2024-02-27 Listing Removed — Dayton MLS
- 2024-02-19 Listed $55,000 Dayton MLS
Property tax history
+10.0%/yrLatest (2025): $2,515 · +74.5% YoY. Source: county tax records.
Cash-flow waterfall
monthlySold comps — $/sqft
last 12 mo · ≤1 miLoading sold comps…